| Param | Original file | Final file |
|---|---|---|
| Filename | modeM0/AS1A09_138T04_9000003776_26128cztM0_level2.evt | modeM0/AS1A09_138T04_9000003776_26128cztM0_level2_quad_clean.evt |
| Size (bytes) | 791,311,680 | 161,170,560 |
| Size | 754.7 MB | 153.7 MB |
| Events in quadrant A | 5,898,519 | 1,035,631 |
| Events in quadrant B | 5,705,060 | 1,068,496 |
| Events in quadrant C | 6,021,903 | 1,013,933 |
| Events in quadrant D | 5,606,939 | 1,014,232 |
| Mode M9 | |||
|---|---|---|---|
| Quadrant | BADHDUFLAG | Total packets | Discarded packets |
| A | 0 | 27 | 0 |
| B | 0 | 27 | 0 |
| C | 0 | 27 | 0 |
| D | 0 | 27 | 0 |
| Mode M0 | |||
|---|---|---|---|
| Quadrant | BADHDUFLAG | Total packets | Discarded packets |
| A | 0 | 23712 | 0 |
| B | 0 | 23141 | 0 |
| C | 0 | 24216 | 0 |
| D | 0 | 23123 | 0 |
| Quadrant | Total seconds | Saturated seconds | Saturation percentage |
|---|---|---|---|
| A | 10823 | 175 | 1.616927% |
| B | 10822 | 211 | 1.949732% |
| C | 10823 | 307 | 2.836552% |
| D | 10823 | 148 | 1.367458% |
Noise dominated data is calculated using 1-second bins in cleaned event files. If a bin has >2000 counts, and if more than 50% of those come from <1% of pixels, then it is considered to be noise-dominated and hence unusable.
| Quadrant | # 1 sec bins | Bins with >0 counts | Bins with >2000 counts | High rate bins dominated by noise | Noise dominated (total time) | Noise dominated (detector-on time) | Marked lightcurve |
|---|---|---|---|---|---|---|---|
| A | 13483 | 10824 | 0 | 0 | 0.00% | 0.00% | 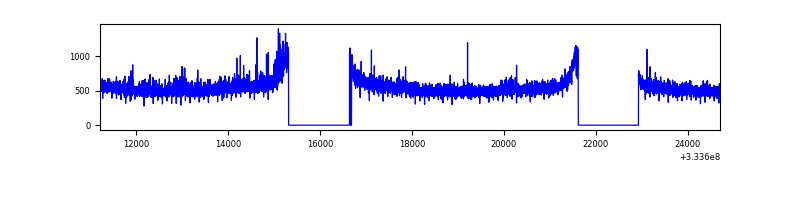 |
| B | 13483 | 10824 | 0 | 0 | 0.00% | 0.00% | 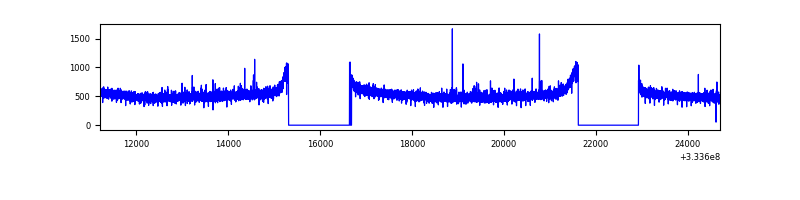 |
| C | 13483 | 10824 | 16 | 16 | 0.12% | 0.15% | 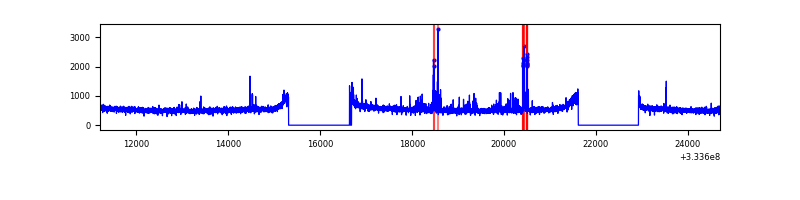 |
| D | 13483 | 10824 | 12 | 12 | 0.09% | 0.11% | 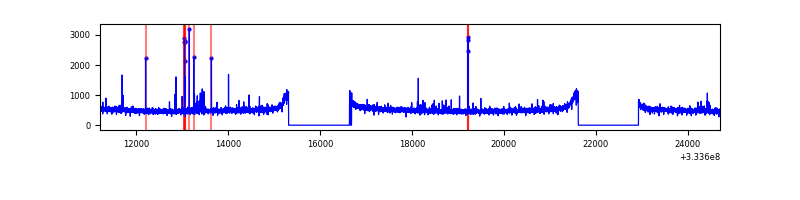 |
Top three noisy pixels from each quadrant. If the there are fewer than three noisy pixels in the level2.evt file, extra rows are filled as -1
| Pixel properties | Quadrant properties | ||||||
|---|---|---|---|---|---|---|---|
| Quadrant | DetID | PixID | Counts | Sigma | Mean | Median | Sigma |
| A | 0 | 13 | 226127 | 773.14 | 1469 | 1441 | 290.6 |
| A | 13 | 254 | 15109 | 47.03 | 1469 | 1441 | 290.6 |
| A | 6 | 16 | 13353 | 40.99 | 1469 | 1441 | 290.6 |
| B | 12 | 111 | 32148 | 114.13 | 1449 | 1417 | 269.3 |
| B | 11 | 111 | 29265 | 103.42 | 1449 | 1417 | 269.3 |
| B | 14 | 111 | 26831 | 94.38 | 1449 | 1417 | 269.3 |
| C | 14 | 238 | 227554 | 691.4 | 1411 | 1425 | 327.1 |
| C | 3 | 233 | 213038 | 647.02 | 1411 | 1425 | 327.1 |
| C | 2 | 16 | 74132 | 222.31 | 1411 | 1425 | 327.1 |
| D | 12 | 233 | 52873 | 150.43 | 1452 | 1423 | 342.0 |
| D | 2 | 234 | 40222 | 113.44 | 1452 | 1423 | 342.0 |
| D | 15 | 145 | 27093 | 75.05 | 1452 | 1423 | 342.0 |
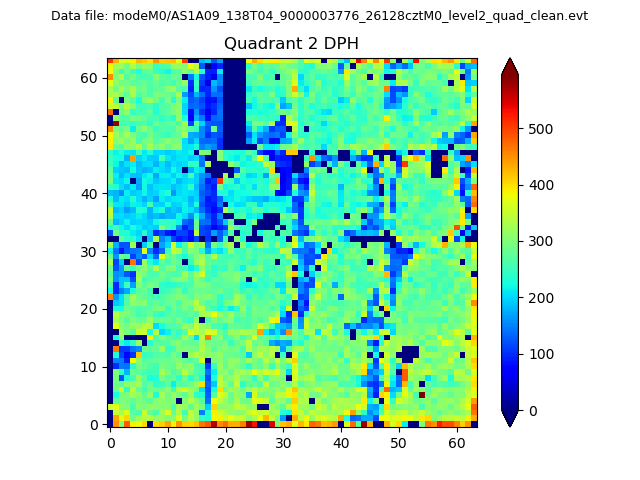
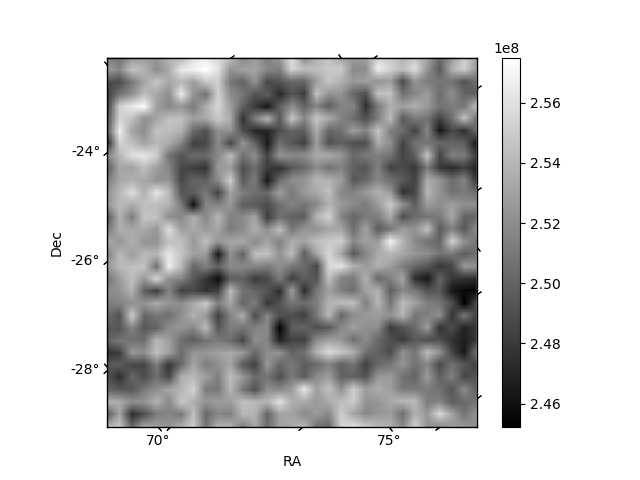
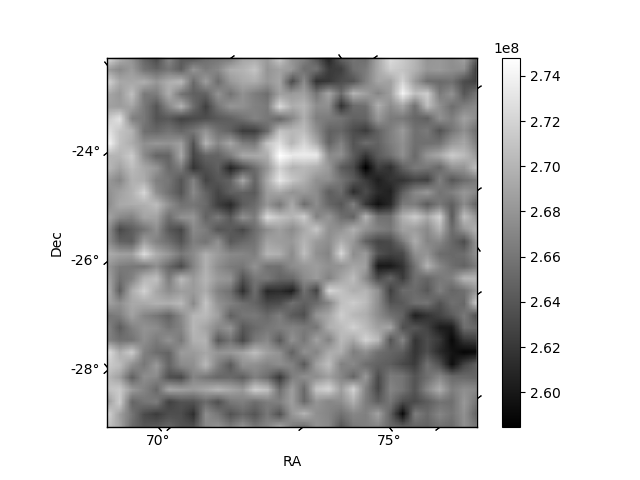
Histogram calculated using DETX and DETY for each event in the final _common_clean file
| Quadrant A | 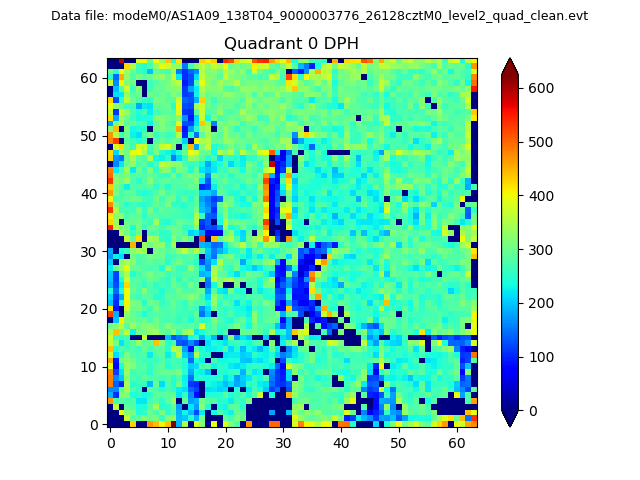 |
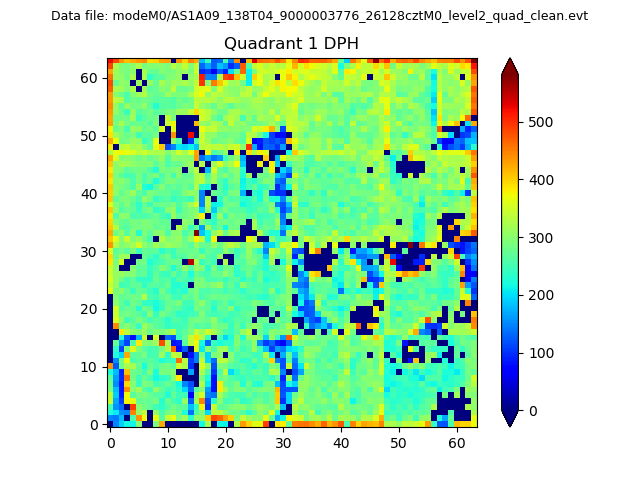 |
Quadrant B |
|---|---|---|---|
| Quadrant D | 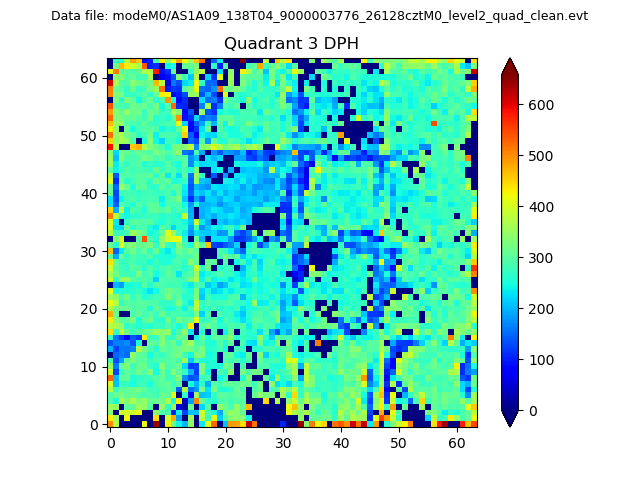 |
 |
Quadrant C |
| Plot type | Count rate plots | Images |
|---|---|---|
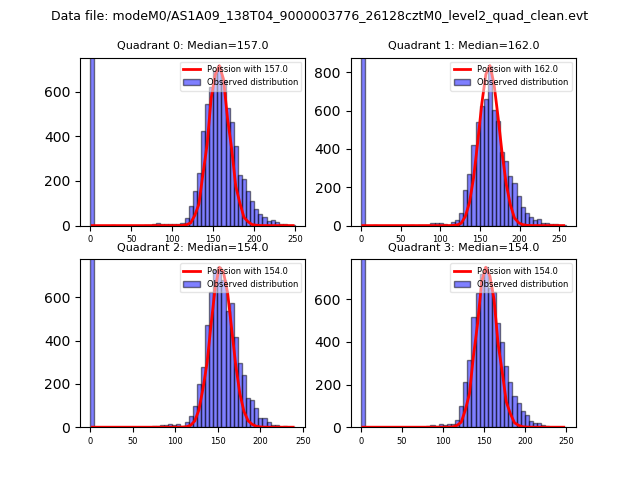
| Comparison with Poisson distribution Blue bars denote a histogram of data divided into 1 sec bins. Red curve is a Poisson curve with rate = median count rate of data. |
 |
 |
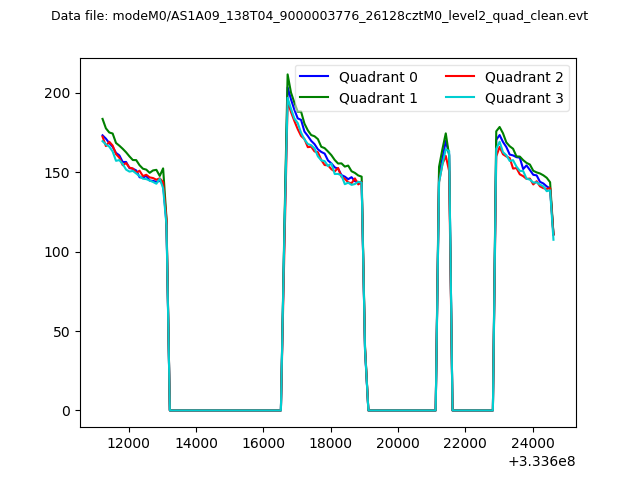
| Quadrant-wise count rates Data is divided into 100 sec bins |
 |
|
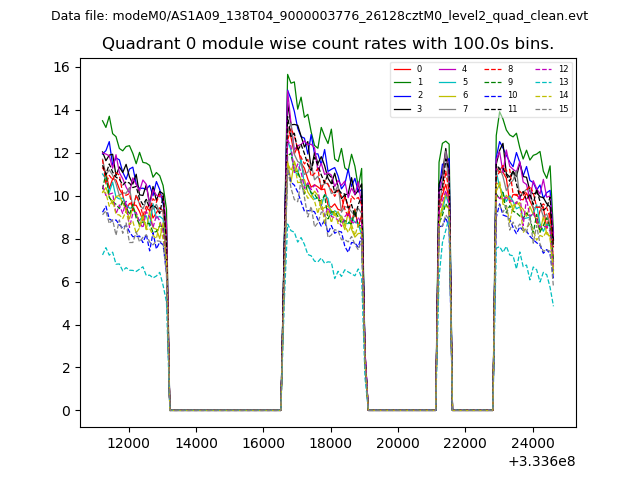
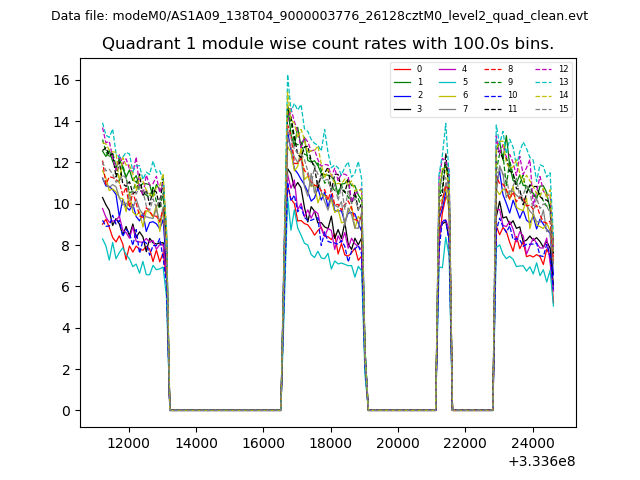
| Module-wise count rates for Quadrant A Data is divided into 100 sec bins |
 |
 |
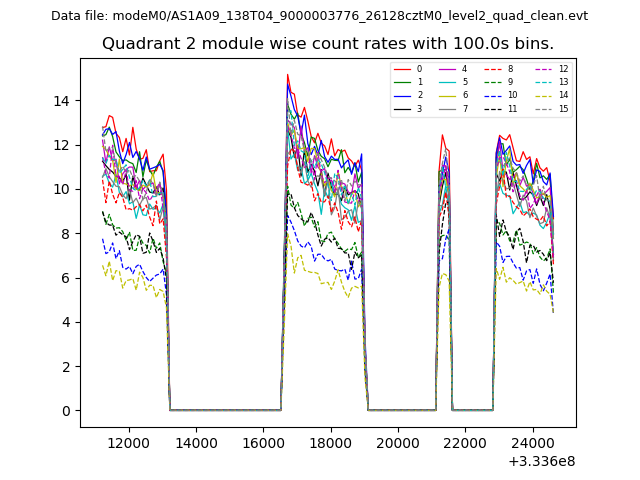
| Module-wise count rates for Quadrant B Data is divided into 100 sec bins |
 |
 |
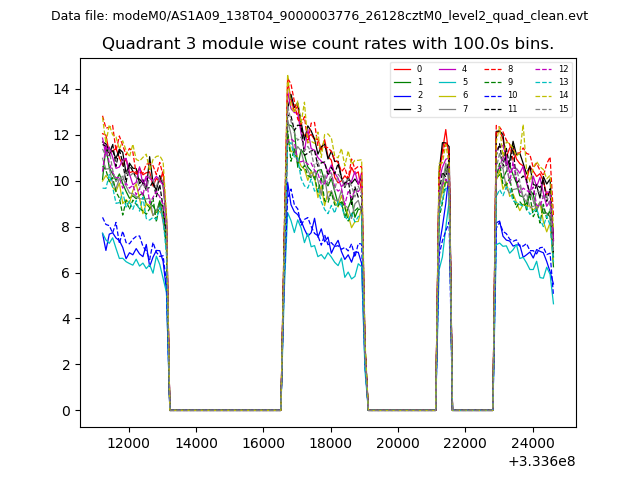
| Module-wise count rates for Quadrant C Data is divided into 100 sec bins |
 |
 |
| Module-wise count rates for Quadrant D Data is divided into 100 sec bins |
 |
 |
| Parameter | Plot |
|---|---|
| CZT HV Monitor | 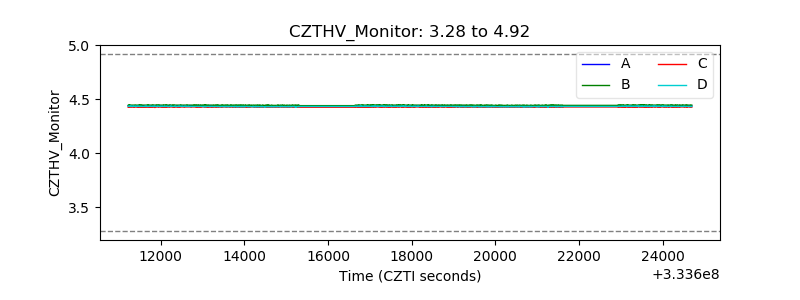 |
| D_VDD | 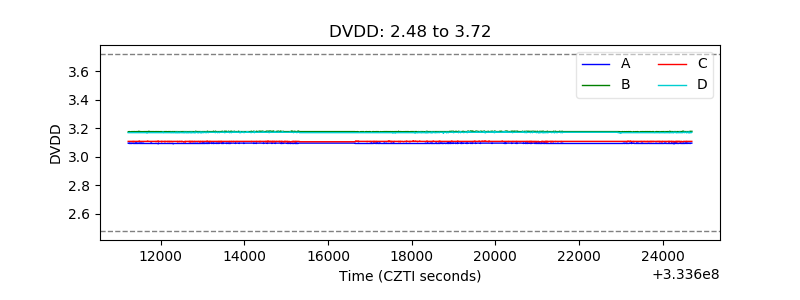 |
| Temperature 1 | 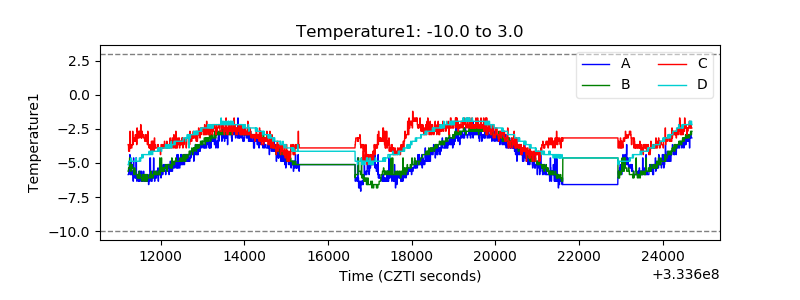 |
| Veto HV Monitor |  |
| Veto LLD | 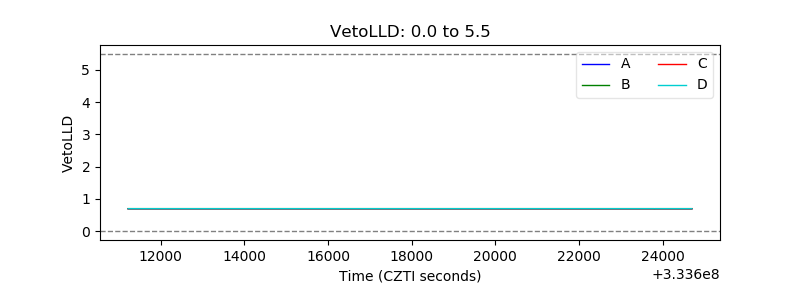 |
| Alpha Counter | 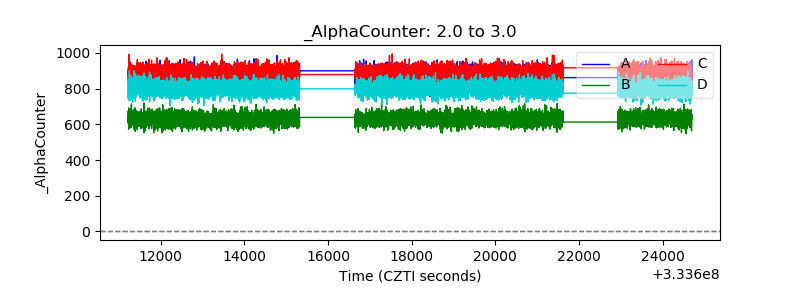 |
| _CPM_Rate | 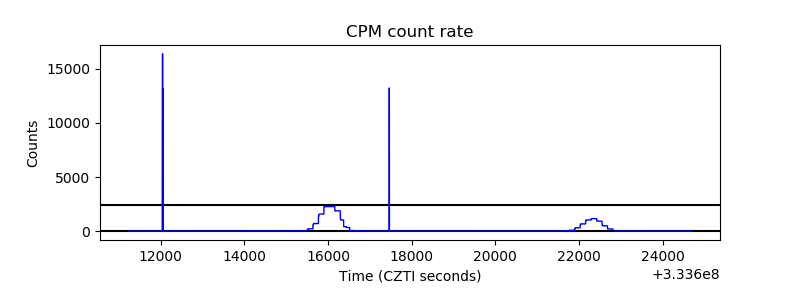 |
| CZT Counter | 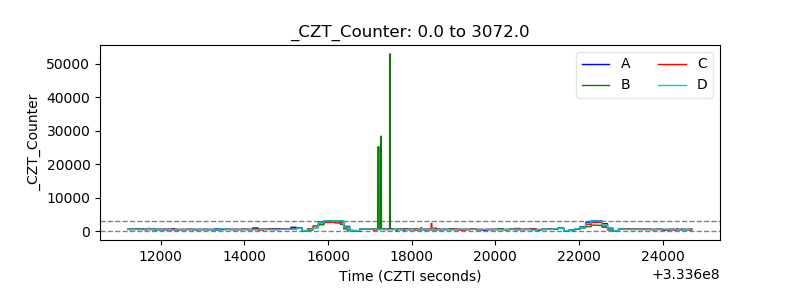 |
| +2.5 Volts monitor | 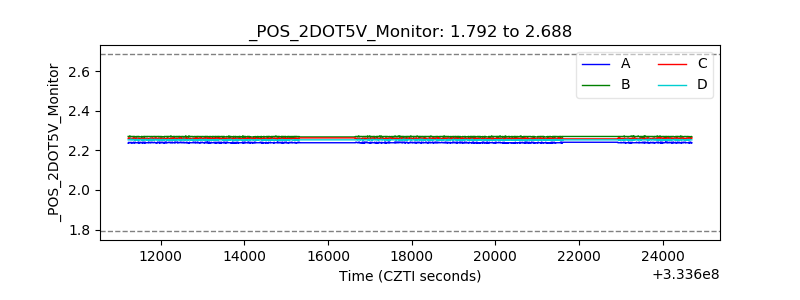 |
| +5 Volts monitor |  |
| _ROLL_ROT | 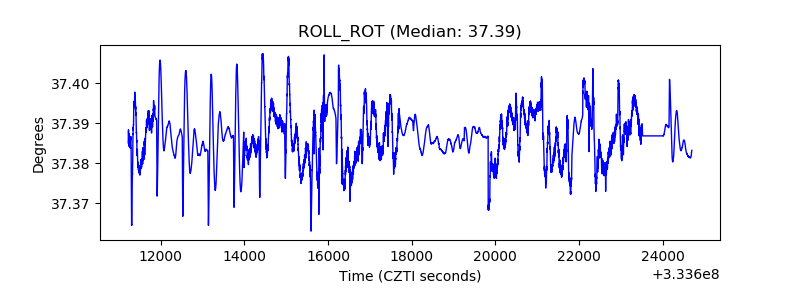 |
| _Roll_DEC | 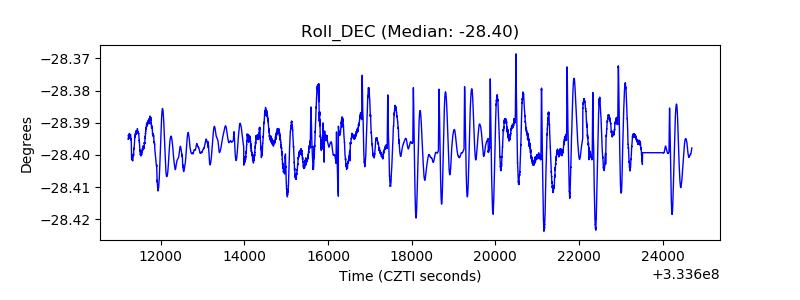 |
| _Roll_RA | 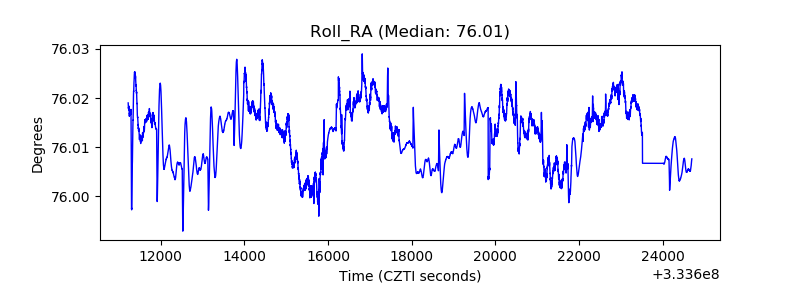 |
| Veto Counter | 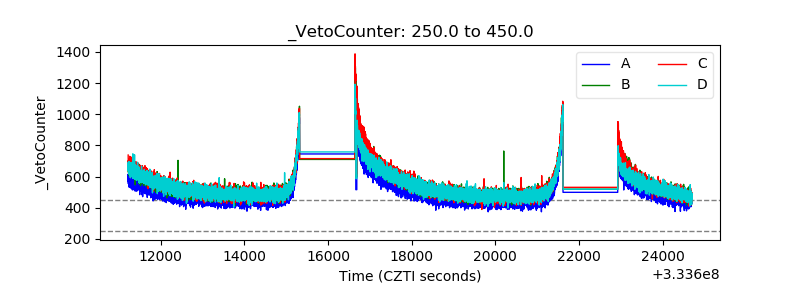 |