| Param | Original file | Final file |
|---|---|---|
| Filename | modeM0/AS1A09_138T04_9000003776_26130cztM0_level2.evt | modeM0/AS1A09_138T04_9000003776_26130cztM0_level2_quad_clean.evt |
| Size (bytes) | 535,305,600 | 92,802,240 |
| Size | 510.5 MB | 88.5 MB |
| Events in quadrant A | 4,324,187 | 585,814 |
| Events in quadrant B | 3,479,614 | 606,580 |
| Events in quadrant C | 3,529,015 | 575,197 |
| Events in quadrant D | 4,421,161 | 572,204 |
| Mode M9 | |||
|---|---|---|---|
| Quadrant | BADHDUFLAG | Total packets | Discarded packets |
| A | 0 | 6 | 0 |
| B | 0 | 6 | 0 |
| C | 0 | 6 | 0 |
| D | 0 | 6 | 0 |
| Mode M0 | |||
|---|---|---|---|
| Quadrant | BADHDUFLAG | Total packets | Discarded packets |
| A | 0 | 17332 | 0 |
| B | 0 | 14301 | 0 |
| C | 0 | 14556 | 0 |
| D | 0 | 17553 | 0 |
| Quadrant | Total seconds | Saturated seconds | Saturation percentage |
|---|---|---|---|
| A | 6747 | 152 | 2.252853% |
| B | 6748 | 141 | 2.089508% |
| C | 6748 | 129 | 1.911678% |
| D | 6748 | 194 | 2.874926% |
Noise dominated data is calculated using 1-second bins in cleaned event files. If a bin has >2000 counts, and if more than 50% of those come from <1% of pixels, then it is considered to be noise-dominated and hence unusable.
| Quadrant | # 1 sec bins | Bins with >0 counts | Bins with >2000 counts | High rate bins dominated by noise | Noise dominated (total time) | Noise dominated (detector-on time) | Marked lightcurve |
|---|---|---|---|---|---|---|---|
| A | 7397 | 6747 | 2 | 2 | 0.03% | 0.03% | 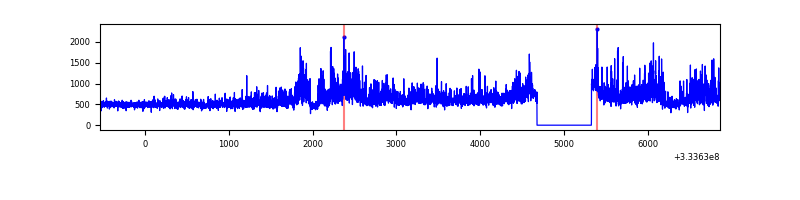 |
| B | 7398 | 6748 | 2 | 2 | 0.03% | 0.03% | 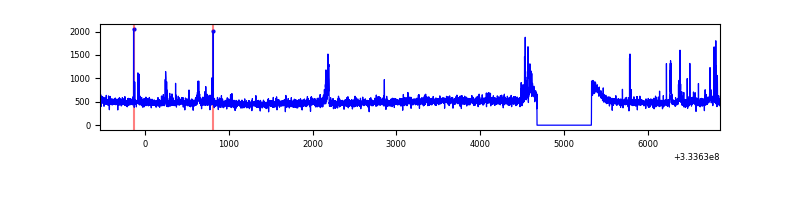 |
| C | 7398 | 6748 | 0 | 0 | 0.00% | 0.00% | 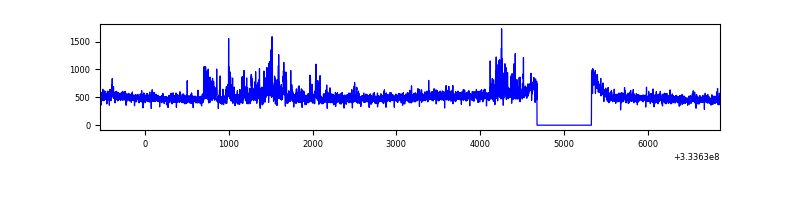 |
| D | 7398 | 6748 | 74 | 74 | 1.00% | 1.10% | 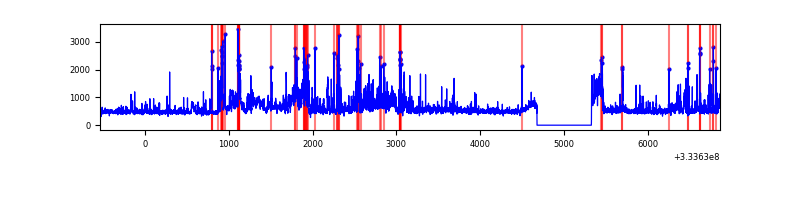 |
Top three noisy pixels from each quadrant. If the there are fewer than three noisy pixels in the level2.evt file, extra rows are filled as -1
| Pixel properties | Quadrant properties | ||||||
|---|---|---|---|---|---|---|---|
| Quadrant | DetID | PixID | Counts | Sigma | Mean | Median | Sigma |
| A | 0 | 13 | 1083825 | 6455.81 | 840 | 823 | 167.8 |
| A | 13 | 254 | 9888 | 54.03 | 840 | 823 | 167.8 |
| A | 3 | 137 | 7767 | 41.39 | 840 | 823 | 167.8 |
| B | 0 | 229 | 150636 | 931.74 | 835 | 814 | 160.8 |
| B | 0 | 190 | 33442 | 202.91 | 835 | 814 | 160.8 |
| B | 12 | 111 | 19496 | 116.18 | 835 | 814 | 160.8 |
| C | 3 | 233 | 202291 | 1065.97 | 807 | 811 | 189.0 |
| C | 14 | 238 | 127901 | 672.39 | 807 | 811 | 189.0 |
| C | 2 | 16 | 52873 | 275.44 | 807 | 811 | 189.0 |
| D | 1 | 52 | 1213064 | 6196.24 | 821 | 802 | 195.6 |
| D | 8 | 195 | 45609 | 229.02 | 821 | 802 | 195.6 |
| D | 12 | 233 | 30206 | 150.29 | 821 | 802 | 195.6 |
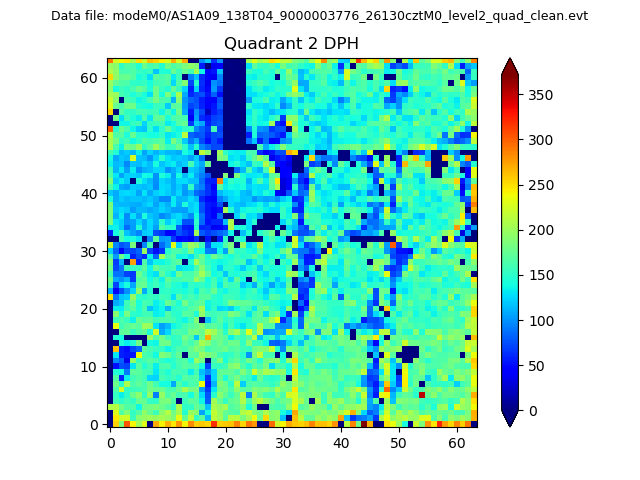
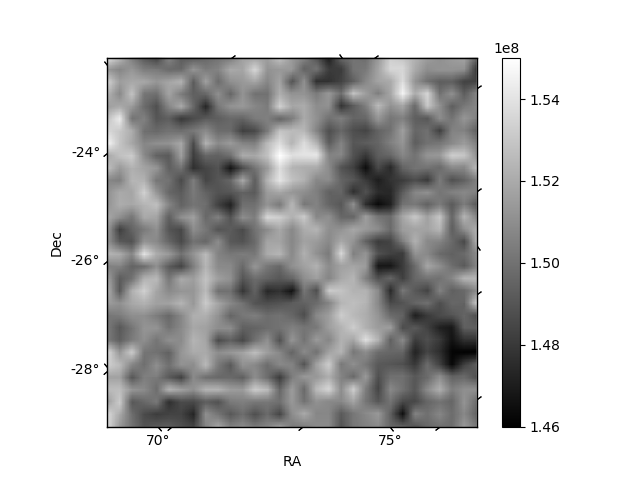
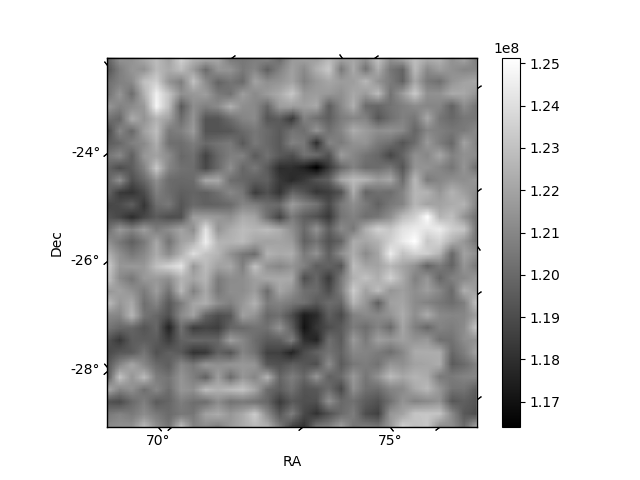
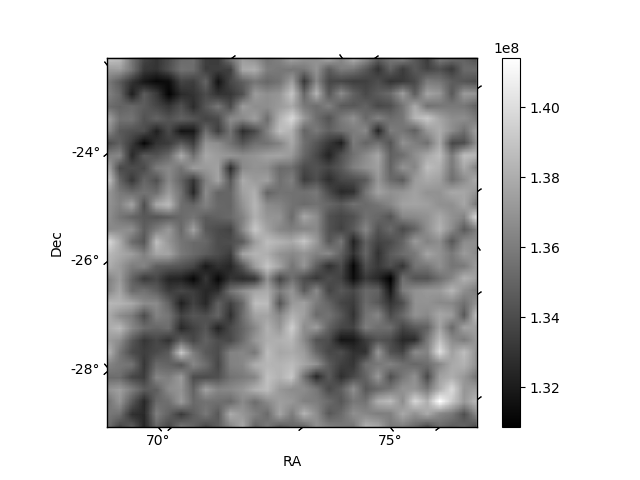
Histogram calculated using DETX and DETY for each event in the final _common_clean file
| Quadrant A | 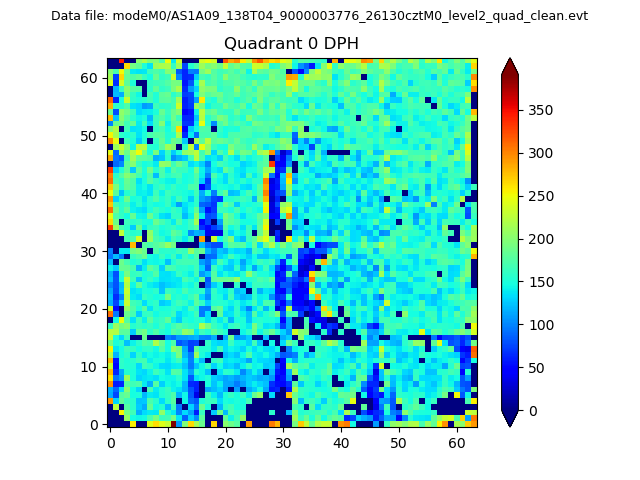 |
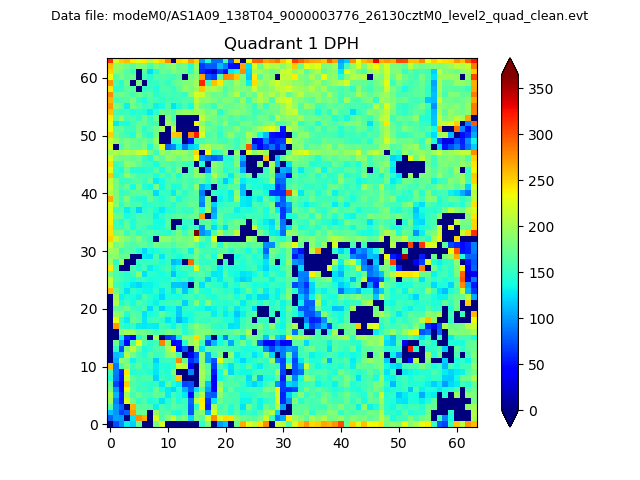 |
Quadrant B |
|---|---|---|---|
| Quadrant D | 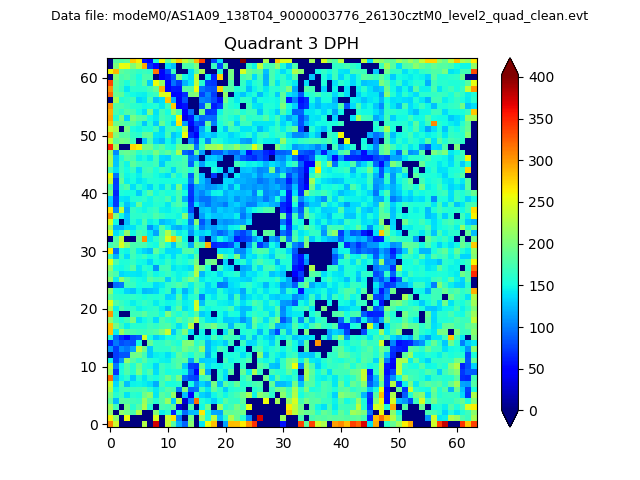 |
 |
Quadrant C |
| Plot type | Count rate plots | Images |
|---|---|---|
| Comparison with Poisson distribution Blue bars denote a histogram of data divided into 1 sec bins. Red curve is a Poisson curve with rate = median count rate of data. |
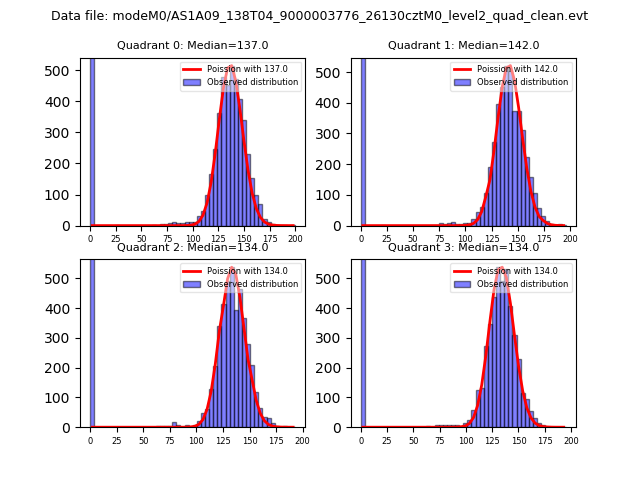 |
 |
| Quadrant-wise count rates Data is divided into 100 sec bins |
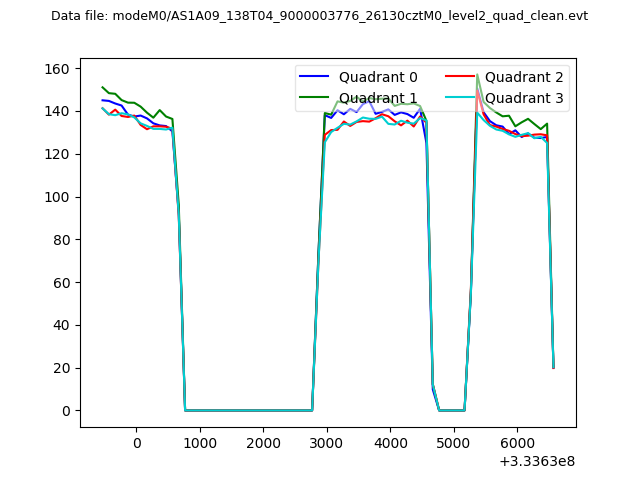 |
|
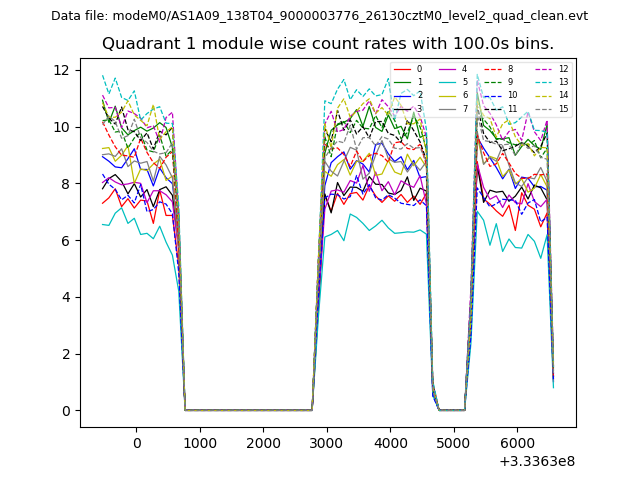
| Module-wise count rates for Quadrant A Data is divided into 100 sec bins |
 |
 |
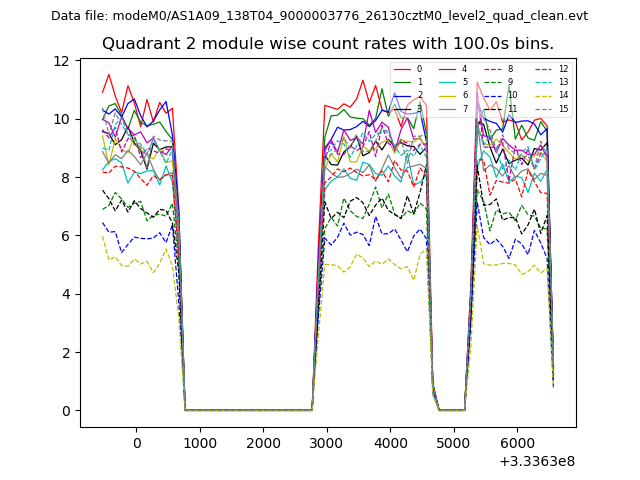
| Module-wise count rates for Quadrant B Data is divided into 100 sec bins |
 |
 |
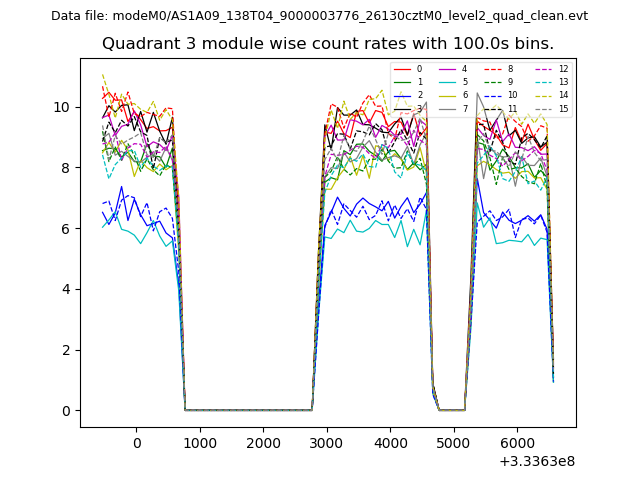
| Module-wise count rates for Quadrant C Data is divided into 100 sec bins |
 |
 |
| Module-wise count rates for Quadrant D Data is divided into 100 sec bins |
 |
 |
| Parameter | Plot |
|---|---|
| CZT HV Monitor | 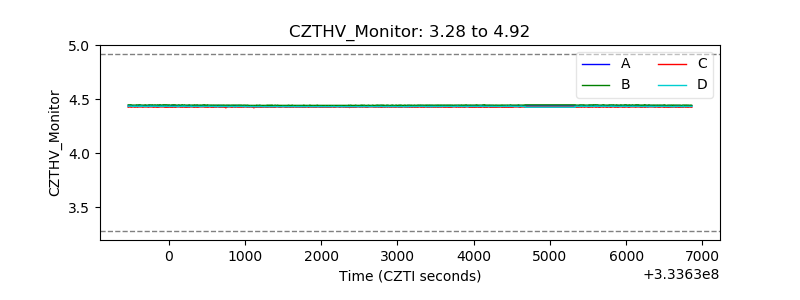 |
| D_VDD | 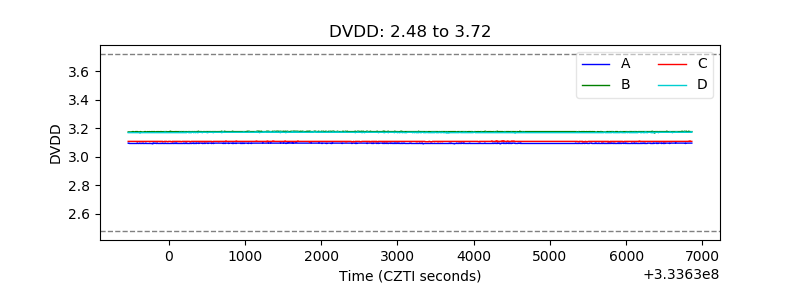 |
| Temperature 1 | 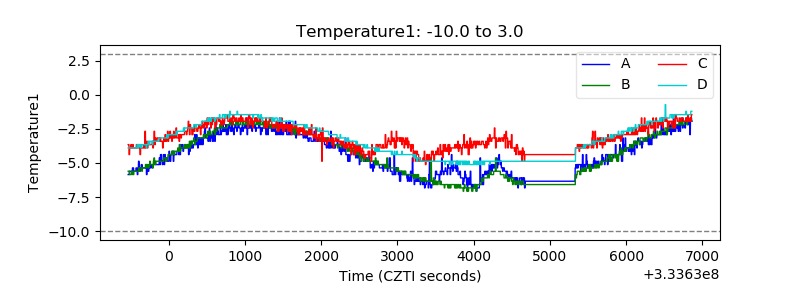 |
| Veto HV Monitor |  |
| Veto LLD | 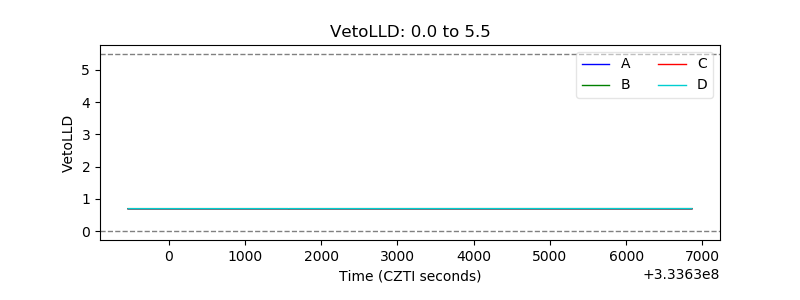 |
| Alpha Counter | 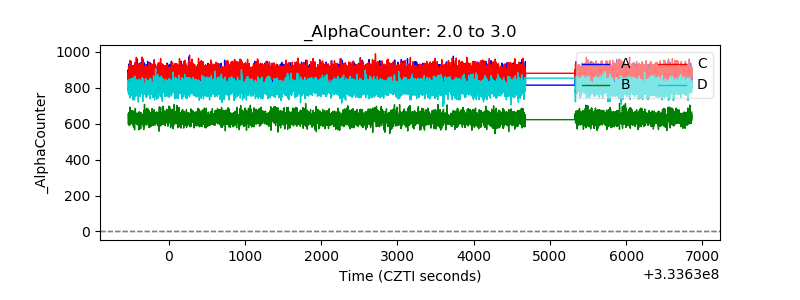 |
| _CPM_Rate | 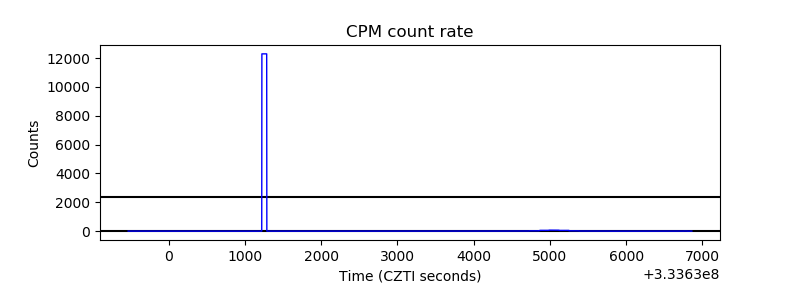 |
| CZT Counter | 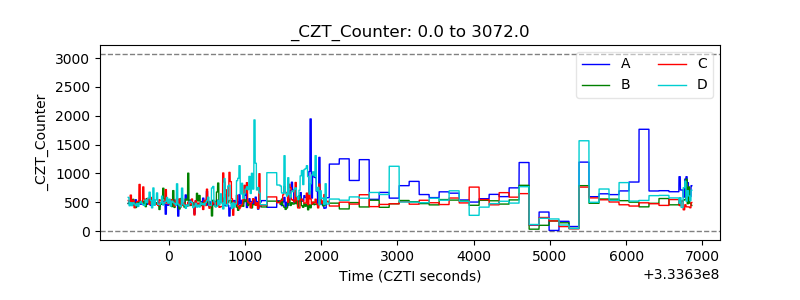 |
| +2.5 Volts monitor |  |
| +5 Volts monitor |  |
| _ROLL_ROT | 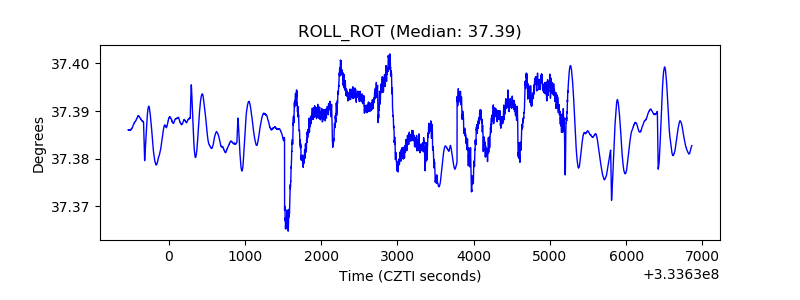 |
| _Roll_DEC | 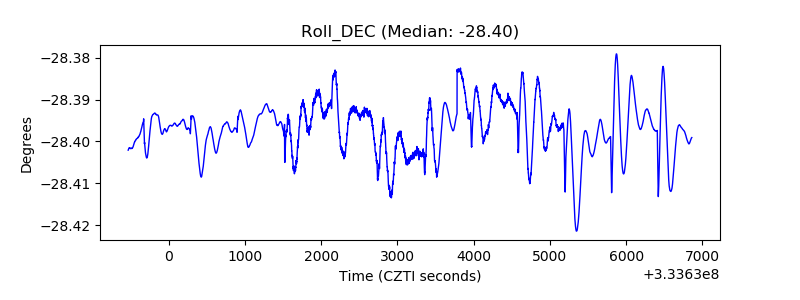 |
| _Roll_RA | 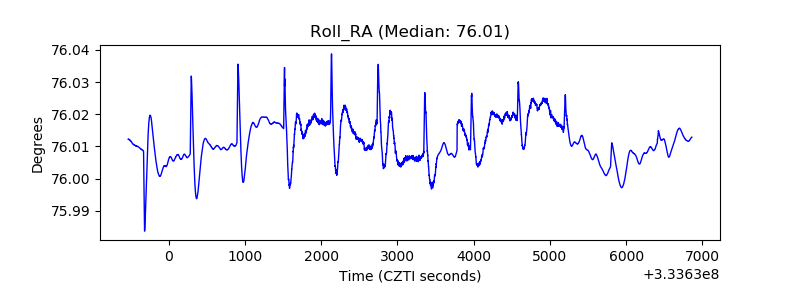 |
| Veto Counter | 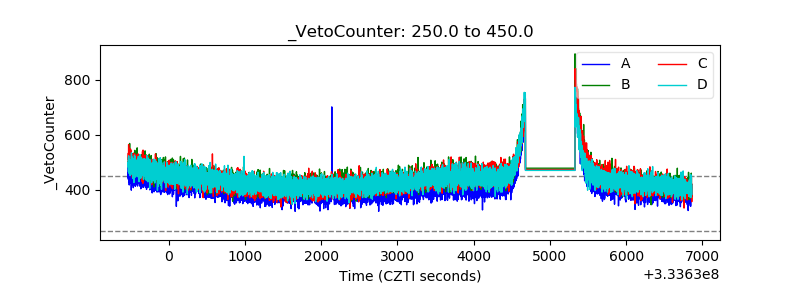 |