| Param | Original file | Final file |
|---|---|---|
| Filename | modeM0/AS1A09_138T04_9000003776_26131cztM0_level2.evt | modeM0/AS1A09_138T04_9000003776_26131cztM0_level2_quad_clean.evt |
| Size (bytes) | 633,199,680 | 86,339,520 |
| Size | 603.9 MB | 82.3 MB |
| Events in quadrant A | 6,438,820 | 527,929 |
| Events in quadrant B | 3,653,102 | 551,347 |
| Events in quadrant C | 4,156,768 | 519,565 |
| Events in quadrant D | 4,452,534 | 526,319 |
| Mode M9 | |||
|---|---|---|---|
| Quadrant | BADHDUFLAG | Total packets | Discarded packets |
| A | 0 | 1 | 0 |
| B | 0 | 1 | 0 |
| C | 0 | 1 | 0 |
| D | 0 | 1 | 0 |
| Mode M0 | |||
|---|---|---|---|
| Quadrant | BADHDUFLAG | Total packets | Discarded packets |
| A | 0 | 24099 | 0 |
| B | 0 | 15154 | 0 |
| C | 0 | 16756 | 0 |
| D | 0 | 17721 | 0 |
| Quadrant | Total seconds | Saturated seconds | Saturation percentage |
|---|---|---|---|
| A | 7013 | 659 | 9.396834% |
| B | 7014 | 298 | 4.248646% |
| C | 7014 | 423 | 6.030796% |
| D | 7013 | 408 | 5.817767% |
Noise dominated data is calculated using 1-second bins in cleaned event files. If a bin has >2000 counts, and if more than 50% of those come from <1% of pixels, then it is considered to be noise-dominated and hence unusable.
| Quadrant | # 1 sec bins | Bins with >0 counts | Bins with >2000 counts | High rate bins dominated by noise | Noise dominated (total time) | Noise dominated (detector-on time) | Marked lightcurve |
|---|---|---|---|---|---|---|---|
| A | 7148 | 7013 | 302 | 302 | 4.22% | 4.31% | 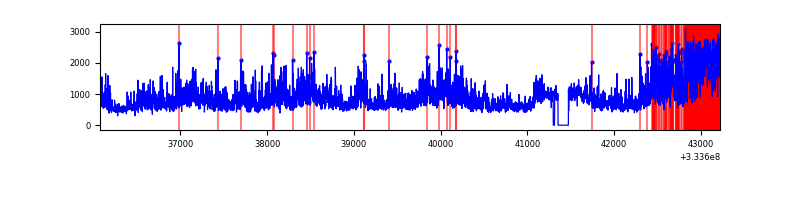 |
| B | 7149 | 7014 | 2 | 2 | 0.03% | 0.03% | 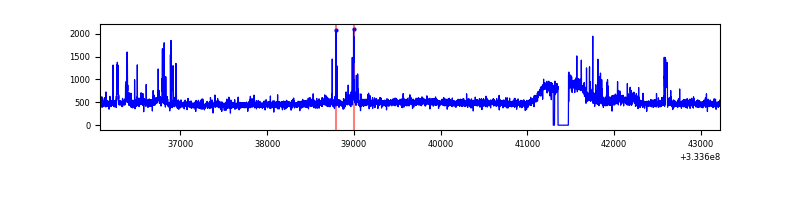 |
| C | 7149 | 7014 | 105 | 105 | 1.47% | 1.50% | 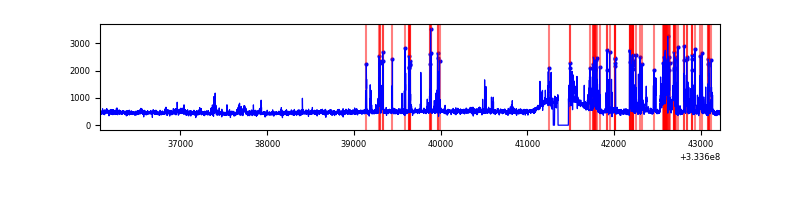 |
| D | 7148 | 7013 | 186 | 186 | 2.60% | 2.65% | 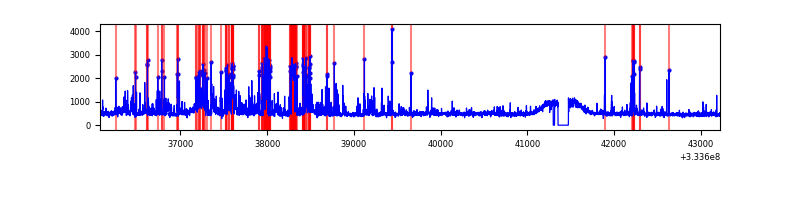 |
Top three noisy pixels from each quadrant. If the there are fewer than three noisy pixels in the level2.evt file, extra rows are filled as -1
| Pixel properties | Quadrant properties | ||||||
|---|---|---|---|---|---|---|---|
| Quadrant | DetID | PixID | Counts | Sigma | Mean | Median | Sigma |
| A | 0 | 13 | 3087368 | 17750.48 | 868 | 849 | 173.9 |
| A | 13 | 254 | 11176 | 59.39 | 868 | 849 | 173.9 |
| A | 3 | 137 | 8292 | 42.8 | 868 | 849 | 173.9 |
| B | 0 | 229 | 172753 | 1002.3 | 875 | 849 | 171.5 |
| B | 0 | 190 | 46065 | 263.64 | 875 | 849 | 171.5 |
| B | 12 | 111 | 20818 | 116.43 | 875 | 849 | 171.5 |
| C | 2 | 16 | 698221 | 3524.41 | 838 | 843 | 197.9 |
| C | 14 | 238 | 132593 | 665.84 | 838 | 843 | 197.9 |
| C | 3 | 233 | 54386 | 270.6 | 838 | 843 | 197.9 |
| D | 1 | 52 | 1078719 | 5220.22 | 858 | 836 | 206.5 |
| D | 12 | 233 | 101598 | 487.99 | 858 | 836 | 206.5 |
| D | 2 | 234 | 29755 | 140.06 | 858 | 836 | 206.5 |
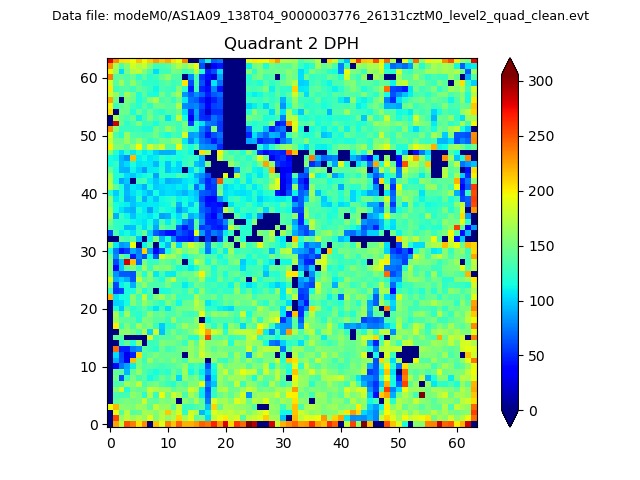
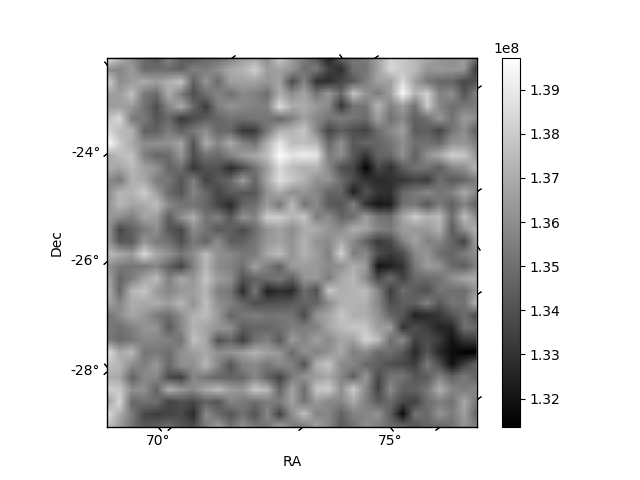
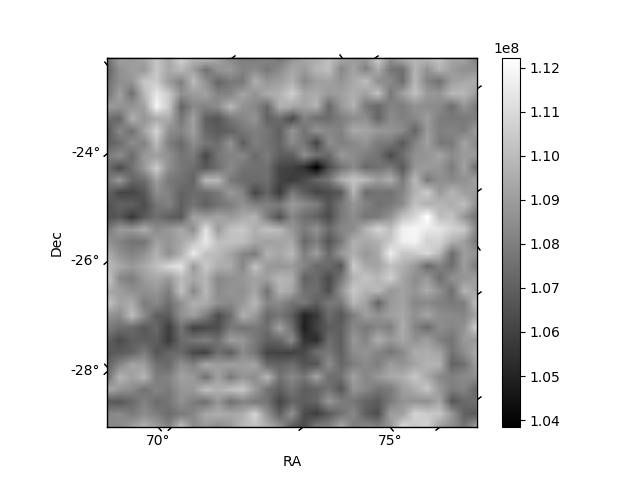
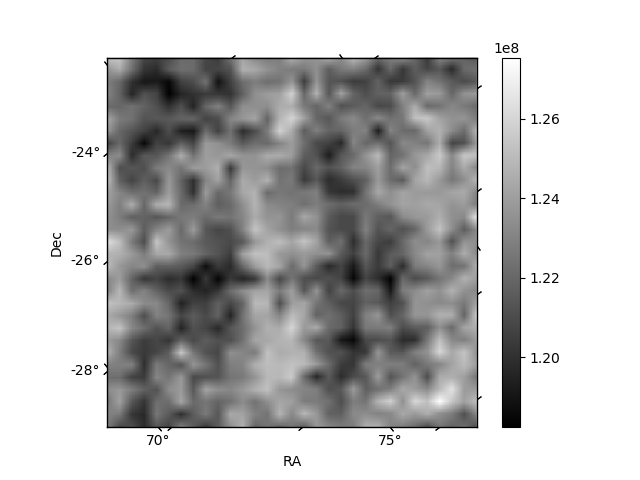
Histogram calculated using DETX and DETY for each event in the final _common_clean file
| Quadrant A | 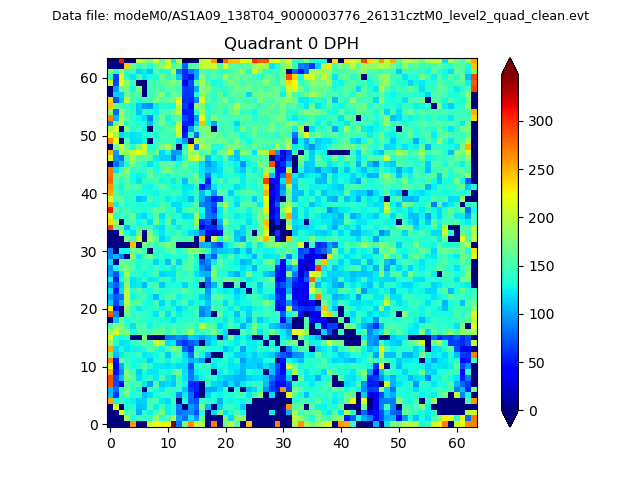 |
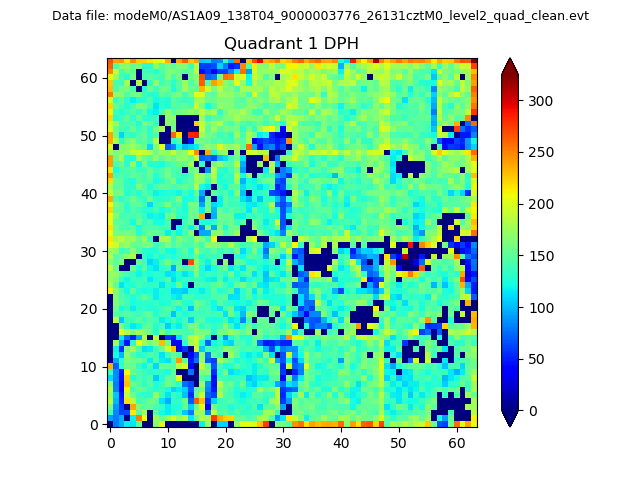 |
Quadrant B |
|---|---|---|---|
| Quadrant D | 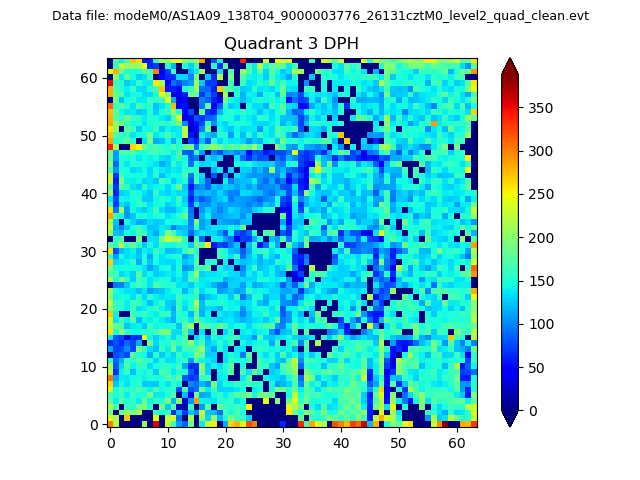 |
 |
Quadrant C |
| Plot type | Count rate plots | Images |
|---|---|---|
| Comparison with Poisson distribution Blue bars denote a histogram of data divided into 1 sec bins. Red curve is a Poisson curve with rate = median count rate of data. |
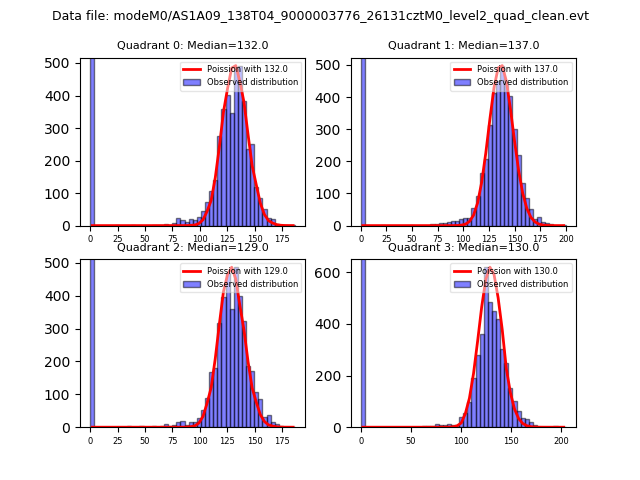 |
 |
| Quadrant-wise count rates Data is divided into 100 sec bins |
 |
|
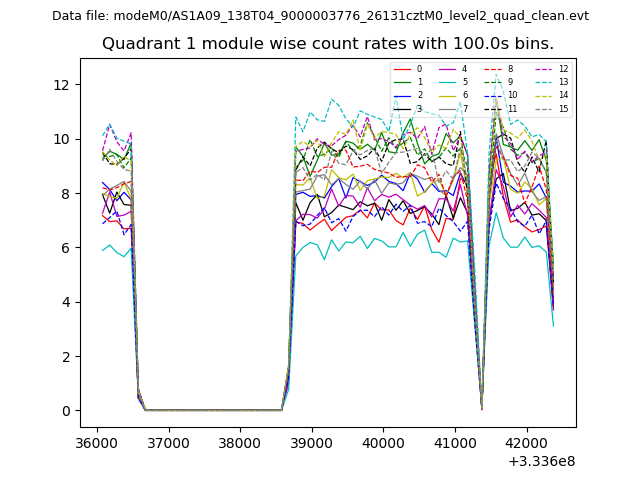
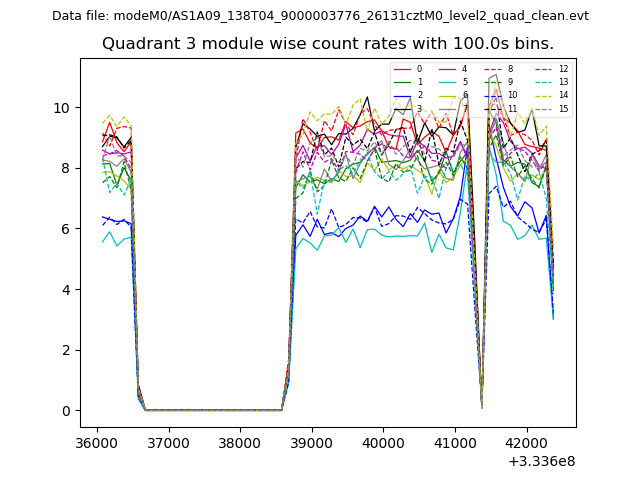
| Module-wise count rates for Quadrant A Data is divided into 100 sec bins |
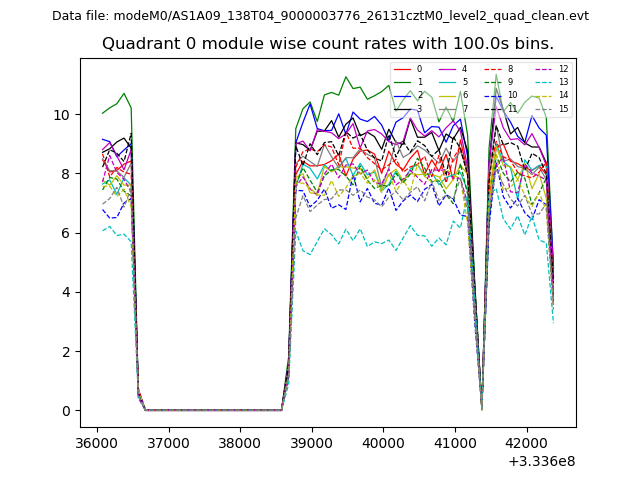 |
 |
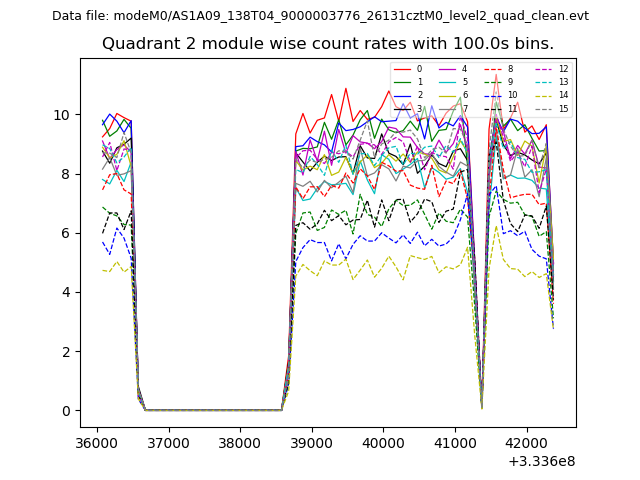
| Module-wise count rates for Quadrant B Data is divided into 100 sec bins |
 |
 |
| Module-wise count rates for Quadrant C Data is divided into 100 sec bins |
 |
 |
| Module-wise count rates for Quadrant D Data is divided into 100 sec bins |
 |
 |
| Parameter | Plot |
|---|---|
| CZT HV Monitor | 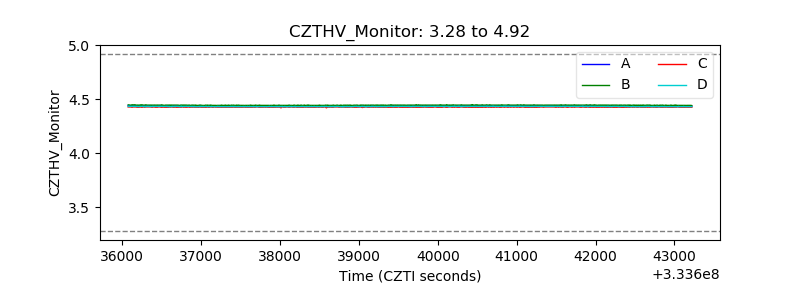 |
| D_VDD | 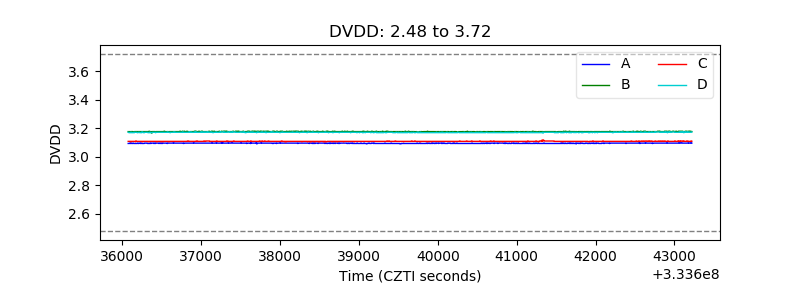 |
| Temperature 1 | 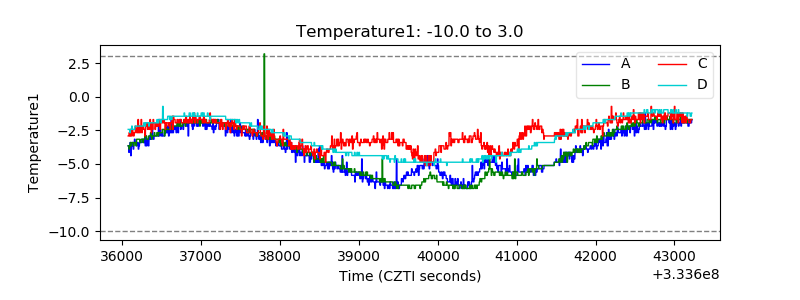 |
| Veto HV Monitor | 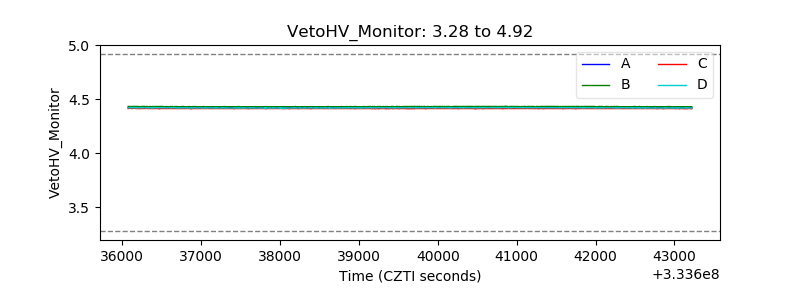 |
| Veto LLD | 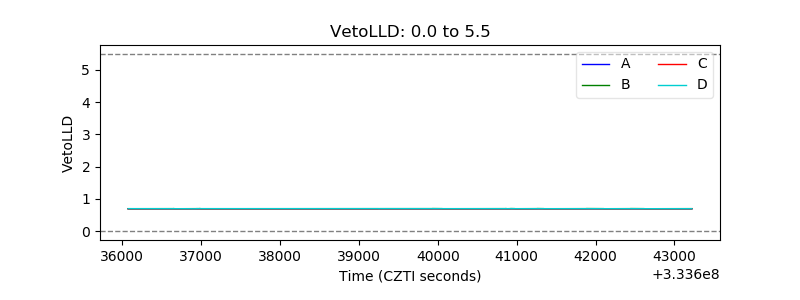 |
| Alpha Counter |  |
| _CPM_Rate | 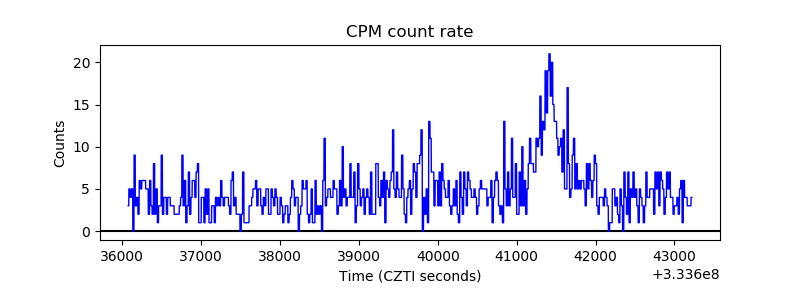 |
| CZT Counter | 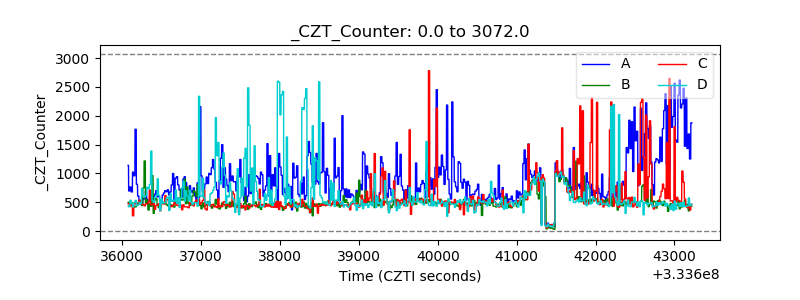 |
| +2.5 Volts monitor |  |
| +5 Volts monitor |  |
| _ROLL_ROT | 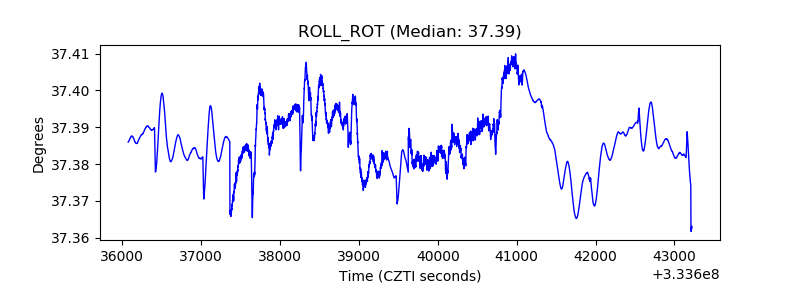 |
| _Roll_DEC | 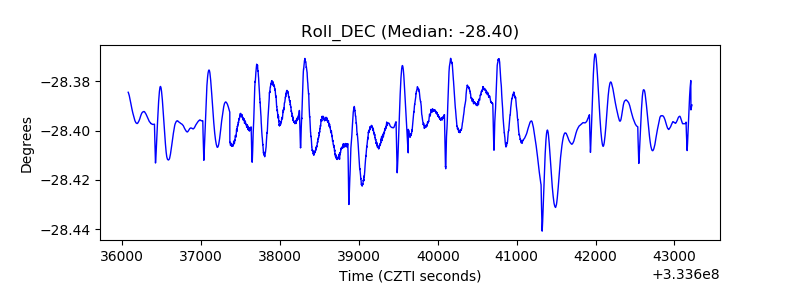 |
| _Roll_RA | 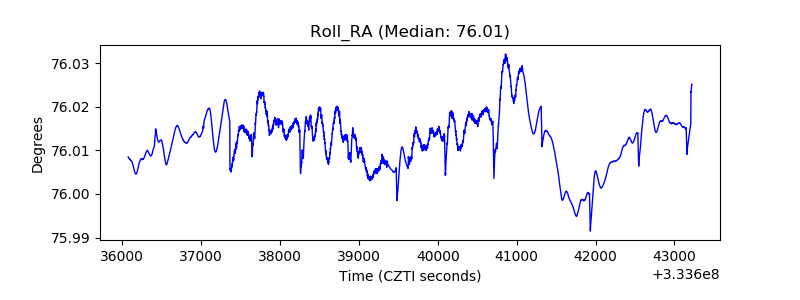 |
| Veto Counter | 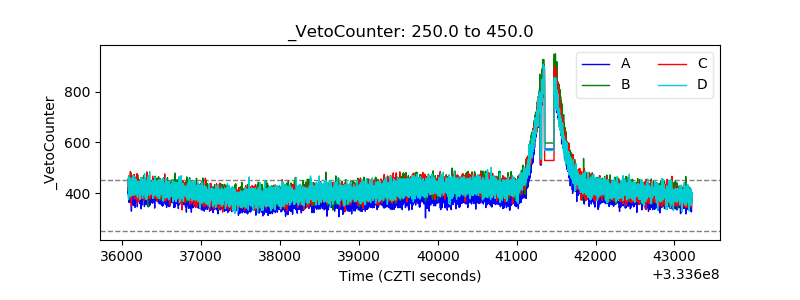 |