| Param | Original file | Final file |
|---|---|---|
| Filename | modeM0/AS1A09_138T04_9000003776_26132cztM0_level2.evt | modeM0/AS1A09_138T04_9000003776_26132cztM0_level2_quad_clean.evt |
| Size (bytes) | 736,689,600 | 88,450,560 |
| Size | 702.6 MB | 84.4 MB |
| Events in quadrant A | 8,497,574 | 532,046 |
| Events in quadrant B | 3,766,632 | 565,080 |
| Events in quadrant C | 4,567,593 | 535,689 |
| Events in quadrant D | 4,973,557 | 524,841 |
| Mode M9 | |||
|---|---|---|---|
| Quadrant | BADHDUFLAG | Total packets | Discarded packets |
| A | 0 | 2 | 0 |
| B | 0 | 2 | 0 |
| C | 0 | 2 | 0 |
| D | 0 | 2 | 0 |
| Mode M0 | |||
|---|---|---|---|
| Quadrant | BADHDUFLAG | Total packets | Discarded packets |
| A | 0 | 30557 | 0 |
| B | 0 | 15815 | 0 |
| C | 0 | 18299 | 0 |
| D | 0 | 19635 | 0 |
| Quadrant | Total seconds | Saturated seconds | Saturation percentage |
|---|---|---|---|
| A | 7477 | 1047 | 14.002942% |
| B | 7477 | 196 | 2.621372% |
| C | 7476 | 384 | 5.136437% |
| D | 7476 | 331 | 4.427501% |
Noise dominated data is calculated using 1-second bins in cleaned event files. If a bin has >2000 counts, and if more than 50% of those come from <1% of pixels, then it is considered to be noise-dominated and hence unusable.
| Quadrant | # 1 sec bins | Bins with >0 counts | Bins with >2000 counts | High rate bins dominated by noise | Noise dominated (total time) | Noise dominated (detector-on time) | Marked lightcurve |
|---|---|---|---|---|---|---|---|
| A | 7652 | 7477 | 717 | 717 | 9.37% | 9.59% | 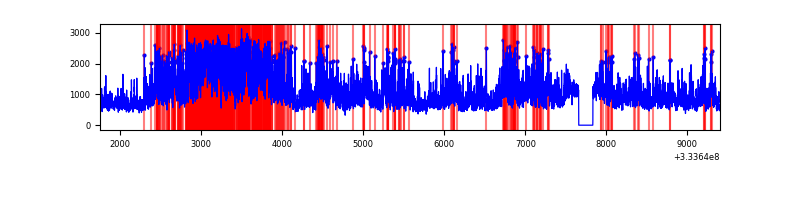 |
| B | 7652 | 7477 | 2 | 2 | 0.03% | 0.03% | 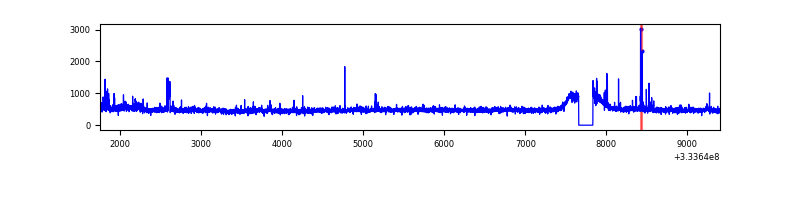 |
| C | 7651 | 7476 | 178 | 178 | 2.33% | 2.38% | 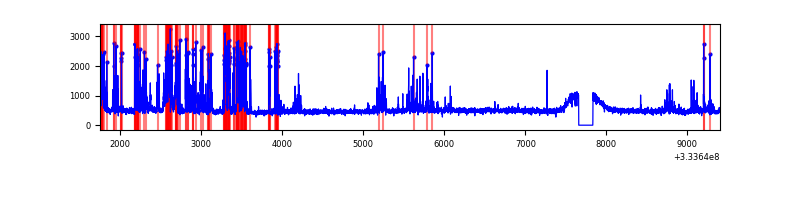 |
| D | 7651 | 7476 | 162 | 162 | 2.12% | 2.17% | 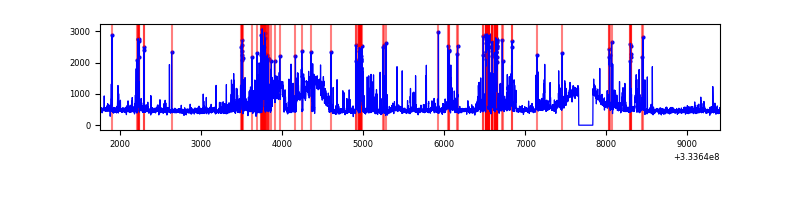 |
Top three noisy pixels from each quadrant. If the there are fewer than three noisy pixels in the level2.evt file, extra rows are filled as -1
| Pixel properties | Quadrant properties | ||||||
|---|---|---|---|---|---|---|---|
| Quadrant | DetID | PixID | Counts | Sigma | Mean | Median | Sigma |
| A | 0 | 13 | 5017345 | 27386.91 | 902 | 882 | 183.2 |
| A | 13 | 254 | 10766 | 53.96 | 902 | 882 | 183.2 |
| A | 3 | 137 | 8269 | 40.33 | 902 | 882 | 183.2 |
| B | 0 | 229 | 105095 | 579.41 | 919 | 892 | 179.8 |
| B | 0 | 190 | 38878 | 211.22 | 919 | 892 | 179.8 |
| B | 12 | 111 | 22048 | 117.63 | 919 | 892 | 179.8 |
| C | 2 | 16 | 975239 | 4675.61 | 882 | 889 | 208.4 |
| C | 14 | 238 | 139471 | 665.01 | 882 | 889 | 208.4 |
| C | 3 | 233 | 9635 | 41.97 | 882 | 889 | 208.4 |
| D | 1 | 52 | 1510541 | 7040.62 | 896 | 874 | 214.4 |
| D | 2 | 234 | 33041 | 150.02 | 896 | 874 | 214.4 |
| D | 12 | 233 | 32355 | 146.82 | 896 | 874 | 214.4 |
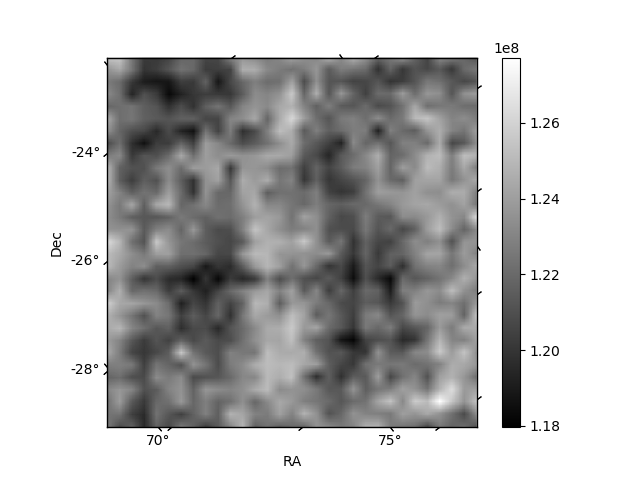
Histogram calculated using DETX and DETY for each event in the final _common_clean file
| Quadrant A | 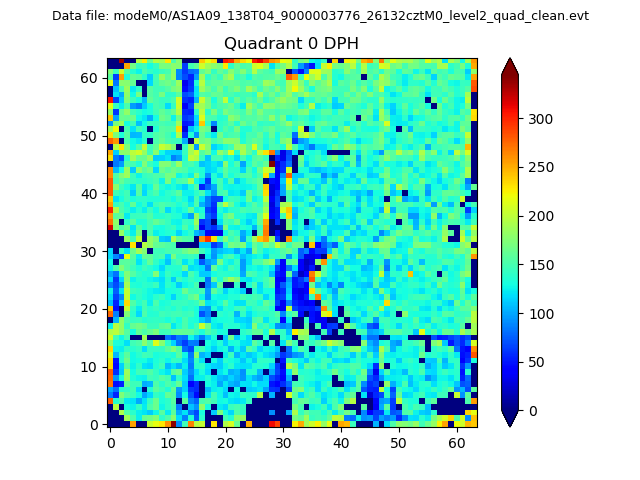 |
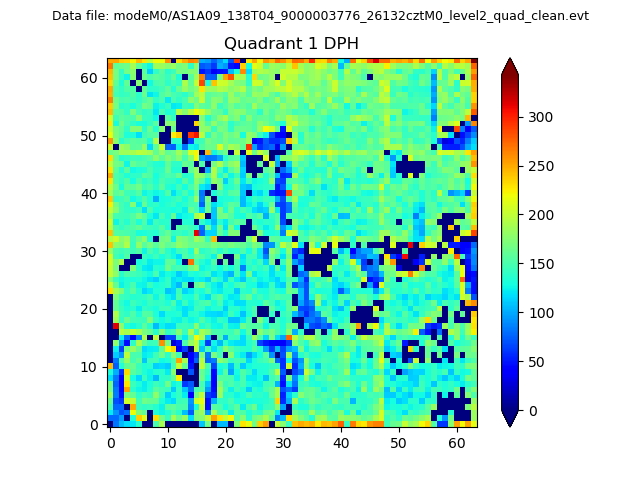 |
Quadrant B |
|---|---|---|---|
| Quadrant D |  |
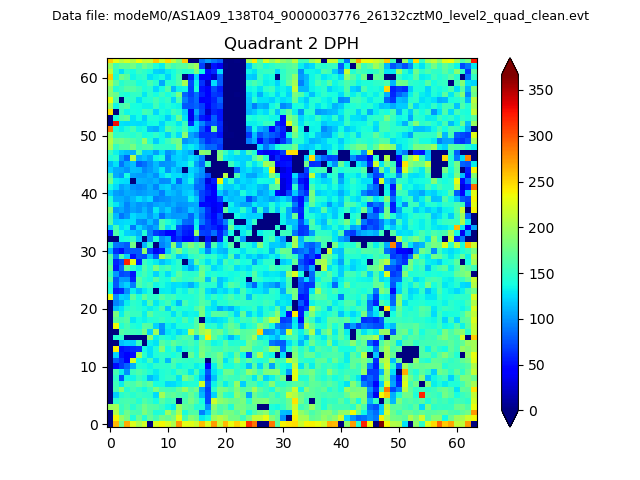 |
Quadrant C |
| Plot type | Count rate plots | Images |
|---|---|---|
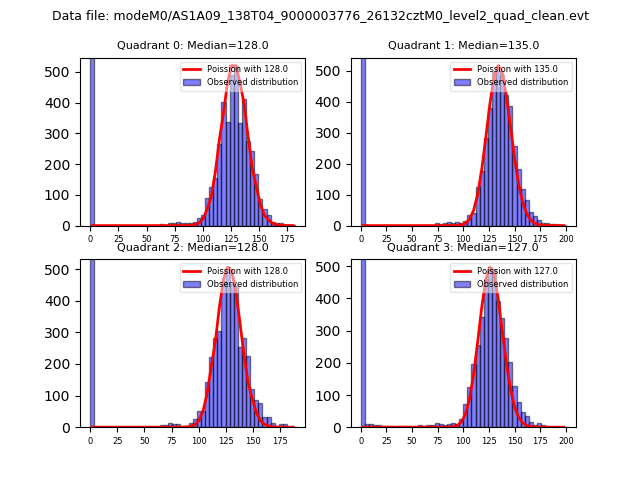
| Comparison with Poisson distribution Blue bars denote a histogram of data divided into 1 sec bins. Red curve is a Poisson curve with rate = median count rate of data. |
 |
 |
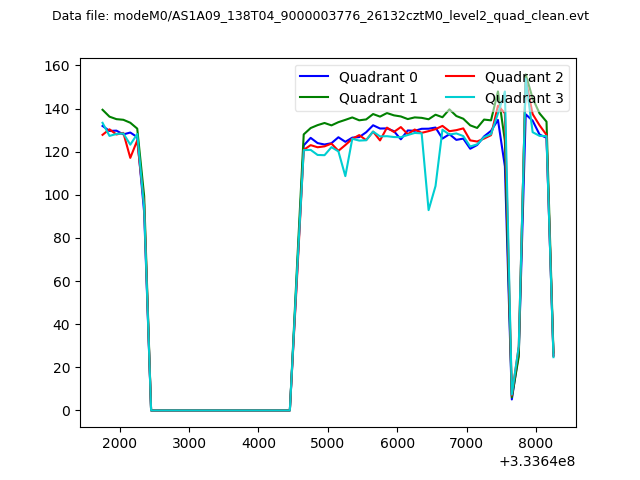
| Quadrant-wise count rates Data is divided into 100 sec bins |
 |
|
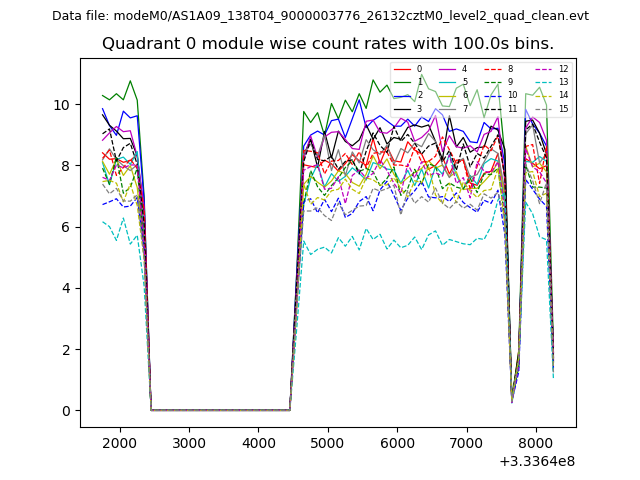
| Module-wise count rates for Quadrant A Data is divided into 100 sec bins |
 |
 |
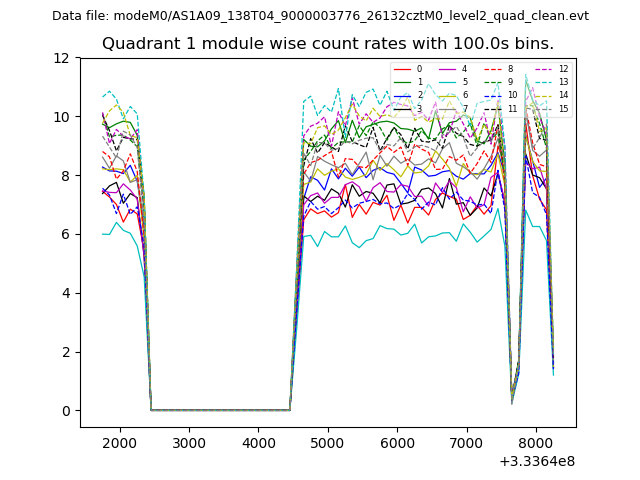
| Module-wise count rates for Quadrant B Data is divided into 100 sec bins |
 |
 |
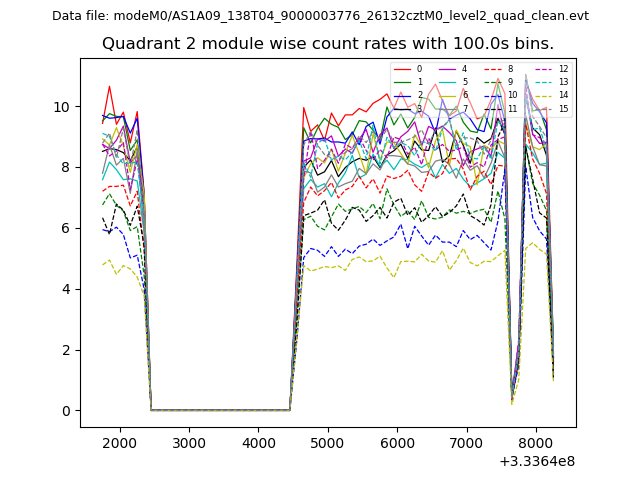
| Module-wise count rates for Quadrant C Data is divided into 100 sec bins |
 |
 |
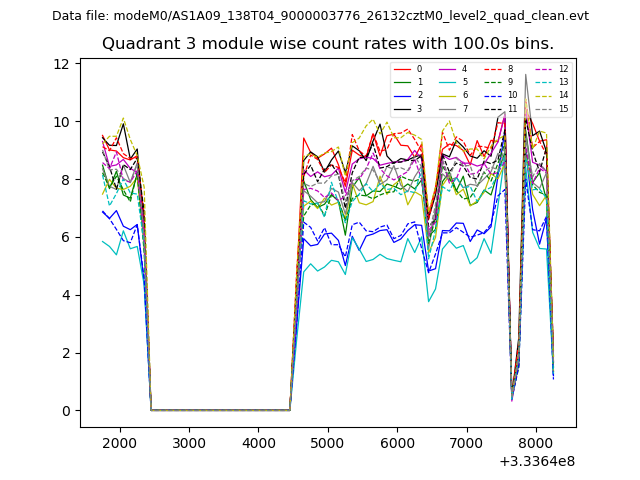
| Module-wise count rates for Quadrant D Data is divided into 100 sec bins |
 |
 |
| Parameter | Plot |
|---|---|
| CZT HV Monitor | 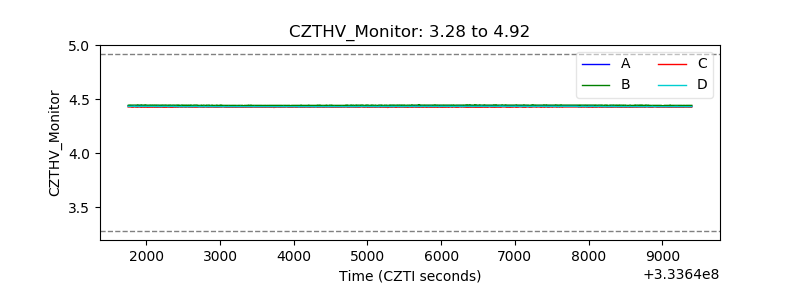 |
| D_VDD | 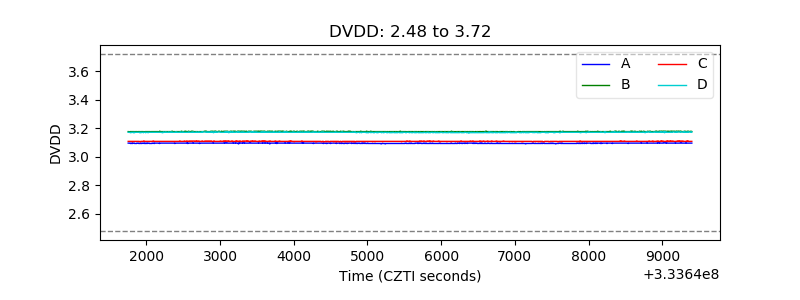 |
| Temperature 1 | 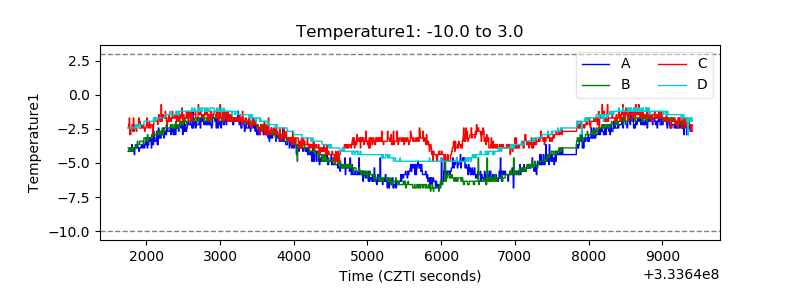 |
| Veto HV Monitor | 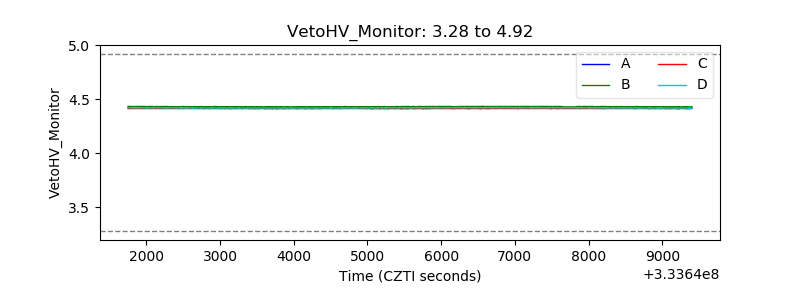 |
| Veto LLD | 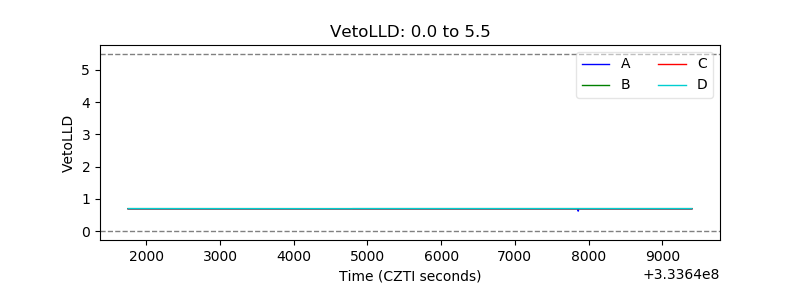 |
| Alpha Counter | 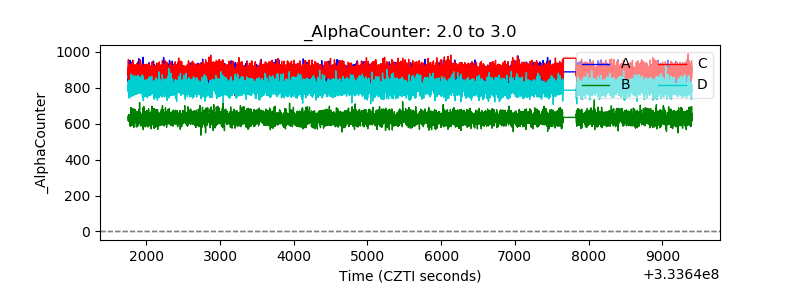 |
| _CPM_Rate |  |
| CZT Counter | 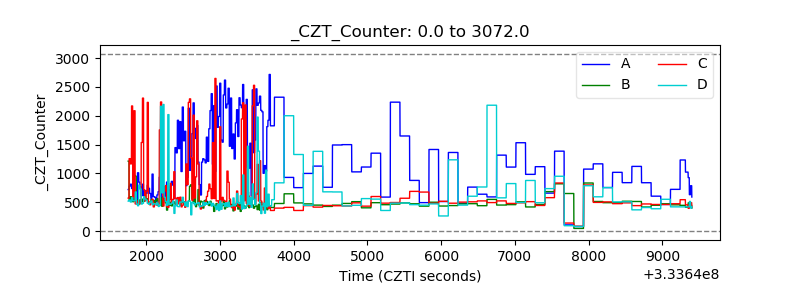 |
| +2.5 Volts monitor | 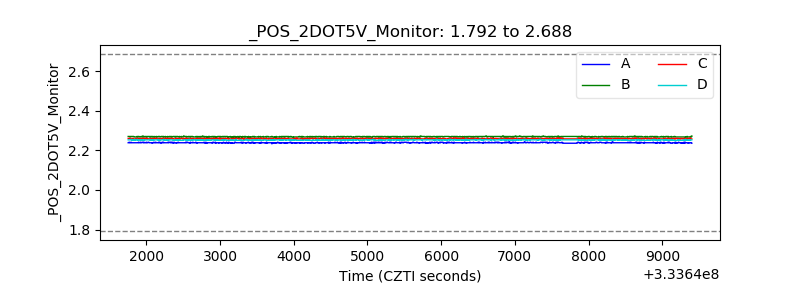 |
| +5 Volts monitor |  |
| _ROLL_ROT | 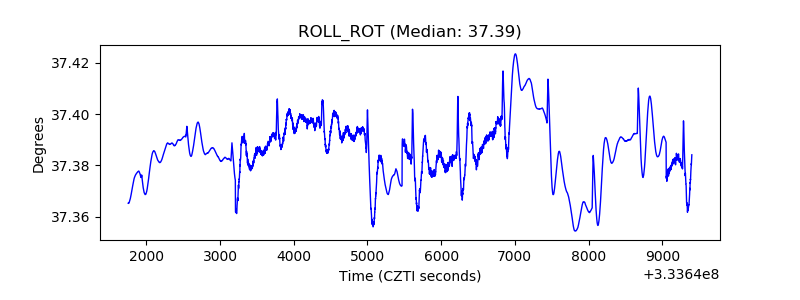 |
| _Roll_DEC | 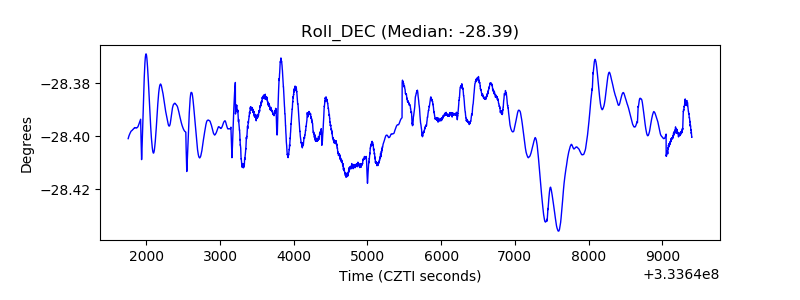 |
| _Roll_RA | 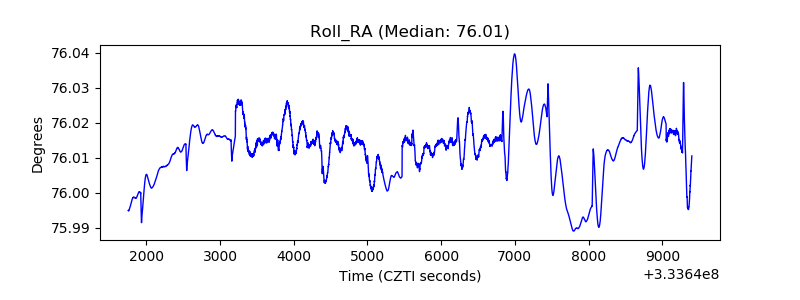 |
| Veto Counter | 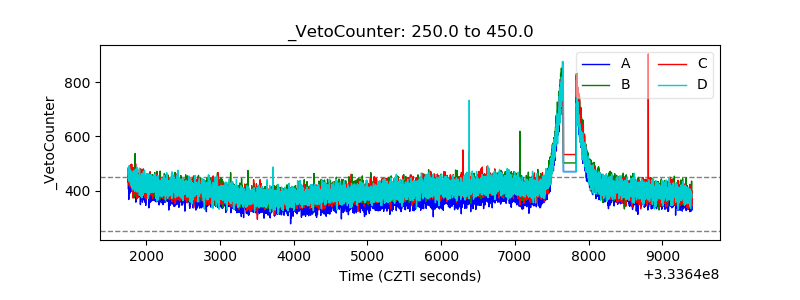 |