| Param | Original file | Final file |
|---|---|---|
| Filename | modeM0/AS1A09_138T04_9000003776_26133cztM0_level2.evt | modeM0/AS1A09_138T04_9000003776_26133cztM0_level2_quad_clean.evt |
| Size (bytes) | 611,697,600 | 81,783,360 |
| Size | 583.4 MB | 78.0 MB |
| Events in quadrant A | 5,962,359 | 486,332 |
| Events in quadrant B | 3,845,262 | 504,903 |
| Events in quadrant C | 3,945,082 | 479,182 |
| Events in quadrant D | 4,257,560 | 477,019 |
| Mode M9 | |||
|---|---|---|---|
| Quadrant | BADHDUFLAG | Total packets | Discarded packets |
| A | 0 | 4 | 0 |
| B | 0 | 4 | 0 |
| C | 0 | 4 | 0 |
| D | 0 | 4 | 0 |
| Mode M0 | |||
|---|---|---|---|
| Quadrant | BADHDUFLAG | Total packets | Discarded packets |
| A | 0 | 22989 | 0 |
| B | 0 | 16177 | 0 |
| C | 0 | 16488 | 0 |
| D | 0 | 17595 | 0 |
| Quadrant | Total seconds | Saturated seconds | Saturation percentage |
|---|---|---|---|
| A | 7603 | 253 | 3.327634% |
| B | 7603 | 150 | 1.972905% |
| C | 7603 | 175 | 2.301723% |
| D | 7603 | 161 | 2.117585% |
Noise dominated data is calculated using 1-second bins in cleaned event files. If a bin has >2000 counts, and if more than 50% of those come from <1% of pixels, then it is considered to be noise-dominated and hence unusable.
| Quadrant | # 1 sec bins | Bins with >0 counts | Bins with >2000 counts | High rate bins dominated by noise | Noise dominated (total time) | Noise dominated (detector-on time) | Marked lightcurve |
|---|---|---|---|---|---|---|---|
| A | 8018 | 7603 | 62 | 62 | 0.77% | 0.82% | 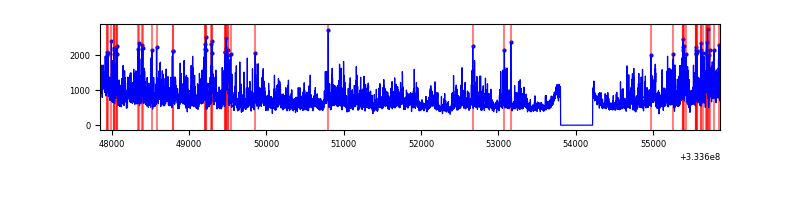 |
| B | 8018 | 7603 | 16 | 16 | 0.20% | 0.21% | 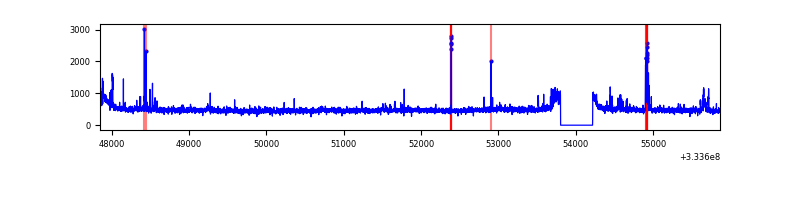 |
| C | 8018 | 7603 | 44 | 44 | 0.55% | 0.58% | 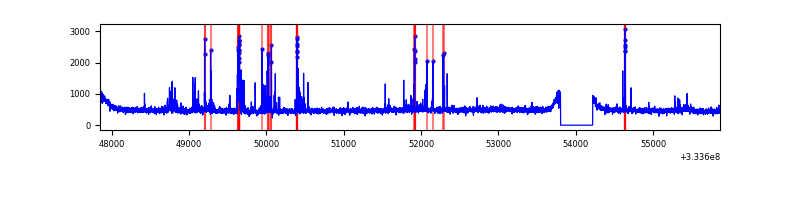 |
| D | 8018 | 7603 | 84 | 84 | 1.05% | 1.10% | 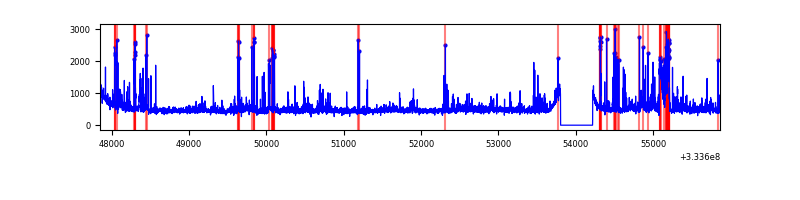 |
Top three noisy pixels from each quadrant. If the there are fewer than three noisy pixels in the level2.evt file, extra rows are filled as -1
| Pixel properties | Quadrant properties | ||||||
|---|---|---|---|---|---|---|---|
| Quadrant | DetID | PixID | Counts | Sigma | Mean | Median | Sigma |
| A | 0 | 13 | 2364154 | 12504.18 | 933 | 912 | 189.0 |
| A | 13 | 254 | 11820 | 57.72 | 933 | 912 | 189.0 |
| A | 3 | 137 | 8731 | 41.37 | 933 | 912 | 189.0 |
| B | 0 | 229 | 137641 | 753.02 | 930 | 904 | 181.6 |
| B | 0 | 190 | 37319 | 200.54 | 930 | 904 | 181.6 |
| B | 12 | 111 | 21992 | 116.13 | 930 | 904 | 181.6 |
| C | 2 | 16 | 304237 | 1445.05 | 892 | 897 | 209.9 |
| C | 14 | 238 | 142268 | 673.46 | 892 | 897 | 209.9 |
| C | 3 | 233 | 23135 | 105.94 | 892 | 897 | 209.9 |
| D | 1 | 52 | 702354 | 3214.12 | 908 | 887 | 218.2 |
| D | 2 | 234 | 34080 | 152.09 | 908 | 887 | 218.2 |
| D | 13 | 168 | 34034 | 151.88 | 908 | 887 | 218.2 |
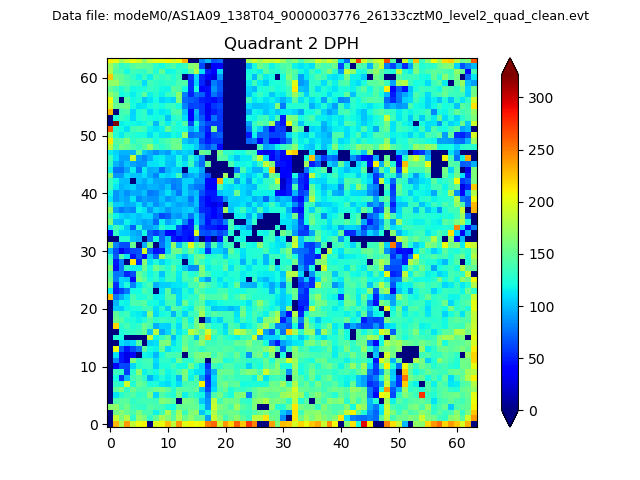
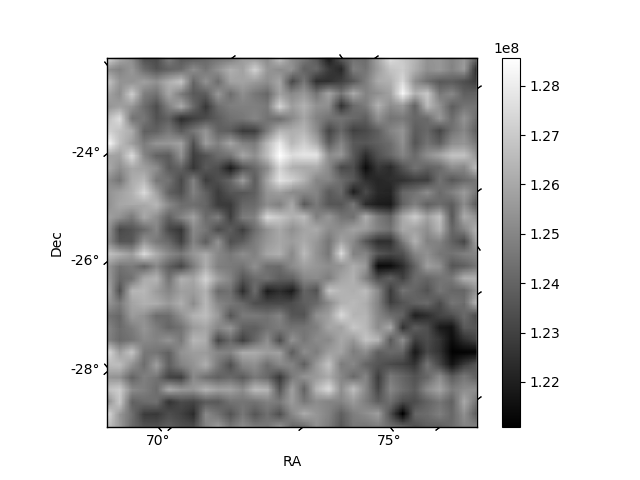
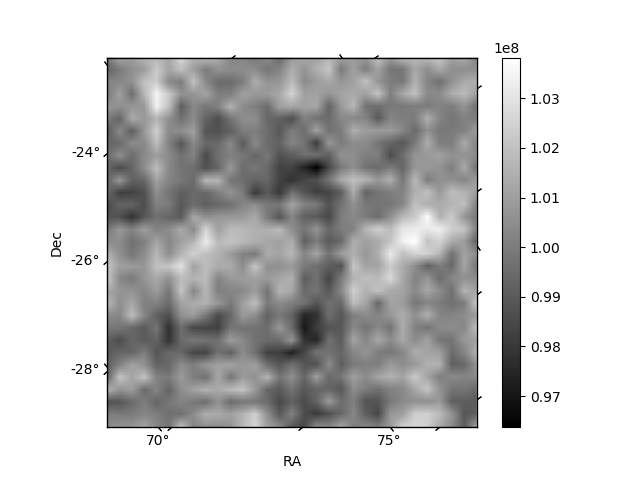
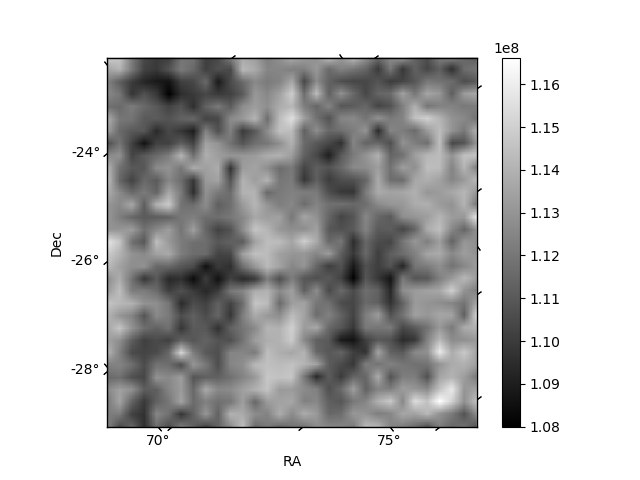
Histogram calculated using DETX and DETY for each event in the final _common_clean file
| Quadrant A | 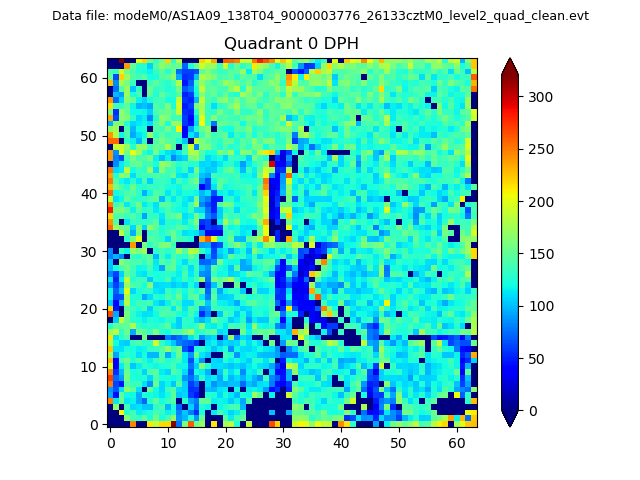 |
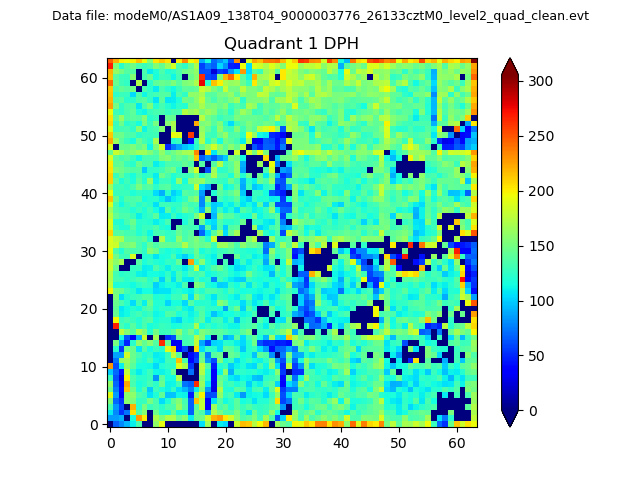 |
Quadrant B |
|---|---|---|---|
| Quadrant D | 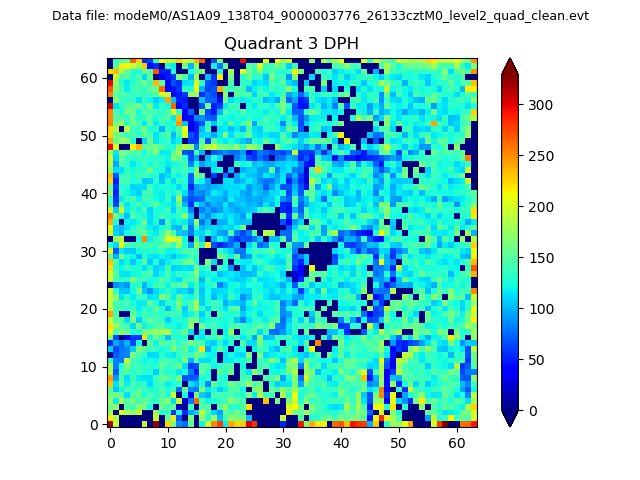 |
 |
Quadrant C |
| Plot type | Count rate plots | Images |
|---|---|---|
| Comparison with Poisson distribution Blue bars denote a histogram of data divided into 1 sec bins. Red curve is a Poisson curve with rate = median count rate of data. |
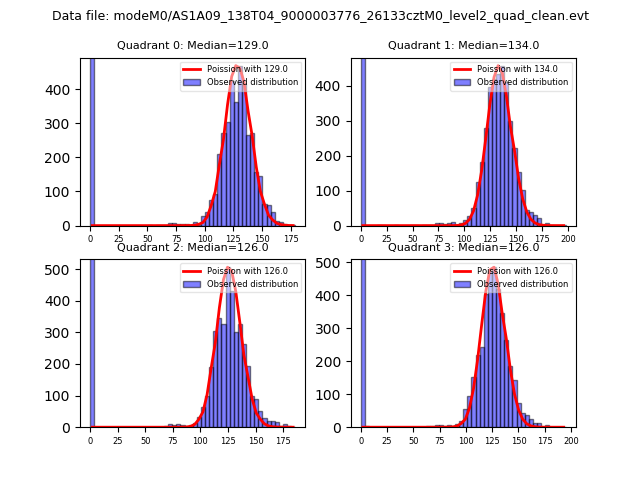 |
 |
| Quadrant-wise count rates Data is divided into 100 sec bins |
 |
|
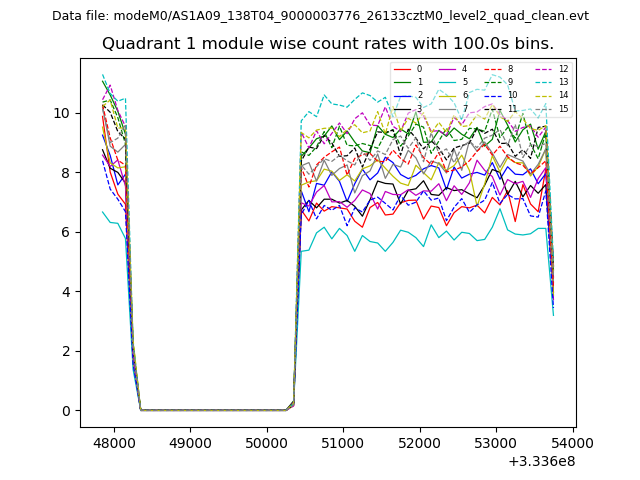
| Module-wise count rates for Quadrant A Data is divided into 100 sec bins |
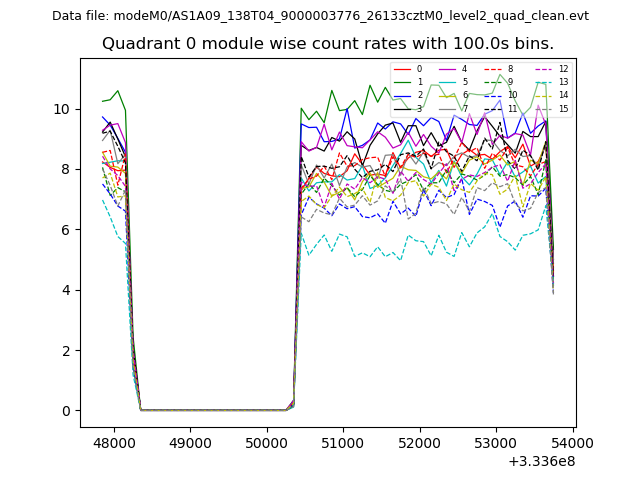 |
 |
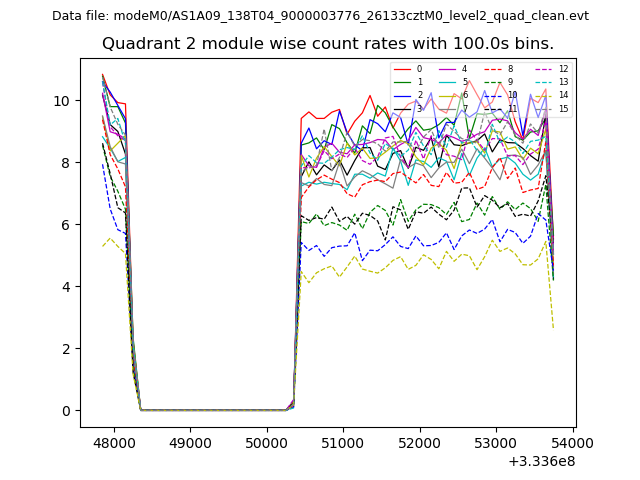
| Module-wise count rates for Quadrant B Data is divided into 100 sec bins |
 |
 |
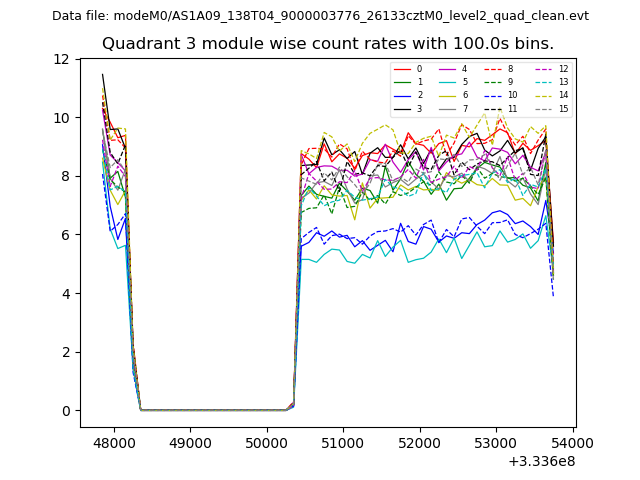
| Module-wise count rates for Quadrant C Data is divided into 100 sec bins |
 |
 |
| Module-wise count rates for Quadrant D Data is divided into 100 sec bins |
 |
 |
| Parameter | Plot |
|---|---|
| CZT HV Monitor | 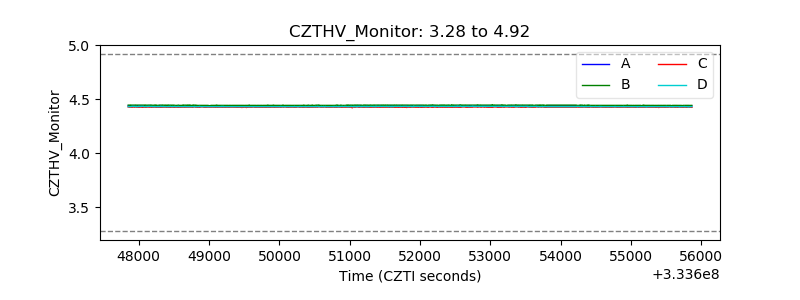 |
| D_VDD | 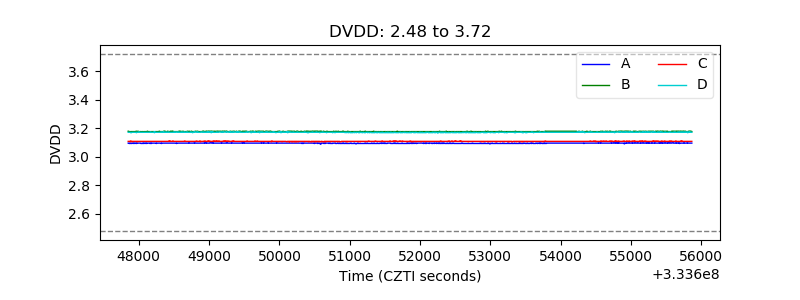 |
| Temperature 1 | 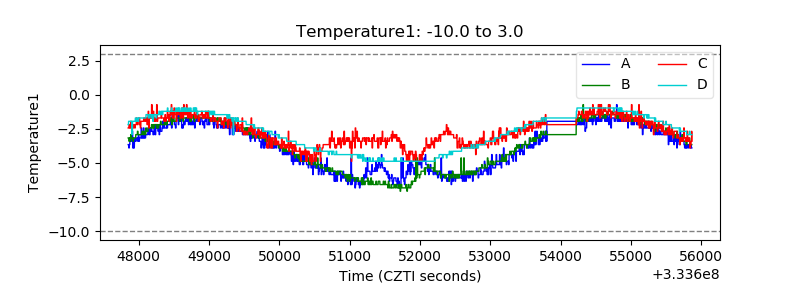 |
| Veto HV Monitor |  |
| Veto LLD |  |
| Alpha Counter |  |
| _CPM_Rate |  |
| CZT Counter | 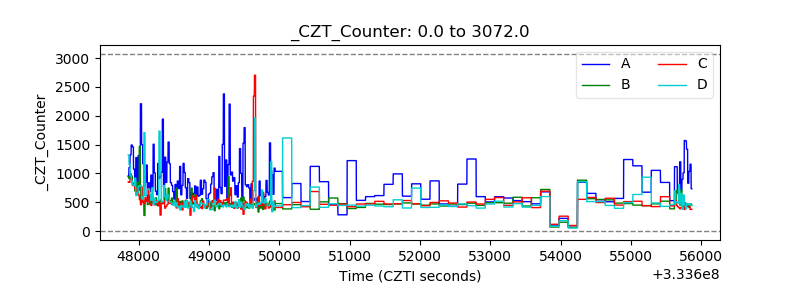 |
| +2.5 Volts monitor |  |
| +5 Volts monitor |  |
| _ROLL_ROT | 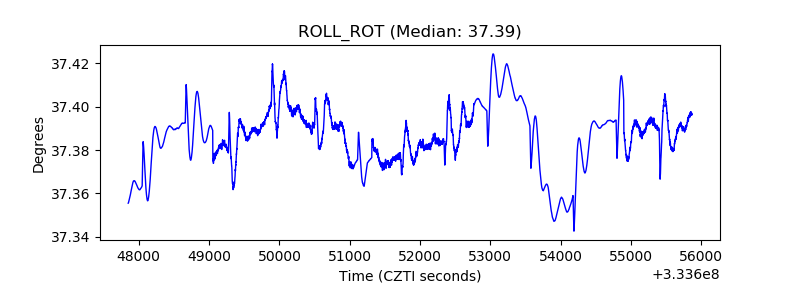 |
| _Roll_DEC | 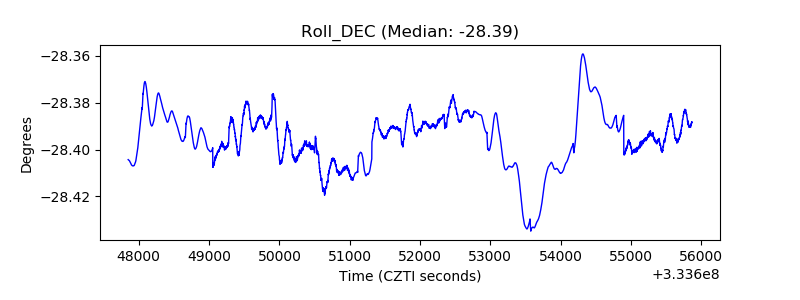 |
| _Roll_RA | 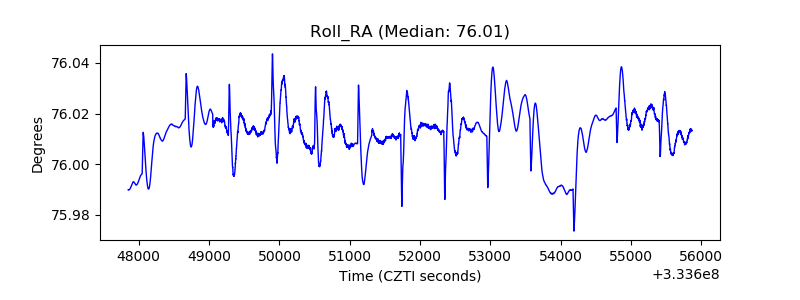 |
| Veto Counter | 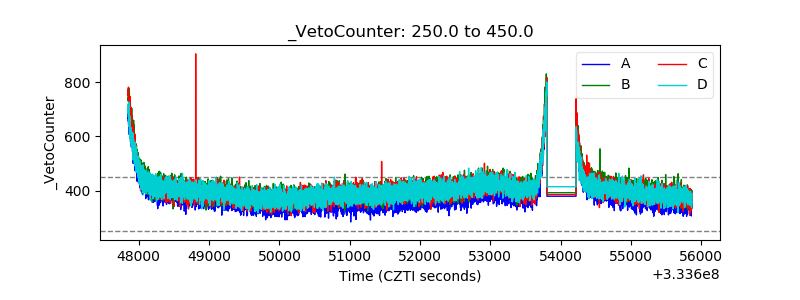 |