| Param | Original file | Final file |
|---|---|---|
| Filename | modeM0/AS1A09_138T04_9000003776_26135cztM0_level2.evt | modeM0/AS1A09_138T04_9000003776_26135cztM0_level2_quad_clean.evt |
| Size (bytes) | 1,041,168,960 | 154,393,920 |
| Size | 992.9 MB | 147.2 MB |
| Events in quadrant A | 8,865,681 | 958,656 |
| Events in quadrant B | 6,229,661 | 995,546 |
| Events in quadrant C | 6,339,230 | 938,271 |
| Events in quadrant D | 9,257,997 | 923,333 |
| Mode M9 | |||
|---|---|---|---|
| Quadrant | BADHDUFLAG | Total packets | Discarded packets |
| A | 0 | 14 | 0 |
| B | 0 | 14 | 0 |
| C | 0 | 14 | 0 |
| D | 0 | 14 | 0 |
| Mode M0 | |||
|---|---|---|---|
| Quadrant | BADHDUFLAG | Total packets | Discarded packets |
| A | 0 | 34646 | 0 |
| B | 0 | 26382 | 0 |
| C | 0 | 26613 | 0 |
| D | 0 | 35794 | 0 |
| Quadrant | Total seconds | Saturated seconds | Saturation percentage |
|---|---|---|---|
| A | 12445 | 367 | 2.948975% |
| B | 12445 | 124 | 0.996384% |
| C | 12445 | 191 | 1.534753% |
| D | 12444 | 226 | 1.816136% |
Noise dominated data is calculated using 1-second bins in cleaned event files. If a bin has >2000 counts, and if more than 50% of those come from <1% of pixels, then it is considered to be noise-dominated and hence unusable.
| Quadrant | # 1 sec bins | Bins with >0 counts | Bins with >2000 counts | High rate bins dominated by noise | Noise dominated (total time) | Noise dominated (detector-on time) | Marked lightcurve |
|---|---|---|---|---|---|---|---|
| A | 13795 | 12445 | 176 | 176 | 1.28% | 1.41% | 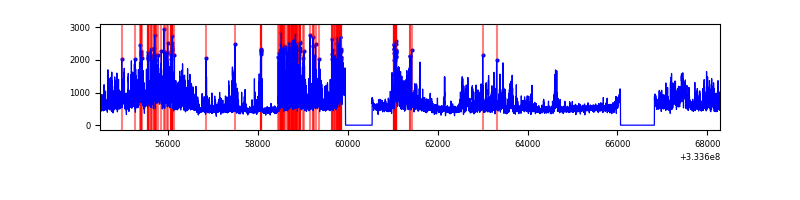 |
| B | 13795 | 12445 | 14 | 14 | 0.10% | 0.11% | 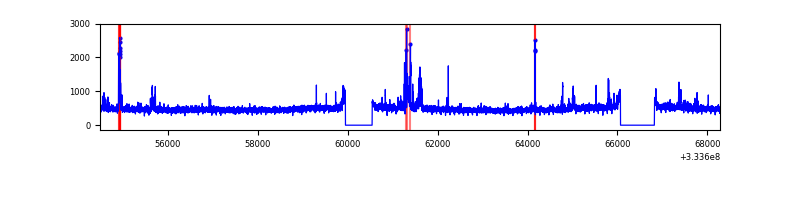 |
| C | 13795 | 12445 | 33 | 33 | 0.24% | 0.27% | 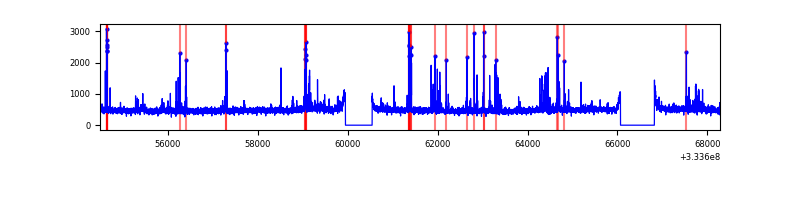 |
| D | 13794 | 12444 | 127 | 127 | 0.92% | 1.02% | 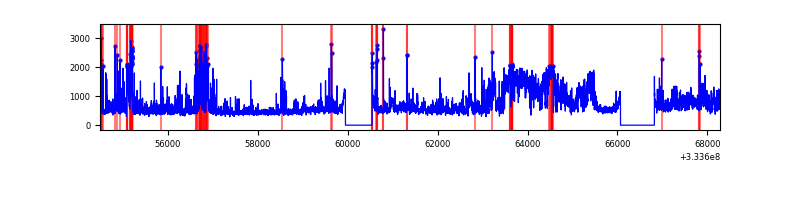 |
Top three noisy pixels from each quadrant. If the there are fewer than three noisy pixels in the level2.evt file, extra rows are filled as -1
| Pixel properties | Quadrant properties | ||||||
|---|---|---|---|---|---|---|---|
| Quadrant | DetID | PixID | Counts | Sigma | Mean | Median | Sigma |
| A | 0 | 13 | 2956786 | 9746.78 | 1496 | 1462 | 303.2 |
| A | 3 | 1 | 139149 | 454.1 | 1496 | 1462 | 303.2 |
| A | 13 | 254 | 20860 | 63.98 | 1496 | 1462 | 303.2 |
| B | 0 | 190 | 122334 | 419.68 | 1501 | 1461 | 288.0 |
| B | 5 | 172 | 108231 | 370.72 | 1501 | 1461 | 288.0 |
| B | 0 | 229 | 98835 | 338.09 | 1501 | 1461 | 288.0 |
| C | 2 | 16 | 406145 | 1193.58 | 1443 | 1452 | 339.1 |
| C | 14 | 238 | 232218 | 680.61 | 1443 | 1452 | 339.1 |
| C | 3 | 233 | 75607 | 218.71 | 1443 | 1452 | 339.1 |
| D | 1 | 52 | 3351393 | 9641.25 | 1461 | 1425 | 347.5 |
| D | 12 | 233 | 206541 | 590.33 | 1461 | 1425 | 347.5 |
| D | 2 | 234 | 54606 | 153.05 | 1461 | 1425 | 347.5 |
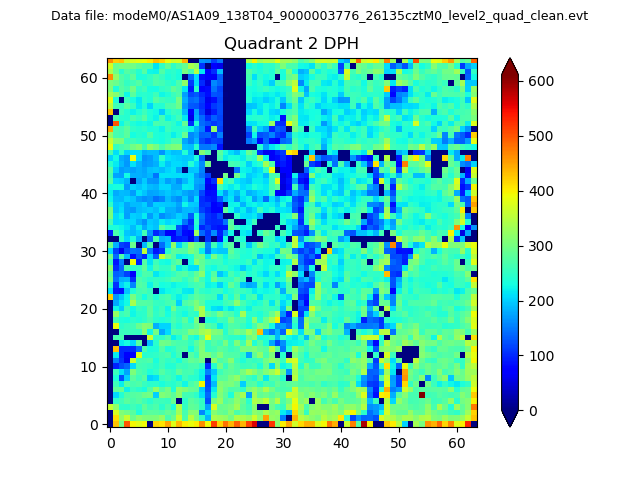
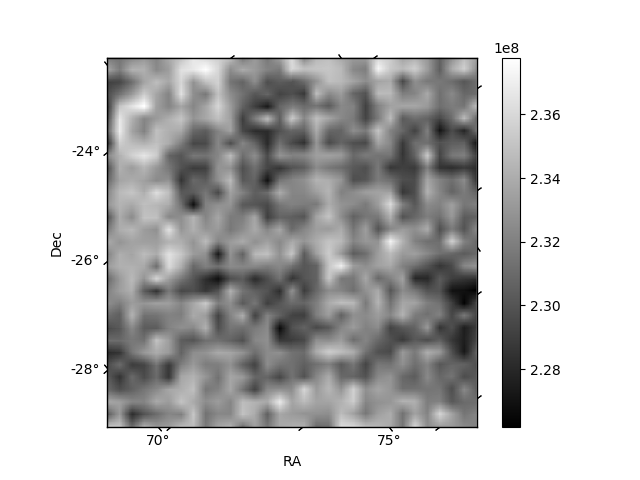
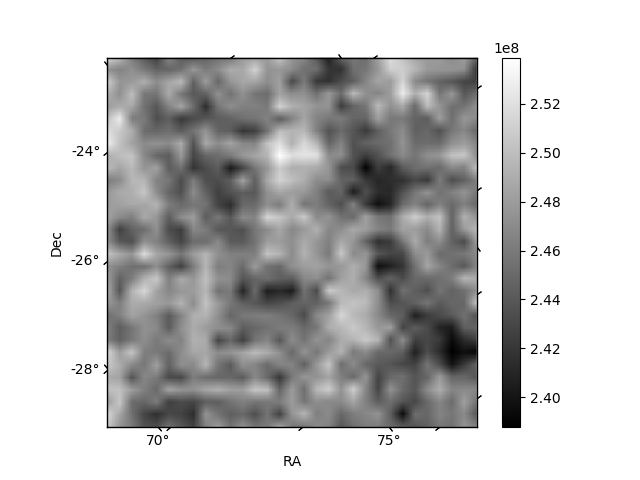
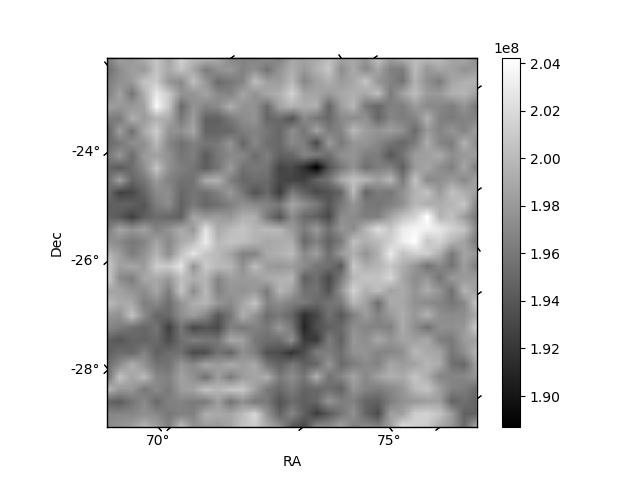
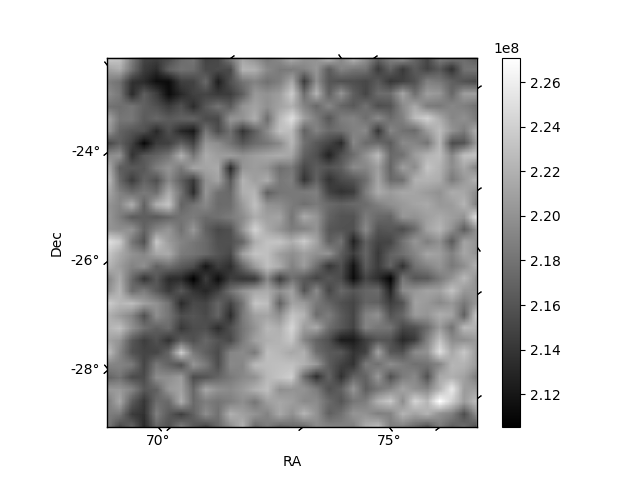
Histogram calculated using DETX and DETY for each event in the final _common_clean file
| Quadrant A | 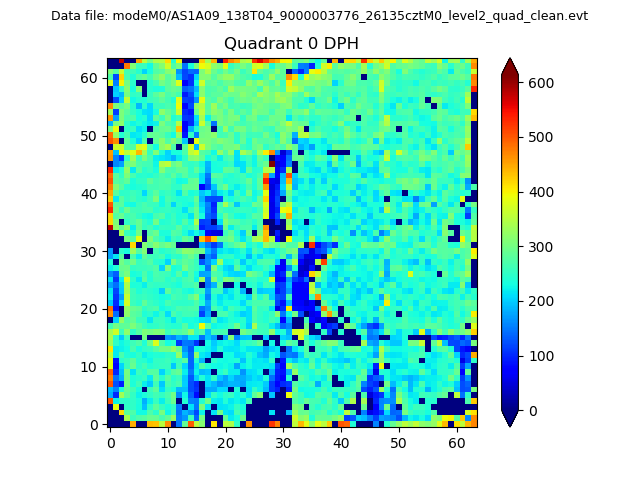 |
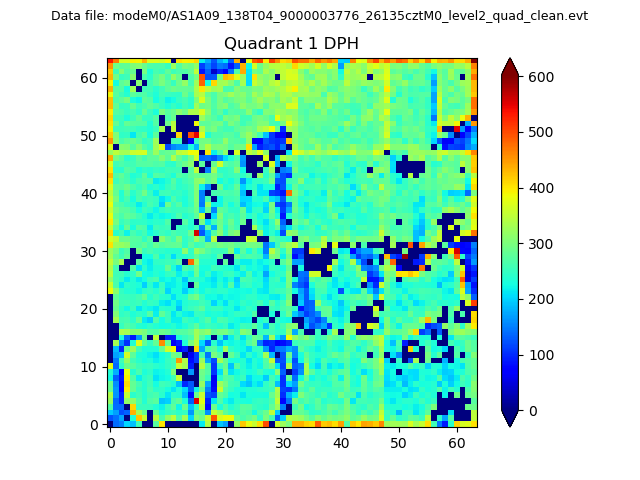 |
Quadrant B |
|---|---|---|---|
| Quadrant D | 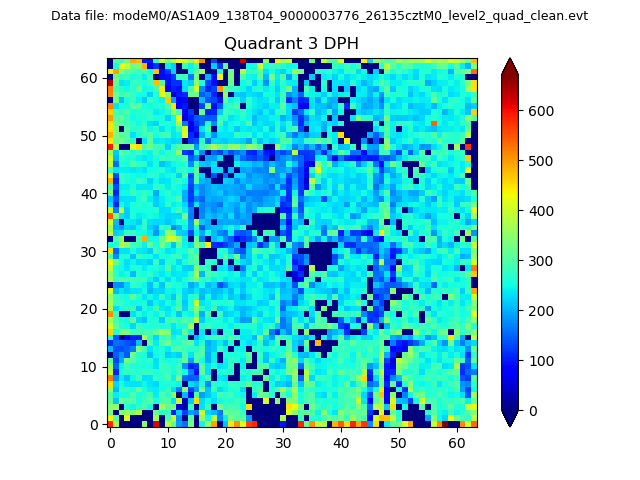 |
 |
Quadrant C |
| Plot type | Count rate plots | Images |
|---|---|---|
| Comparison with Poisson distribution Blue bars denote a histogram of data divided into 1 sec bins. Red curve is a Poisson curve with rate = median count rate of data. |
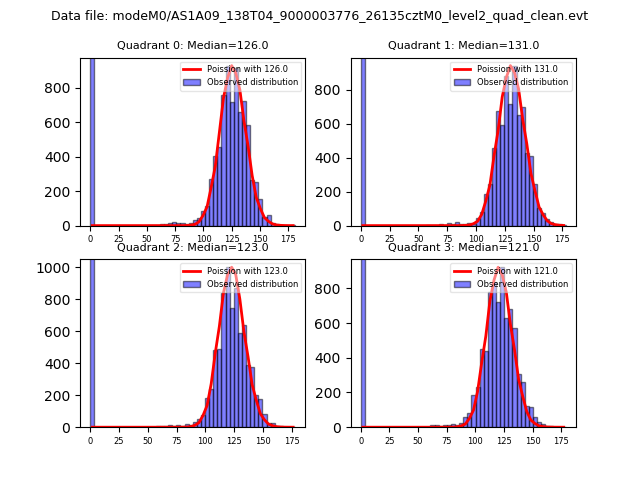 |
 |
| Quadrant-wise count rates Data is divided into 100 sec bins |
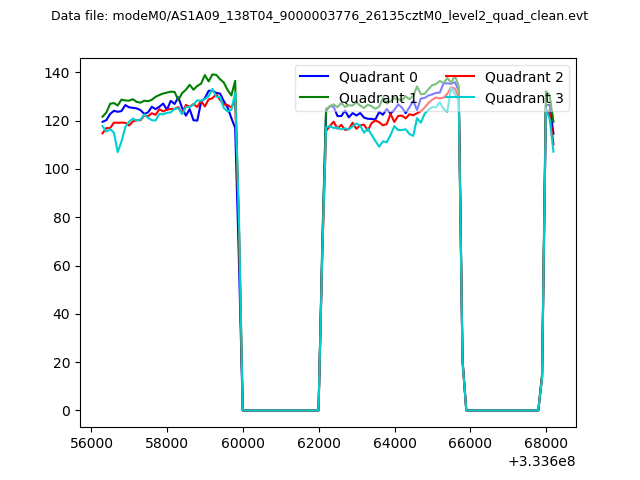 |
|
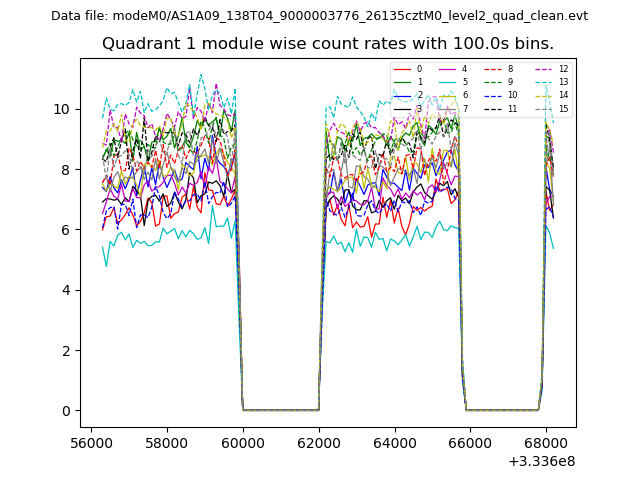
| Module-wise count rates for Quadrant A Data is divided into 100 sec bins |
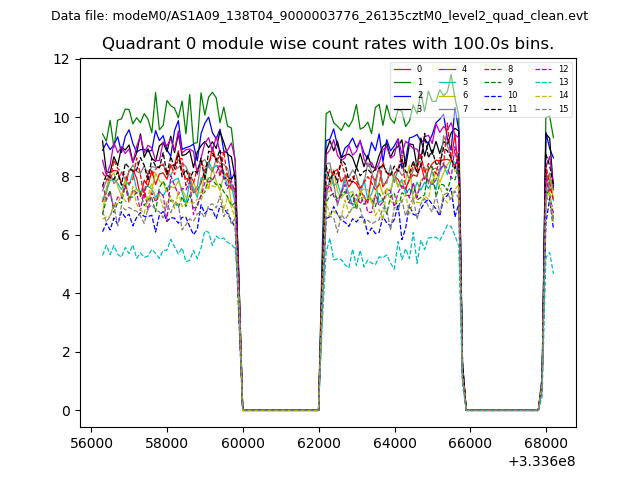 |
 |
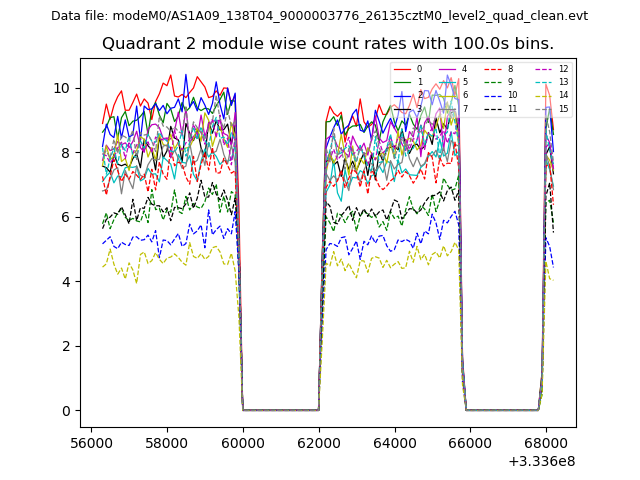
| Module-wise count rates for Quadrant B Data is divided into 100 sec bins |
 |
 |
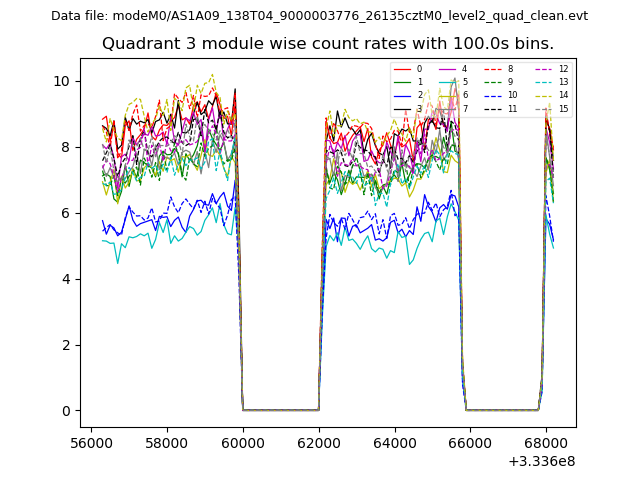
| Module-wise count rates for Quadrant C Data is divided into 100 sec bins |
 |
 |
| Module-wise count rates for Quadrant D Data is divided into 100 sec bins |
 |
 |
| Parameter | Plot |
|---|---|
| CZT HV Monitor | 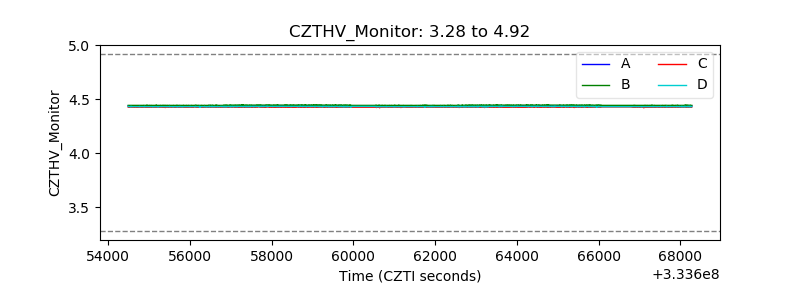 |
| D_VDD | 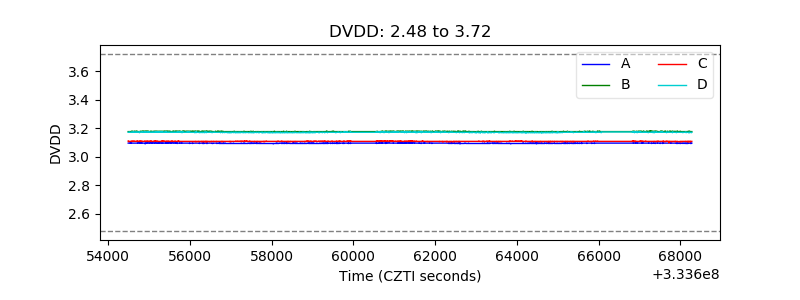 |
| Temperature 1 | 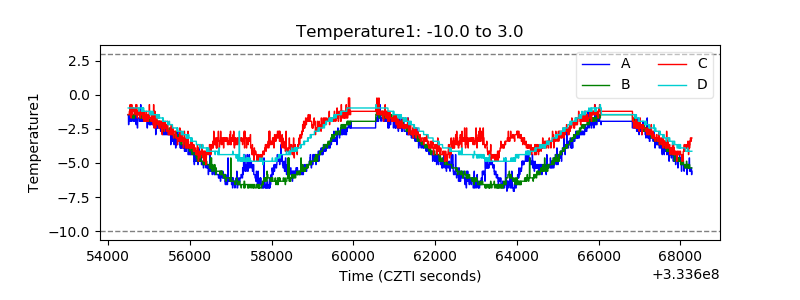 |
| Veto HV Monitor | 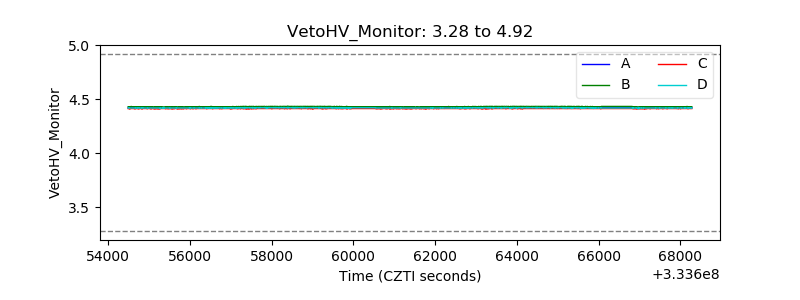 |
| Veto LLD | 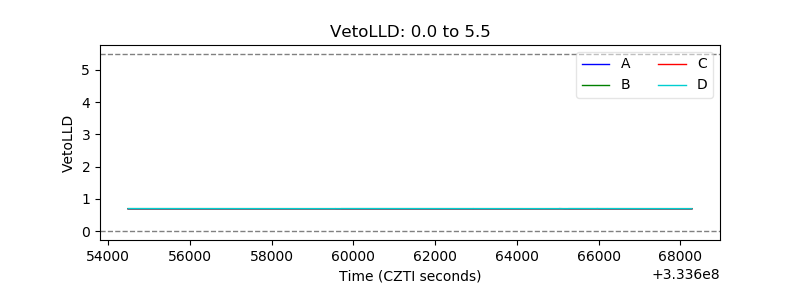 |
| Alpha Counter | 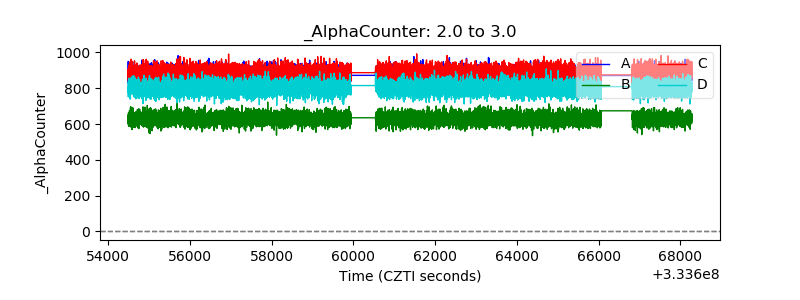 |
| _CPM_Rate | 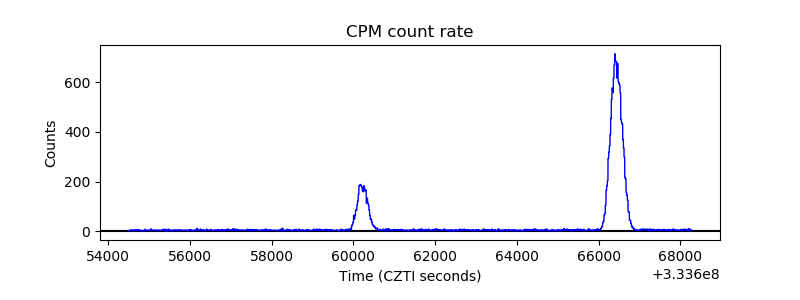 |
| CZT Counter |  |
| +2.5 Volts monitor |  |
| +5 Volts monitor |  |
| _ROLL_ROT | 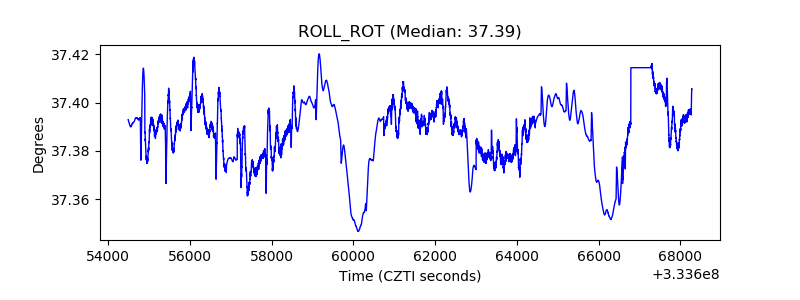 |
| _Roll_DEC | 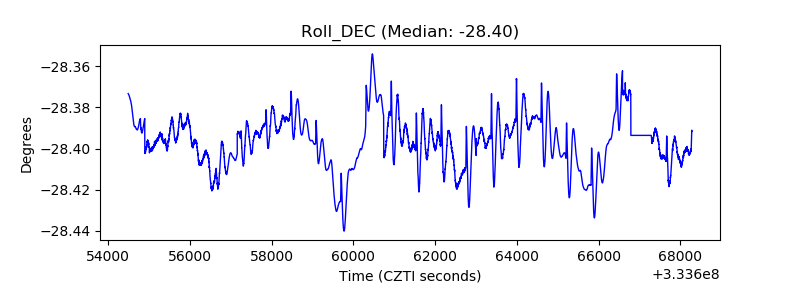 |
| _Roll_RA |  |
| Veto Counter | 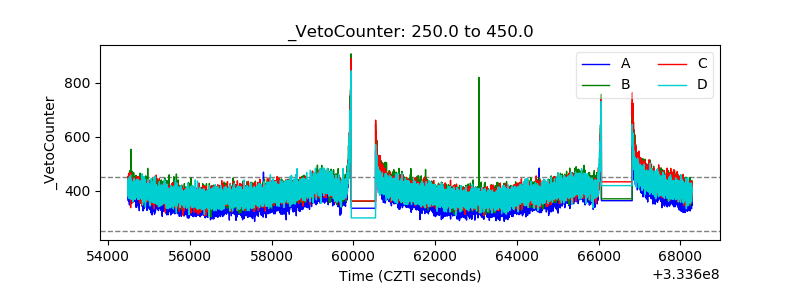 |