| Param | Original file | Final file |
|---|---|---|
| Filename | modeM0/AS1A09_138T04_9000003776_26136cztM0_level2.evt | modeM0/AS1A09_138T04_9000003776_26136cztM0_level2_quad_clean.evt |
| Size (bytes) | 510,693,120 | 88,784,640 |
| Size | 487.0 MB | 84.7 MB |
| Events in quadrant A | 3,691,330 | 561,654 |
| Events in quadrant B | 3,345,889 | 575,724 |
| Events in quadrant C | 3,762,532 | 539,732 |
| Events in quadrant D | 4,207,002 | 539,574 |
| Mode M9 | |||
|---|---|---|---|
| Quadrant | BADHDUFLAG | Total packets | Discarded packets |
| A | 0 | 9 | 0 |
| B | 0 | 10 | 0 |
| C | 0 | 10 | 0 |
| D | 0 | 10 | 0 |
| Mode M0 | |||
|---|---|---|---|
| Quadrant | BADHDUFLAG | Total packets | Discarded packets |
| A | 0 | 15273 | 0 |
| B | 0 | 14148 | 0 |
| C | 0 | 15331 | 0 |
| D | 0 | 17055 | 0 |
| Quadrant | Total seconds | Saturated seconds | Saturation percentage |
|---|---|---|---|
| A | 6771 | 62 | 0.915670% |
| B | 6771 | 66 | 0.974745% |
| C | 6771 | 183 | 2.702703% |
| D | 6771 | 162 | 2.392556% |
Noise dominated data is calculated using 1-second bins in cleaned event files. If a bin has >2000 counts, and if more than 50% of those come from <1% of pixels, then it is considered to be noise-dominated and hence unusable.
| Quadrant | # 1 sec bins | Bins with >0 counts | Bins with >2000 counts | High rate bins dominated by noise | Noise dominated (total time) | Noise dominated (detector-on time) | Marked lightcurve |
|---|---|---|---|---|---|---|---|
| A | 7696 | 6771 | 0 | 0 | 0.00% | 0.00% | 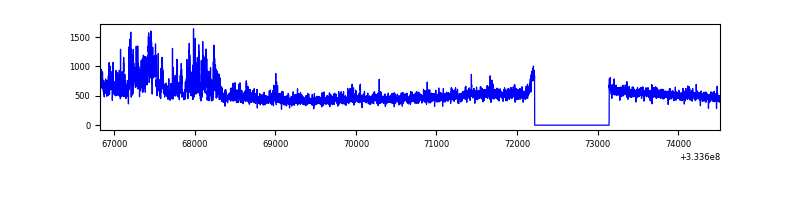 |
| B | 7696 | 6771 | 0 | 0 | 0.00% | 0.00% | 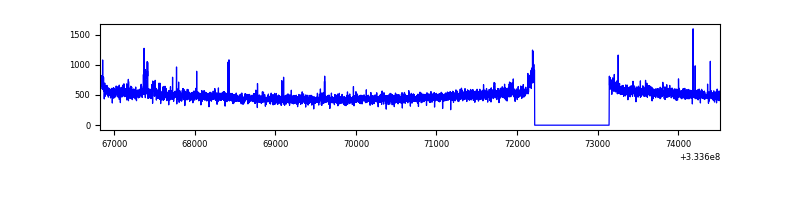 |
| C | 7696 | 6771 | 65 | 65 | 0.84% | 0.96% | 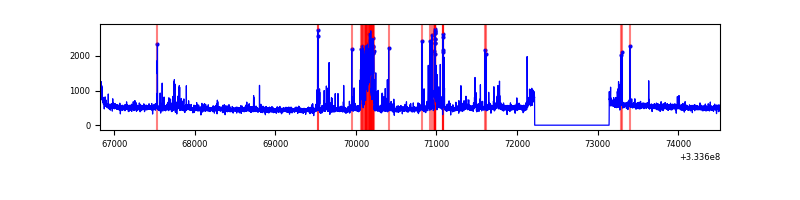 |
| D | 7696 | 6771 | 80 | 80 | 1.04% | 1.18% | 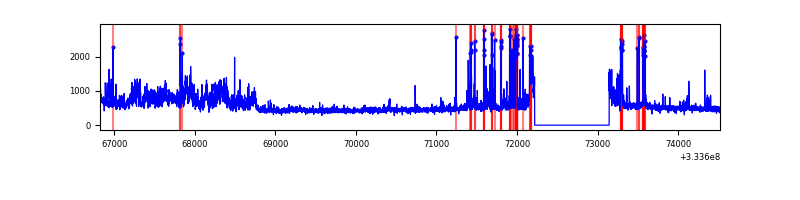 |
Top three noisy pixels from each quadrant. If the there are fewer than three noisy pixels in the level2.evt file, extra rows are filled as -1
| Pixel properties | Quadrant properties | ||||||
|---|---|---|---|---|---|---|---|
| Quadrant | DetID | PixID | Counts | Sigma | Mean | Median | Sigma |
| A | 0 | 13 | 315255 | 1851.4 | 839 | 822 | 169.8 |
| A | 3 | 1 | 138190 | 808.83 | 839 | 822 | 169.8 |
| A | 13 | 254 | 11746 | 64.32 | 839 | 822 | 169.8 |
| B | 0 | 190 | 32599 | 198.04 | 837 | 814 | 160.5 |
| B | 0 | 229 | 20881 | 125.03 | 837 | 814 | 160.5 |
| B | 12 | 111 | 19513 | 116.5 | 837 | 814 | 160.5 |
| C | 3 | 233 | 273439 | 1442.5 | 806 | 812 | 189.0 |
| C | 2 | 16 | 217291 | 1145.41 | 806 | 812 | 189.0 |
| C | 14 | 238 | 128197 | 674.01 | 806 | 812 | 189.0 |
| D | 1 | 52 | 800283 | 4123.82 | 812 | 792 | 193.9 |
| D | 12 | 233 | 265263 | 1364.16 | 812 | 792 | 193.9 |
| D | 8 | 195 | 62025 | 315.84 | 812 | 792 | 193.9 |
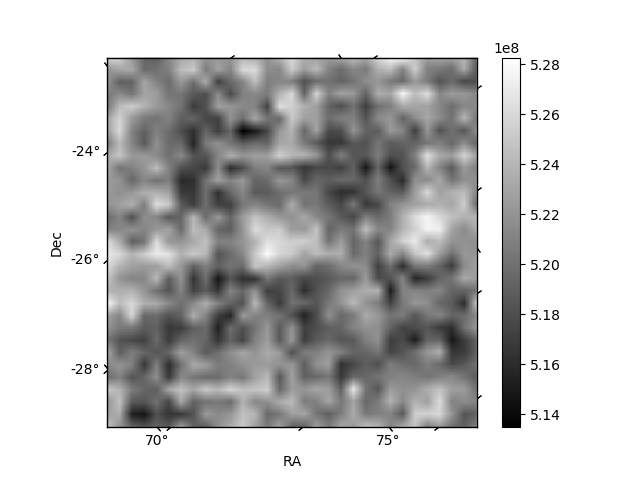
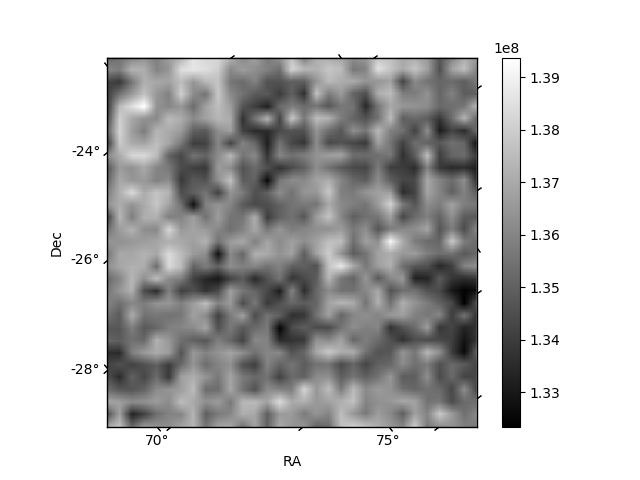
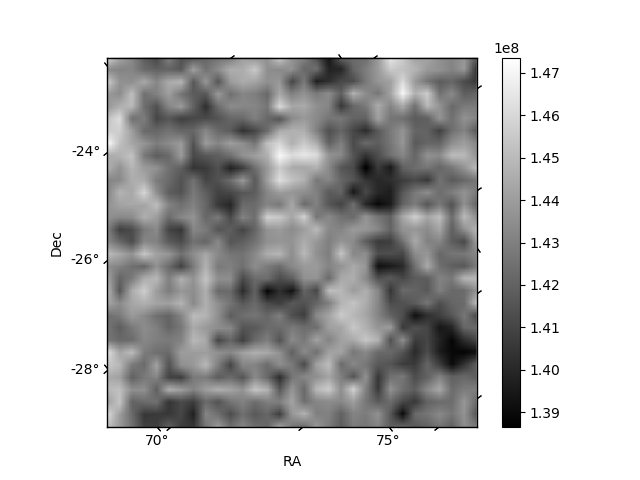
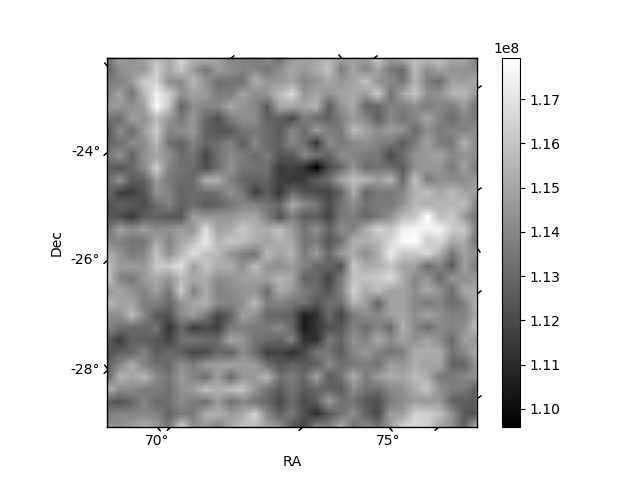
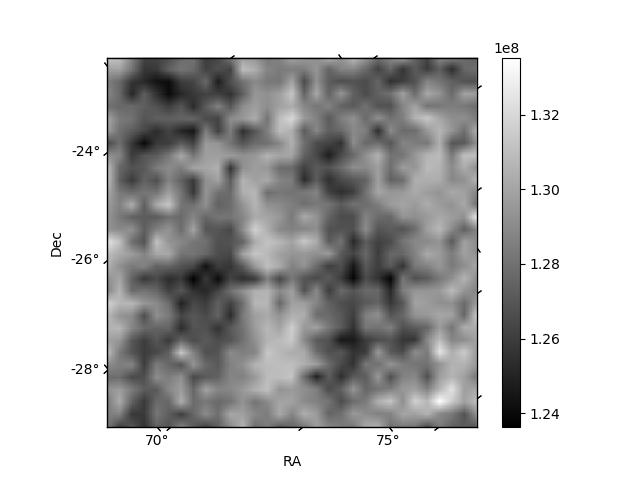
Histogram calculated using DETX and DETY for each event in the final _common_clean file
| Quadrant A | 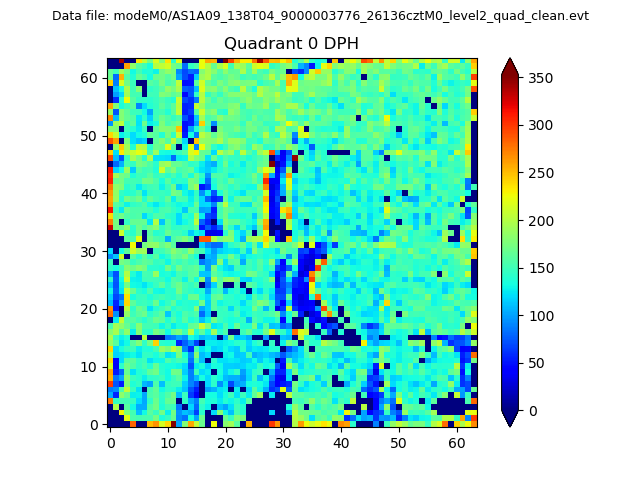 |
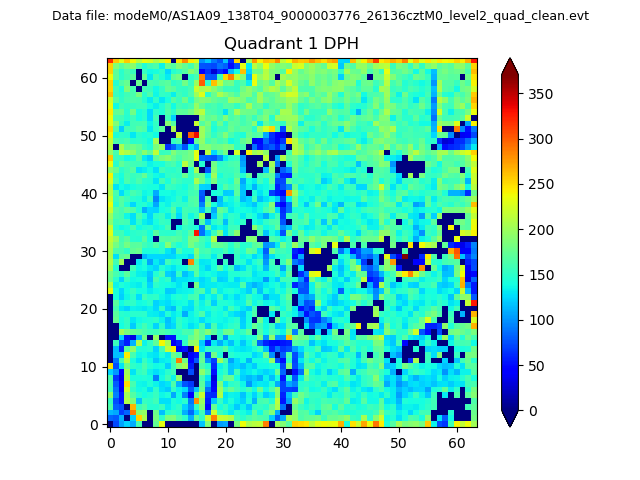 |
Quadrant B |
|---|---|---|---|
| Quadrant D | 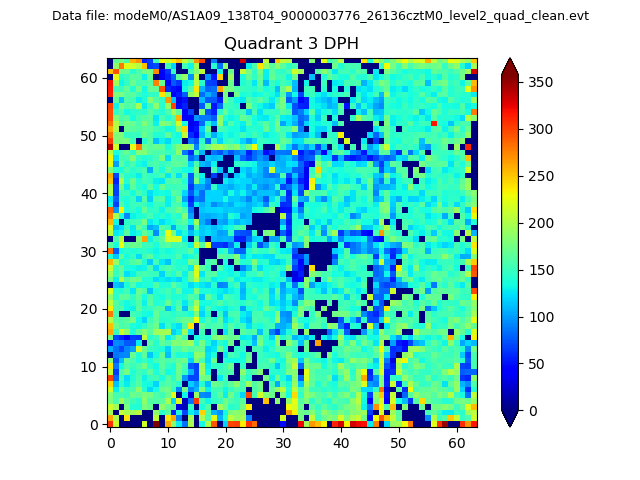 |
 |
Quadrant C |
| Plot type | Count rate plots | Images |
|---|---|---|
| Comparison with Poisson distribution Blue bars denote a histogram of data divided into 1 sec bins. Red curve is a Poisson curve with rate = median count rate of data. |
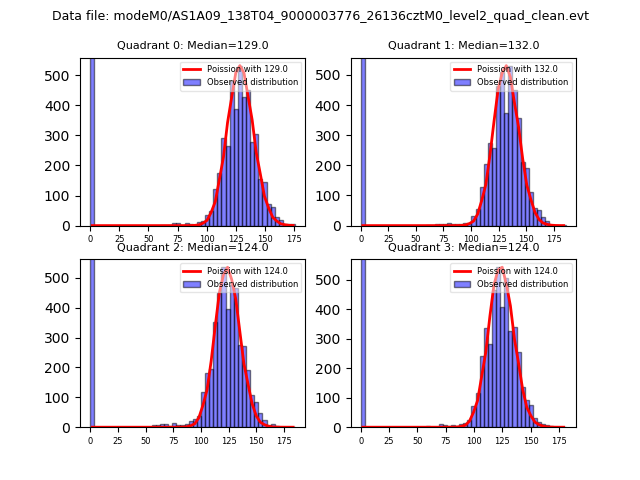 |
 |
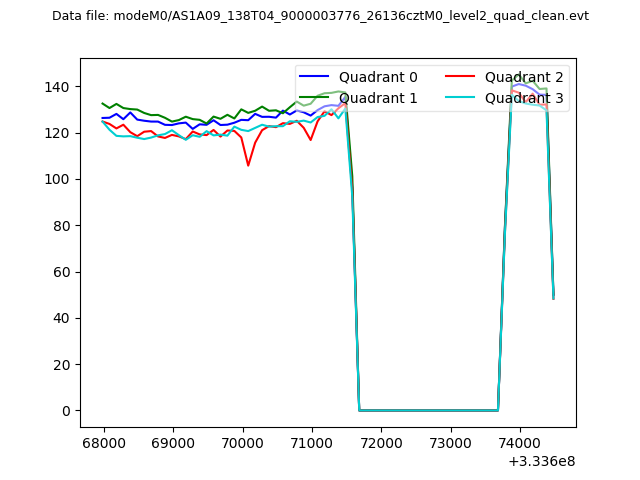
| Quadrant-wise count rates Data is divided into 100 sec bins |
 |
|
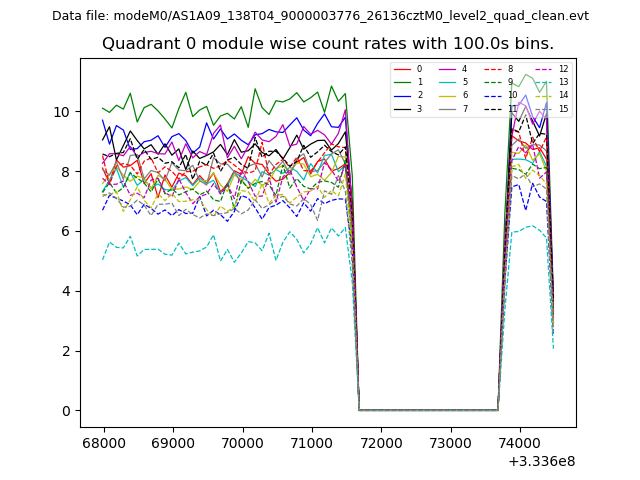
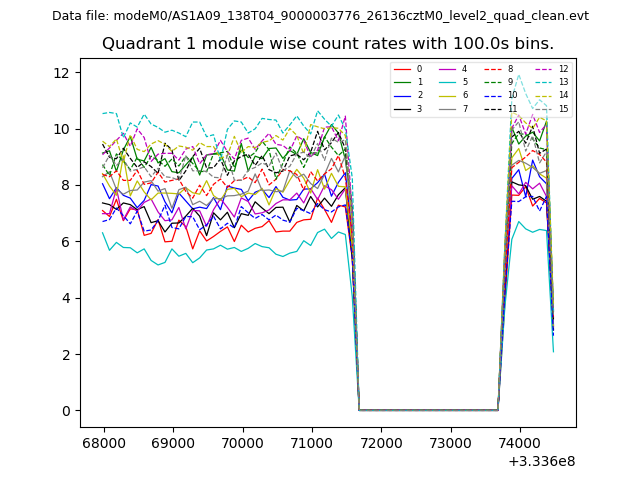
| Module-wise count rates for Quadrant A Data is divided into 100 sec bins |
 |
 |
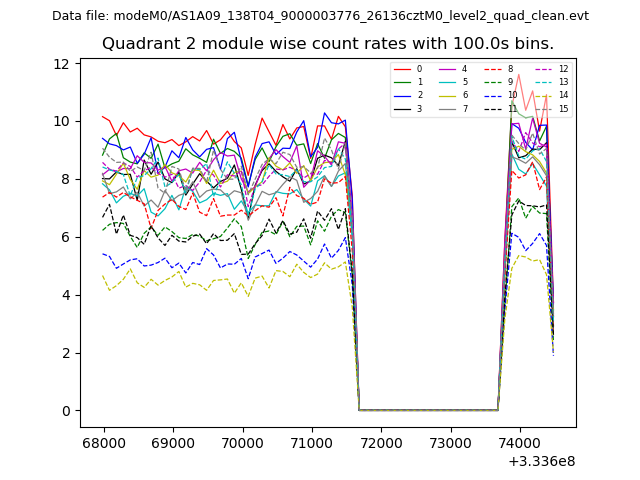
| Module-wise count rates for Quadrant B Data is divided into 100 sec bins |
 |
 |
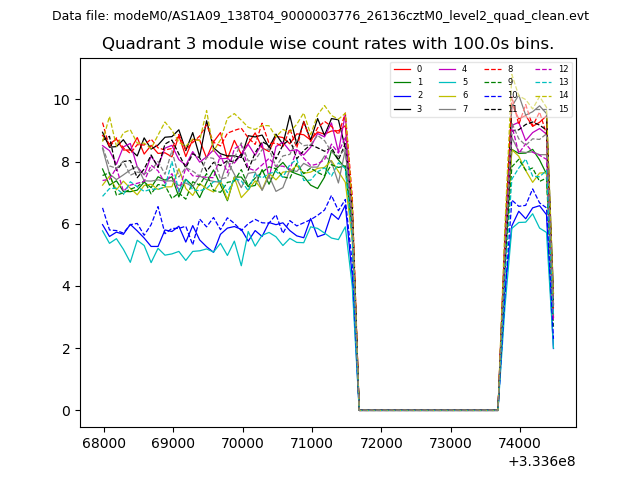
| Module-wise count rates for Quadrant C Data is divided into 100 sec bins |
 |
 |
| Module-wise count rates for Quadrant D Data is divided into 100 sec bins |
 |
 |
| Parameter | Plot |
|---|---|
| CZT HV Monitor | 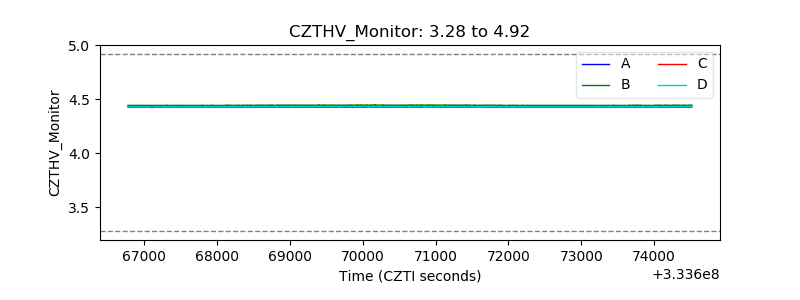 |
| D_VDD | 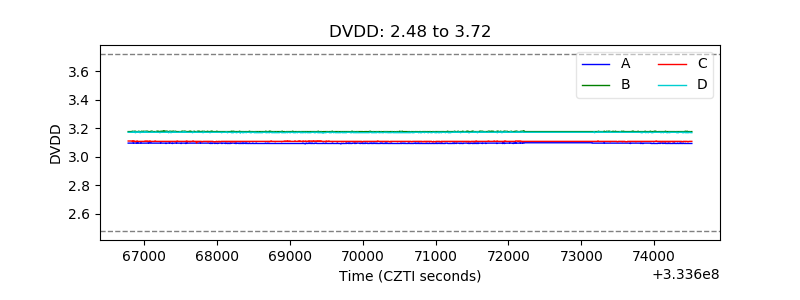 |
| Temperature 1 | 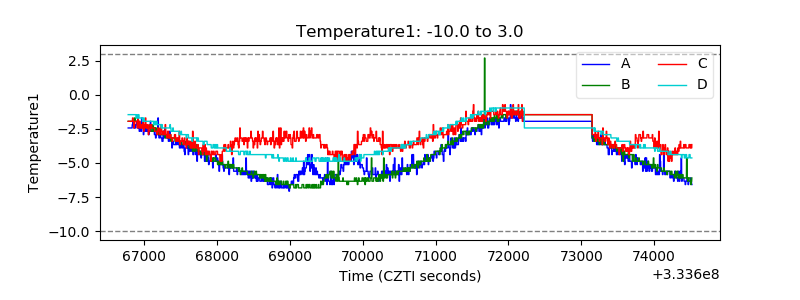 |
| Veto HV Monitor | 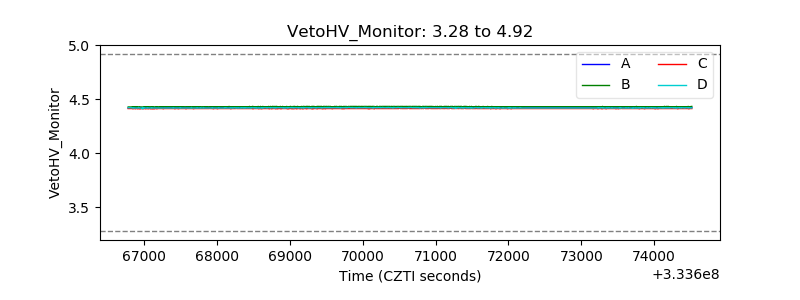 |
| Veto LLD | 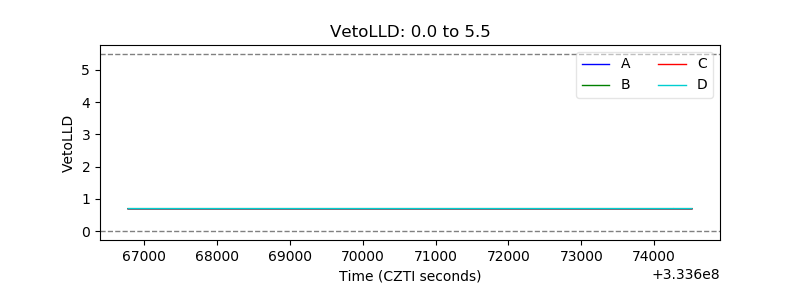 |
| Alpha Counter | 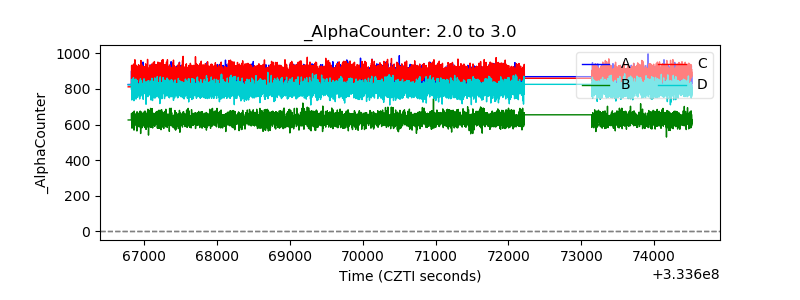 |
| _CPM_Rate | 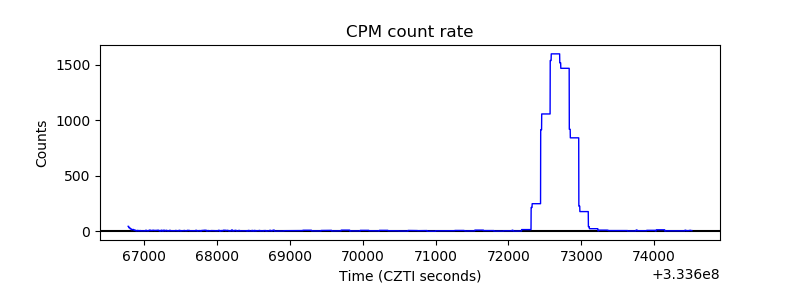 |
| CZT Counter |  |
| +2.5 Volts monitor |  |
| +5 Volts monitor | 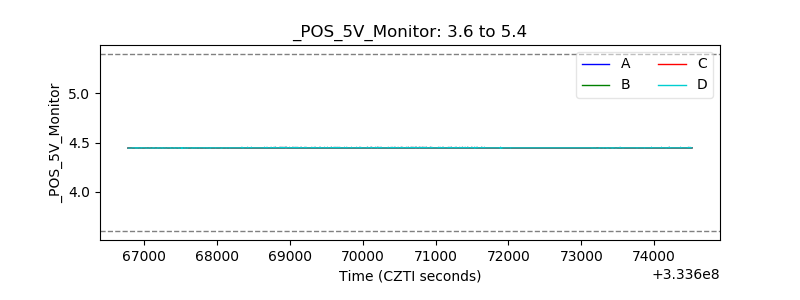 |
| _ROLL_ROT | 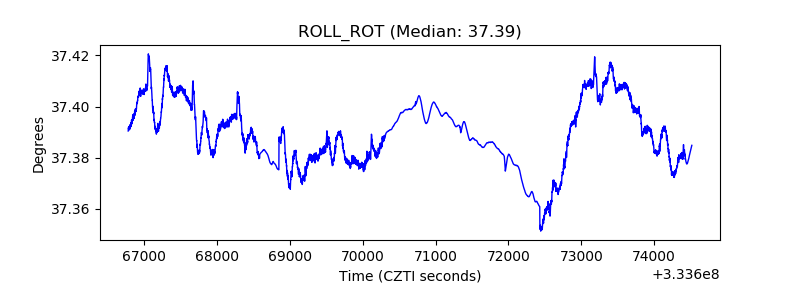 |
| _Roll_DEC | 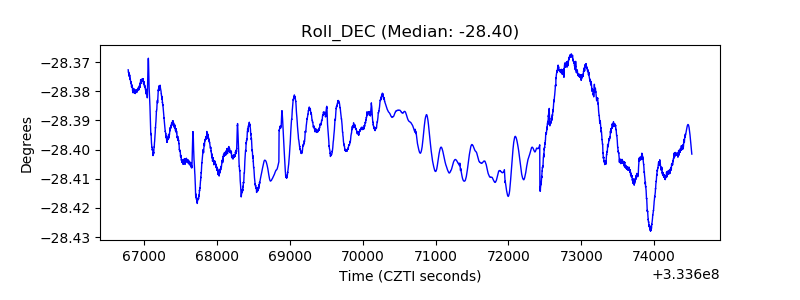 |
| _Roll_RA | 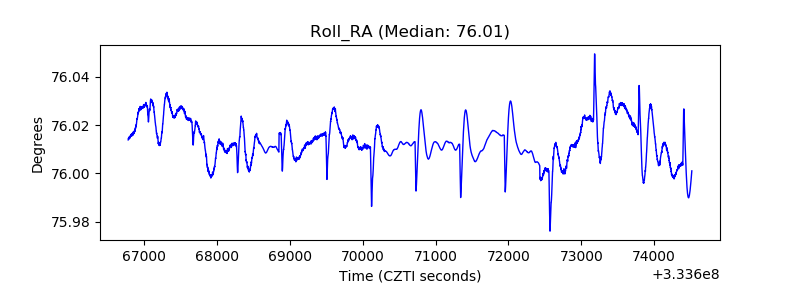 |
| Veto Counter | 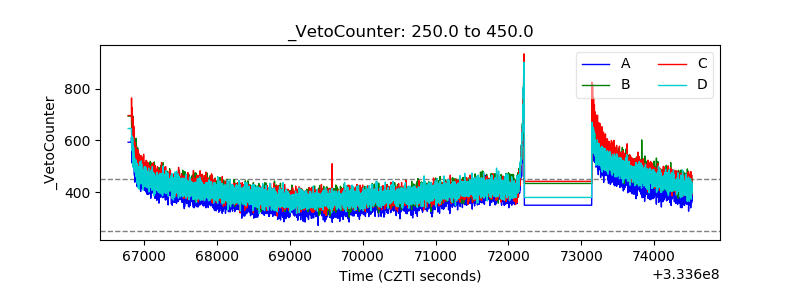 |