| Param | Original file | Final file |
|---|---|---|
| Filename | modeM0/AS1A09_138T04_9000003776_26137cztM0_level2.evt | modeM0/AS1A09_138T04_9000003776_26137cztM0_level2_quad_clean.evt |
| Size (bytes) | 473,541,120 | 101,151,360 |
| Size | 451.6 MB | 96.5 MB |
| Events in quadrant A | 3,349,669 | 654,194 |
| Events in quadrant B | 3,350,412 | 675,436 |
| Events in quadrant C | 3,435,905 | 642,505 |
| Events in quadrant D | 3,757,003 | 631,007 |
| Mode M9 | |||
|---|---|---|---|
| Quadrant | BADHDUFLAG | Total packets | Discarded packets |
| A | 0 | 15 | 0 |
| B | 0 | 16 | 0 |
| C | 0 | 16 | 0 |
| D | 0 | 16 | 0 |
| Mode M0 | |||
|---|---|---|---|
| Quadrant | BADHDUFLAG | Total packets | Discarded packets |
| A | 0 | 14190 | 0 |
| B | 0 | 14121 | 0 |
| C | 0 | 14260 | 0 |
| D | 0 | 15566 | 0 |
| Quadrant | Total seconds | Saturated seconds | Saturation percentage |
|---|---|---|---|
| A | 6600 | 37 | 0.560606% |
| B | 6600 | 57 | 0.863636% |
| C | 6600 | 105 | 1.590909% |
| D | 6600 | 158 | 2.393939% |
Noise dominated data is calculated using 1-second bins in cleaned event files. If a bin has >2000 counts, and if more than 50% of those come from <1% of pixels, then it is considered to be noise-dominated and hence unusable.
| Quadrant | # 1 sec bins | Bins with >0 counts | Bins with >2000 counts | High rate bins dominated by noise | Noise dominated (total time) | Noise dominated (detector-on time) | Marked lightcurve |
|---|---|---|---|---|---|---|---|
| A | 7670 | 6600 | 0 | 0 | 0.00% | 0.00% |  |
| B | 7670 | 6600 | 0 | 0 | 0.00% | 0.00% |  |
| C | 7670 | 6600 | 6 | 6 | 0.08% | 0.09% |  |
| D | 7670 | 6600 | 88 | 88 | 1.15% | 1.33% | 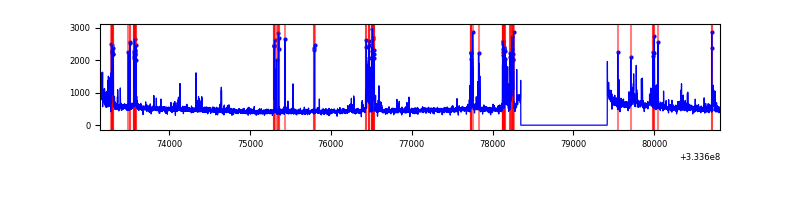 |
Top three noisy pixels from each quadrant. If the there are fewer than three noisy pixels in the level2.evt file, extra rows are filled as -1
| Pixel properties | Quadrant properties | ||||||
|---|---|---|---|---|---|---|---|
| Quadrant | DetID | PixID | Counts | Sigma | Mean | Median | Sigma |
| A | 0 | 13 | 119385 | 702.37 | 838 | 820 | 168.8 |
| A | 13 | 254 | 10538 | 57.57 | 838 | 820 | 168.8 |
| A | 3 | 137 | 7752 | 41.06 | 838 | 820 | 168.8 |
| B | 0 | 190 | 27538 | 166.87 | 839 | 816 | 160.1 |
| B | 12 | 111 | 19149 | 114.48 | 839 | 816 | 160.1 |
| B | 5 | 172 | 17577 | 104.67 | 839 | 816 | 160.1 |
| C | 14 | 238 | 130306 | 675.26 | 819 | 826 | 191.7 |
| C | 2 | 16 | 74368 | 383.54 | 819 | 826 | 191.7 |
| C | 3 | 233 | 33769 | 171.8 | 819 | 826 | 191.7 |
| D | 1 | 52 | 319161 | 1625.3 | 821 | 805 | 195.9 |
| D | 12 | 233 | 304533 | 1550.62 | 821 | 805 | 195.9 |
| D | 2 | 234 | 26709 | 132.25 | 821 | 805 | 195.9 |
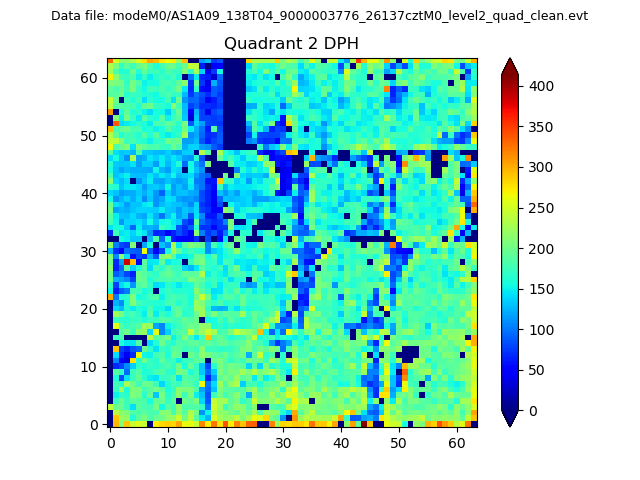
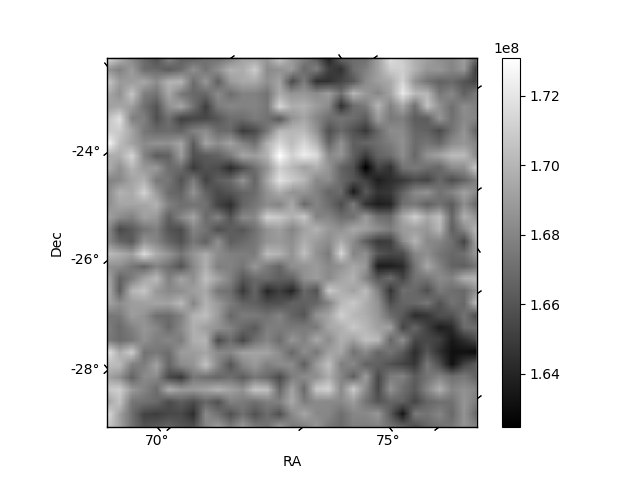
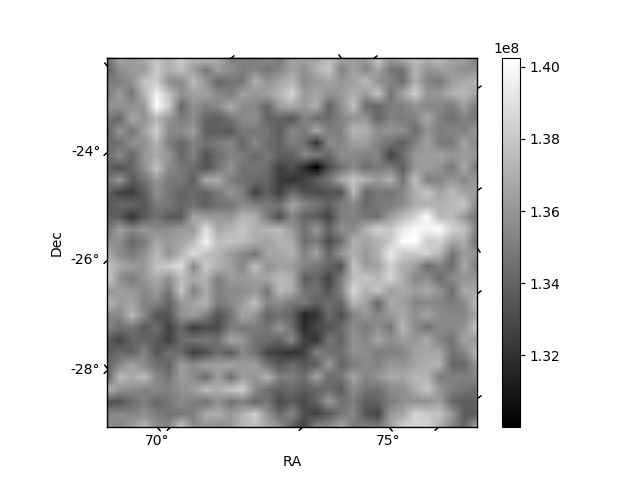
Histogram calculated using DETX and DETY for each event in the final _common_clean file
| Quadrant A | 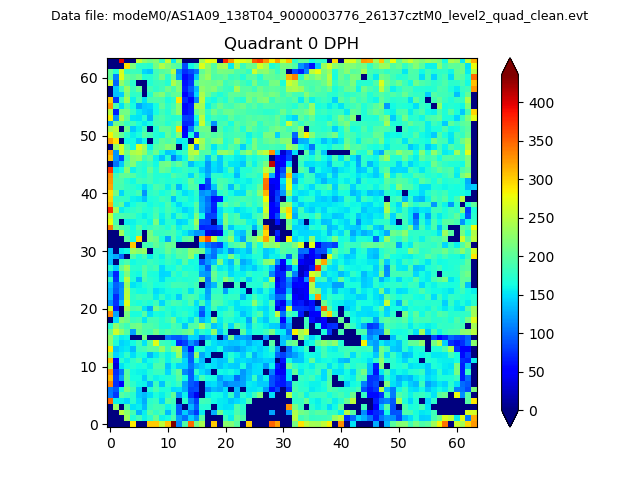 |
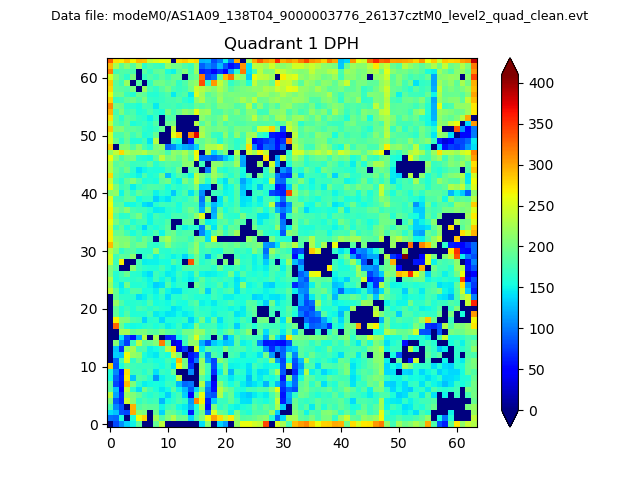 |
Quadrant B |
|---|---|---|---|
| Quadrant D | 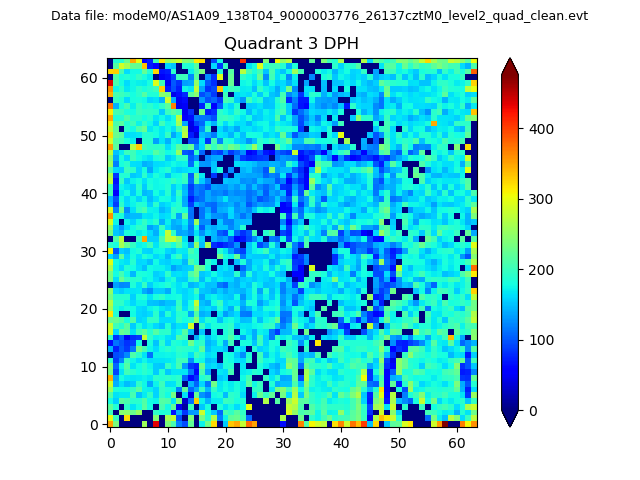 |
 |
Quadrant C |
| Plot type | Count rate plots | Images |
|---|---|---|
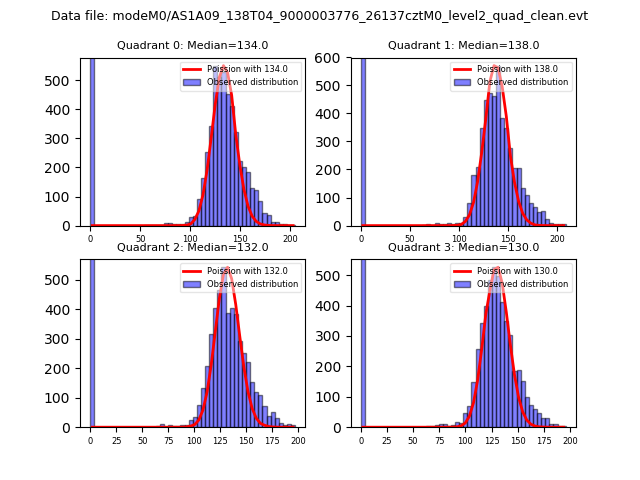
| Comparison with Poisson distribution Blue bars denote a histogram of data divided into 1 sec bins. Red curve is a Poisson curve with rate = median count rate of data. |
 |
 |
| Quadrant-wise count rates Data is divided into 100 sec bins |
 |
|
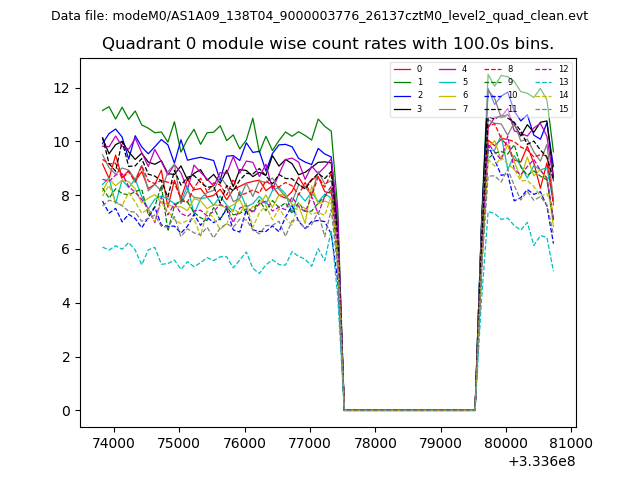
| Module-wise count rates for Quadrant A Data is divided into 100 sec bins |
 |
 |
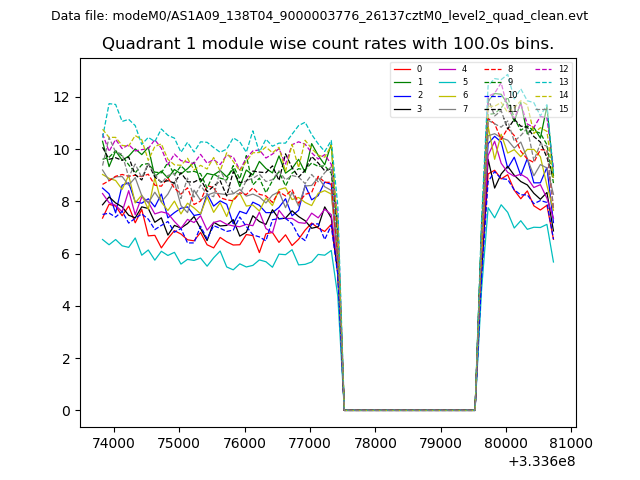
| Module-wise count rates for Quadrant B Data is divided into 100 sec bins |
 |
 |
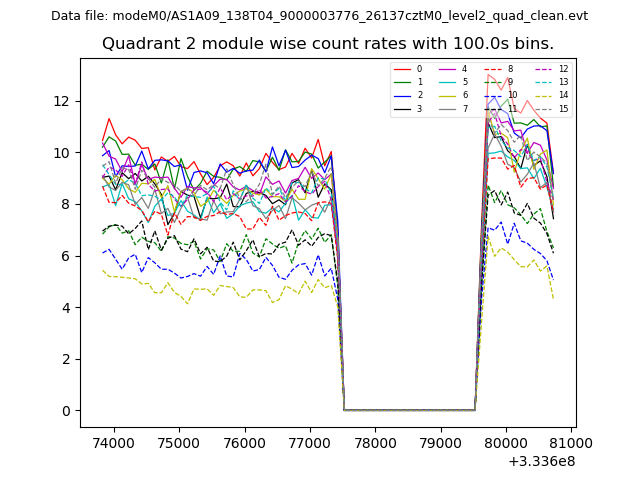
| Module-wise count rates for Quadrant C Data is divided into 100 sec bins |
 |
 |
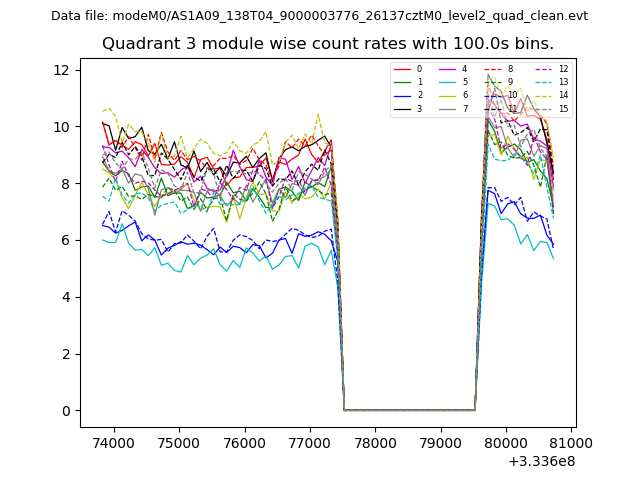
| Module-wise count rates for Quadrant D Data is divided into 100 sec bins |
 |
 |
| Parameter | Plot |
|---|---|
| CZT HV Monitor | 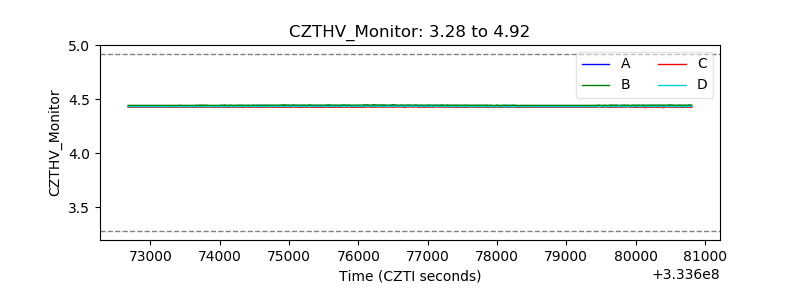 |
| D_VDD | 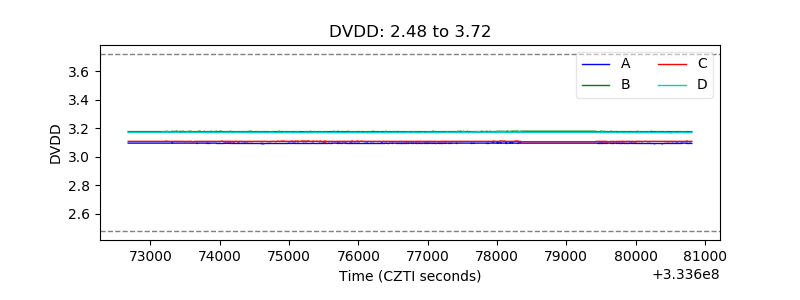 |
| Temperature 1 | 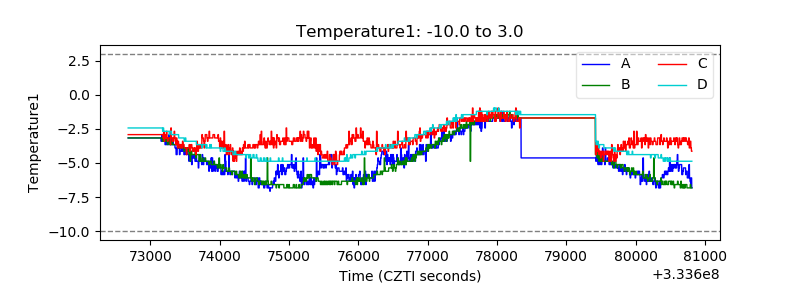 |
| Veto HV Monitor |  |
| Veto LLD | 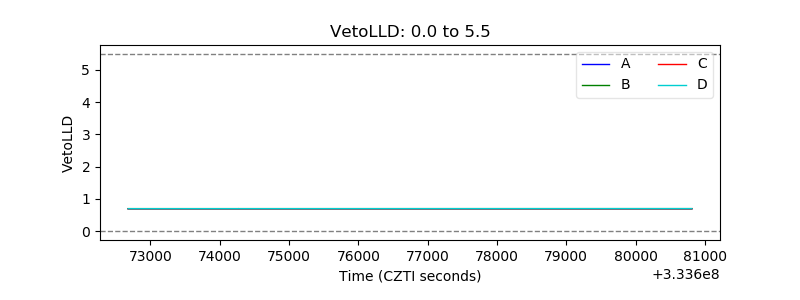 |
| Alpha Counter | 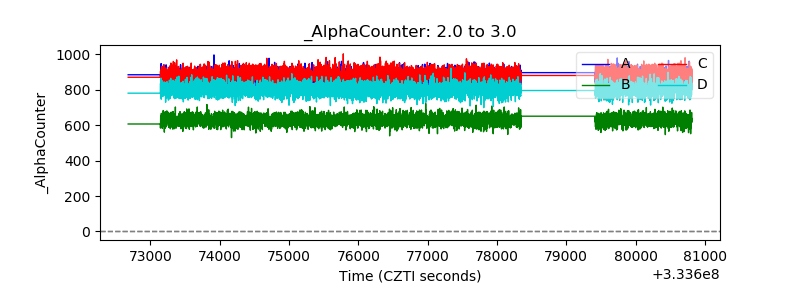 |
| _CPM_Rate |  |
| CZT Counter | 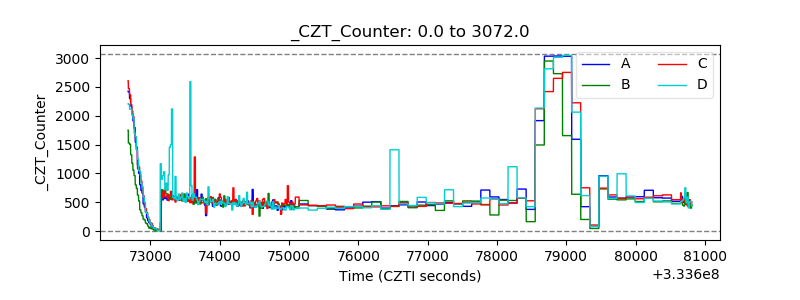 |
| +2.5 Volts monitor |  |
| +5 Volts monitor |  |
| _ROLL_ROT | 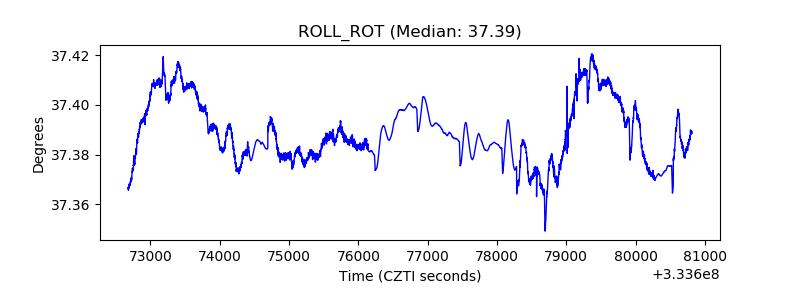 |
| _Roll_DEC | 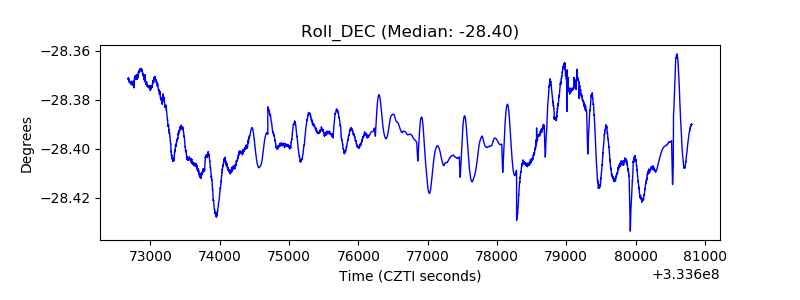 |
| _Roll_RA | 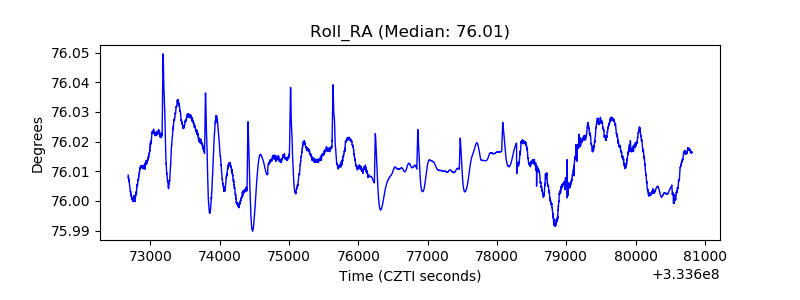 |
| Veto Counter | 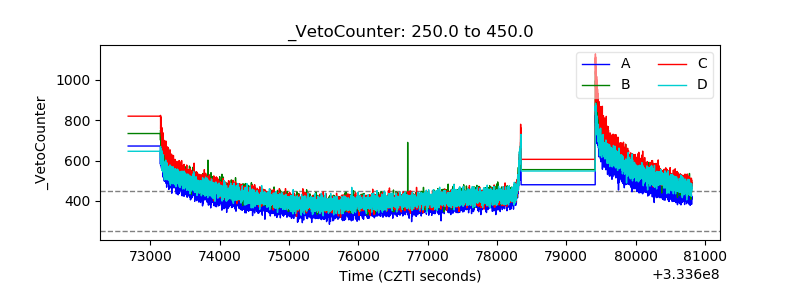 |