| Param | Original file | Final file |
|---|---|---|
| Filename | modeM0/AS1A09_138T04_9000003776_26139cztM0_level2.evt | modeM0/AS1A09_138T04_9000003776_26139cztM0_level2_quad_clean.evt |
| Size (bytes) | 475,240,320 | 111,965,760 |
| Size | 453.2 MB | 106.8 MB |
| Events in quadrant A | 3,604,159 | 732,086 |
| Events in quadrant B | 3,312,600 | 764,616 |
| Events in quadrant C | 3,401,293 | 733,646 |
| Events in quadrant D | 3,644,171 | 718,238 |
| Mode M9 | |||
|---|---|---|---|
| Quadrant | BADHDUFLAG | Total packets | Discarded packets |
| A | 0 | 21 | 0 |
| B | 0 | 22 | 0 |
| C | 0 | 22 | 0 |
| D | 0 | 22 | 0 |
| Mode M0 | |||
|---|---|---|---|
| Quadrant | BADHDUFLAG | Total packets | Discarded packets |
| A | 0 | 14992 | 0 |
| B | 0 | 13875 | 0 |
| C | 0 | 14101 | 0 |
| D | 0 | 14986 | 0 |
| Quadrant | Total seconds | Saturated seconds | Saturation percentage |
|---|---|---|---|
| A | 6344 | 39 | 0.614754% |
| B | 6343 | 49 | 0.772505% |
| C | 6343 | 96 | 1.513479% |
| D | 6343 | 86 | 1.355825% |
Noise dominated data is calculated using 1-second bins in cleaned event files. If a bin has >2000 counts, and if more than 50% of those come from <1% of pixels, then it is considered to be noise-dominated and hence unusable.
| Quadrant | # 1 sec bins | Bins with >0 counts | Bins with >2000 counts | High rate bins dominated by noise | Noise dominated (total time) | Noise dominated (detector-on time) | Marked lightcurve |
|---|---|---|---|---|---|---|---|
| A | 7559 | 6344 | 0 | 0 | 0.00% | 0.00% |  |
| B | 7558 | 6343 | 1 | 1 | 0.01% | 0.02% |  |
| C | 7558 | 6343 | 1 | 1 | 0.01% | 0.02% |  |
| D | 7558 | 6343 | 48 | 48 | 0.64% | 0.76% | 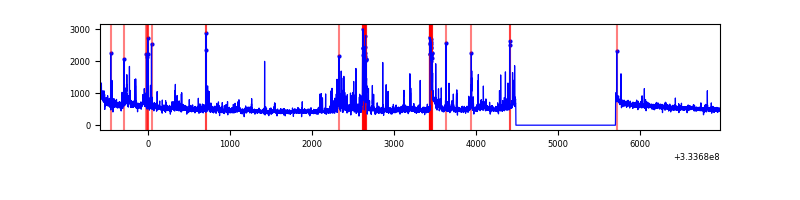 |
Top three noisy pixels from each quadrant. If the there are fewer than three noisy pixels in the level2.evt file, extra rows are filled as -1
| Pixel properties | Quadrant properties | ||||||
|---|---|---|---|---|---|---|---|
| Quadrant | DetID | PixID | Counts | Sigma | Mean | Median | Sigma |
| A | 0 | 13 | 387019 | 2307.83 | 834 | 818 | 167.3 |
| A | 13 | 254 | 10559 | 58.21 | 834 | 818 | 167.3 |
| A | 3 | 137 | 7222 | 38.27 | 834 | 818 | 167.3 |
| B | 0 | 190 | 20030 | 120.8 | 838 | 818 | 159.0 |
| B | 12 | 111 | 18836 | 113.29 | 838 | 818 | 159.0 |
| B | 11 | 111 | 16825 | 100.65 | 838 | 818 | 159.0 |
| C | 14 | 238 | 132162 | 681.77 | 824 | 833 | 192.6 |
| C | 3 | 233 | 37584 | 190.78 | 824 | 833 | 192.6 |
| C | 2 | 16 | 21784 | 108.76 | 824 | 833 | 192.6 |
| D | 1 | 52 | 436054 | 2230.29 | 825 | 809 | 195.2 |
| D | 12 | 233 | 55656 | 281.05 | 825 | 809 | 195.2 |
| D | 2 | 234 | 26184 | 130.03 | 825 | 809 | 195.2 |
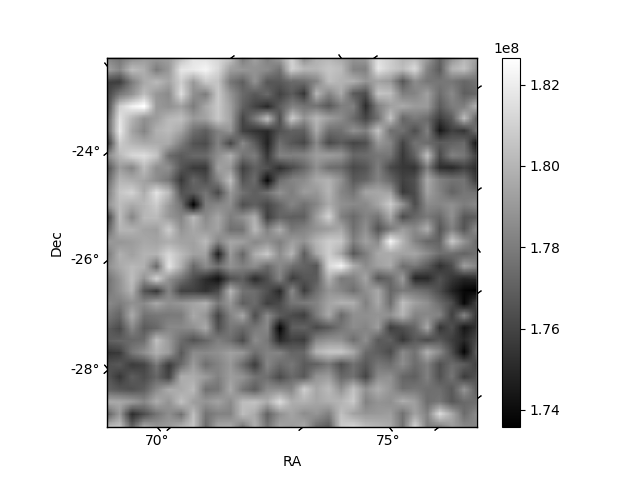
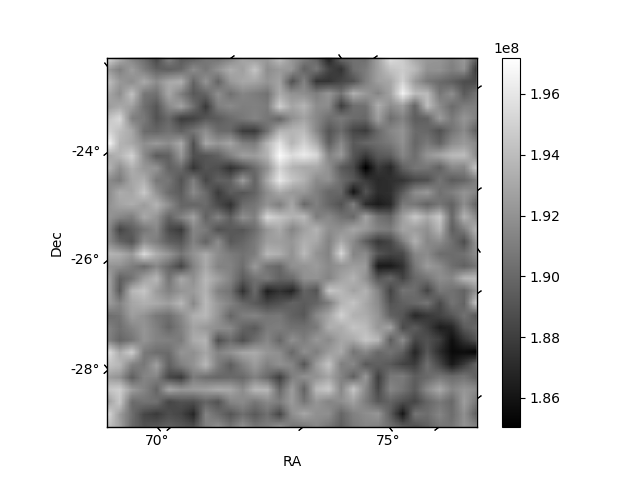
Histogram calculated using DETX and DETY for each event in the final _common_clean file
| Quadrant A | 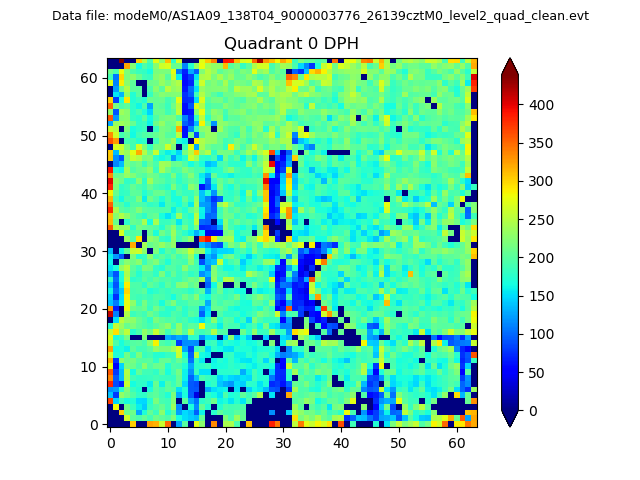 |
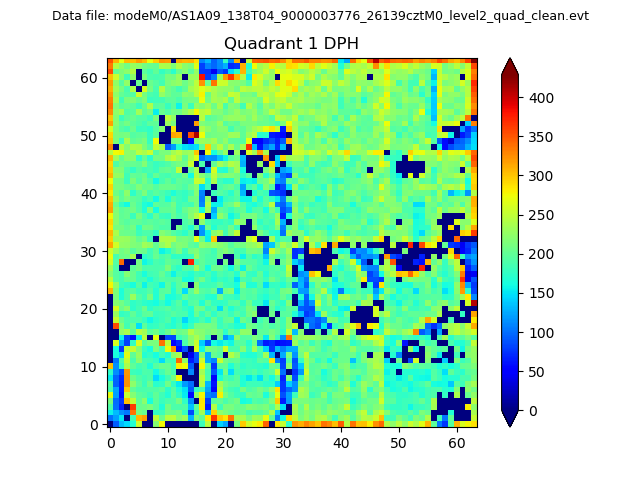 |
Quadrant B |
|---|---|---|---|
| Quadrant D | 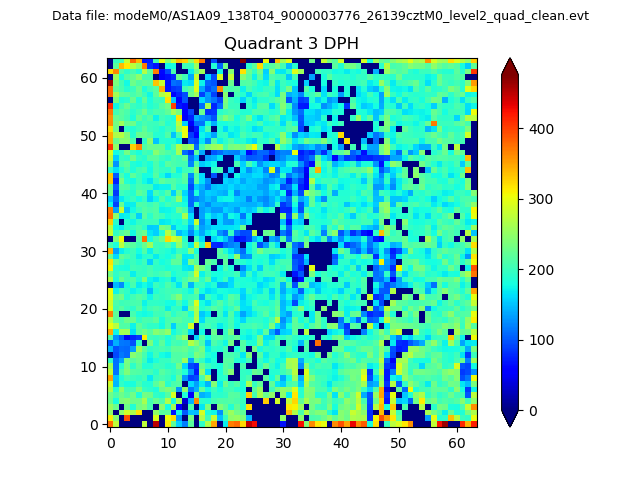 |
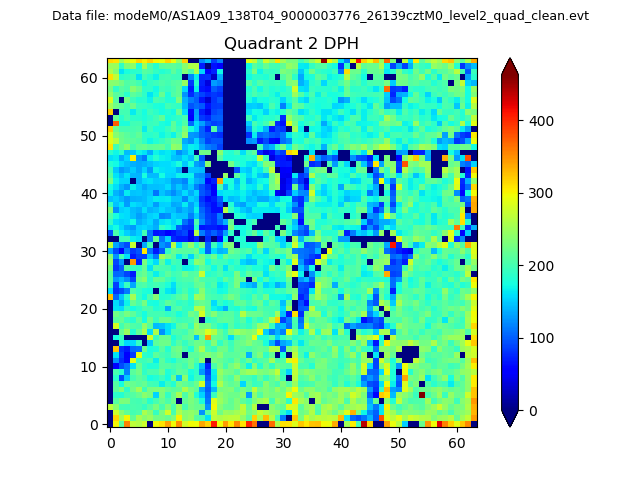 |
Quadrant C |
| Plot type | Count rate plots | Images |
|---|---|---|
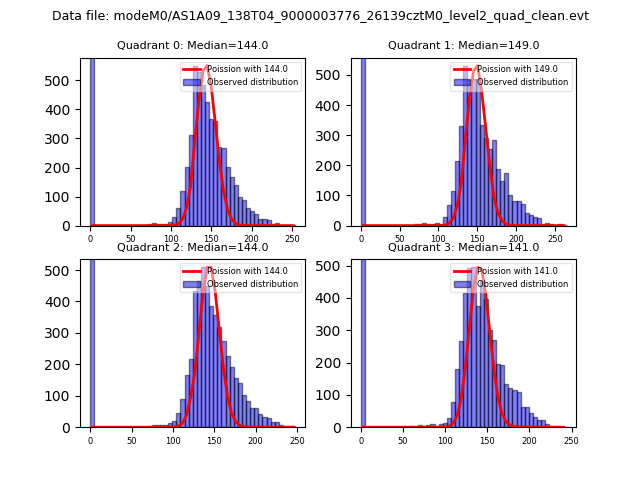
| Comparison with Poisson distribution Blue bars denote a histogram of data divided into 1 sec bins. Red curve is a Poisson curve with rate = median count rate of data. |
 |
 |
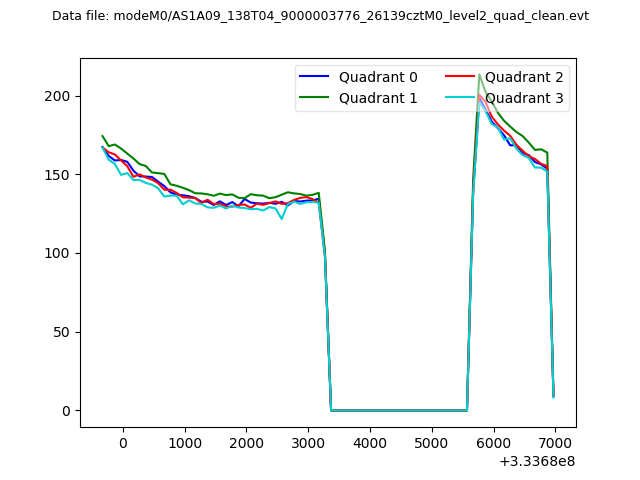
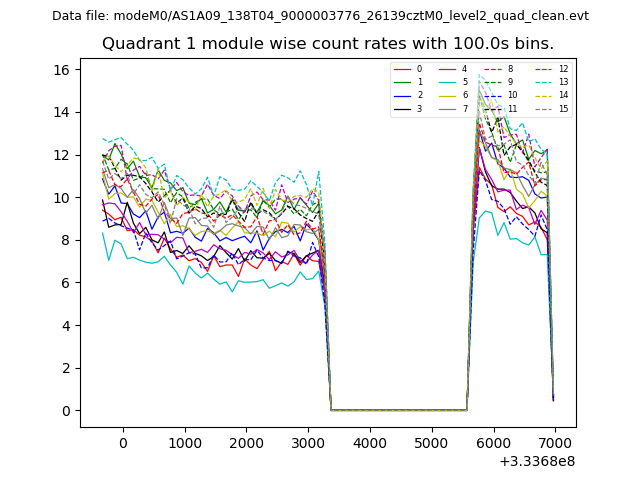
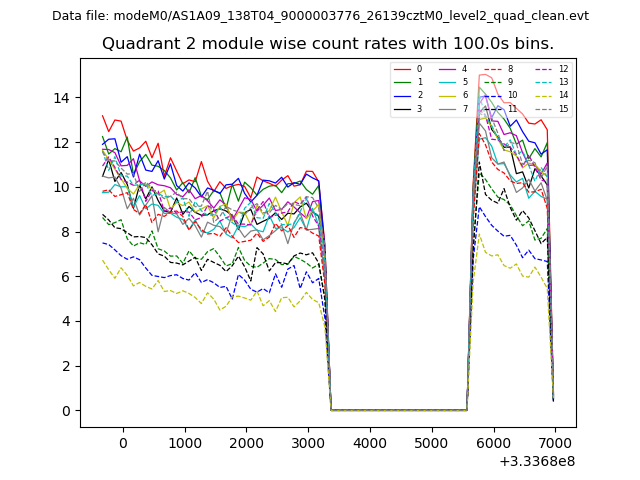
| Quadrant-wise count rates Data is divided into 100 sec bins |
 |
|
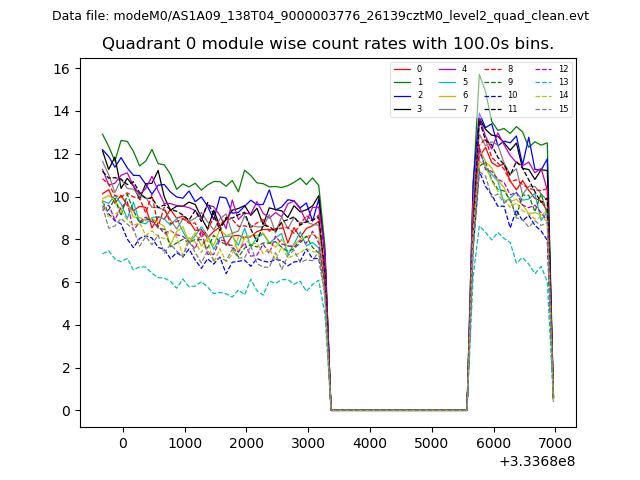
| Module-wise count rates for Quadrant A Data is divided into 100 sec bins |
 |
 |
| Module-wise count rates for Quadrant B Data is divided into 100 sec bins |
 |
 |
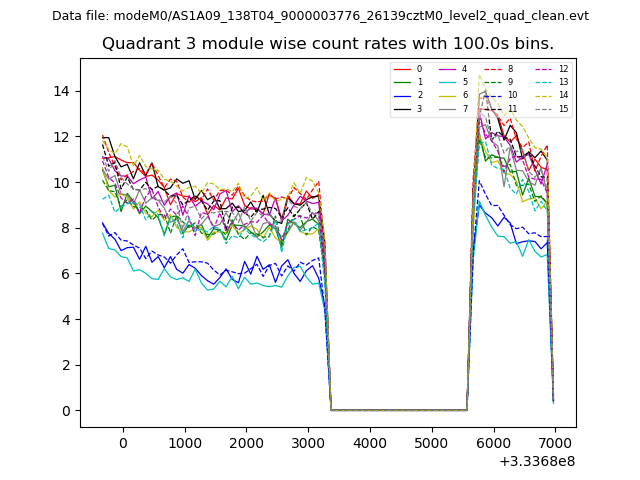
| Module-wise count rates for Quadrant C Data is divided into 100 sec bins |
 |
 |
| Module-wise count rates for Quadrant D Data is divided into 100 sec bins |
 |
 |
| Parameter | Plot |
|---|---|
| CZT HV Monitor | 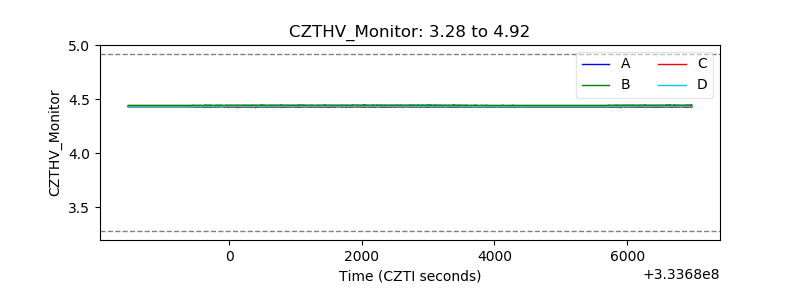 |
| D_VDD | 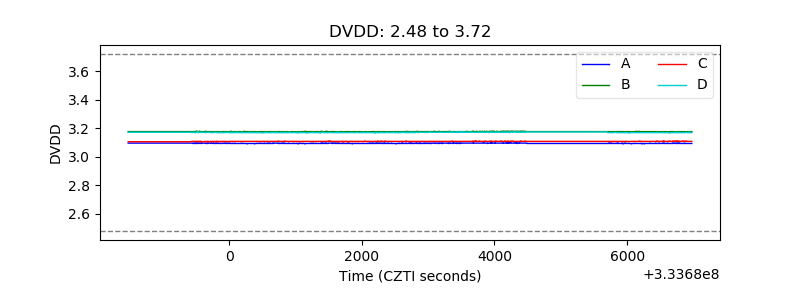 |
| Temperature 1 | 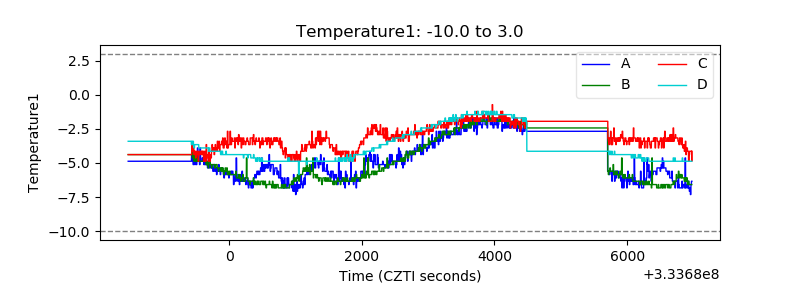 |
| Veto HV Monitor | 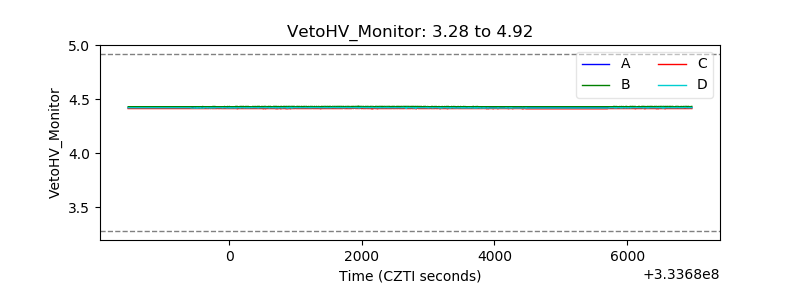 |
| Veto LLD | 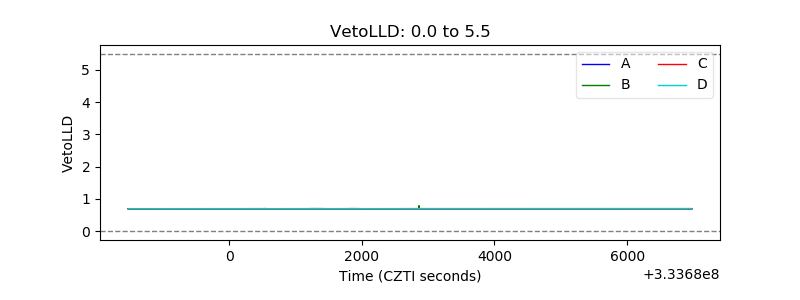 |
| Alpha Counter | 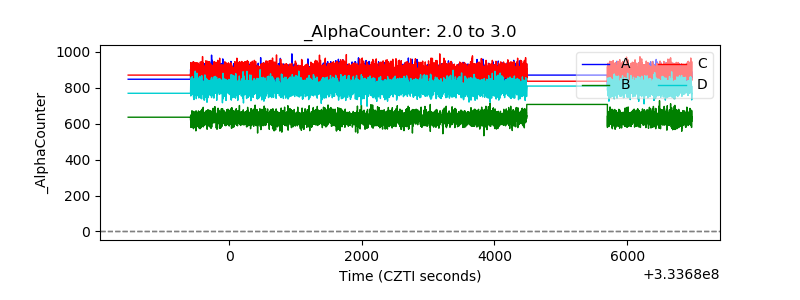 |
| _CPM_Rate | 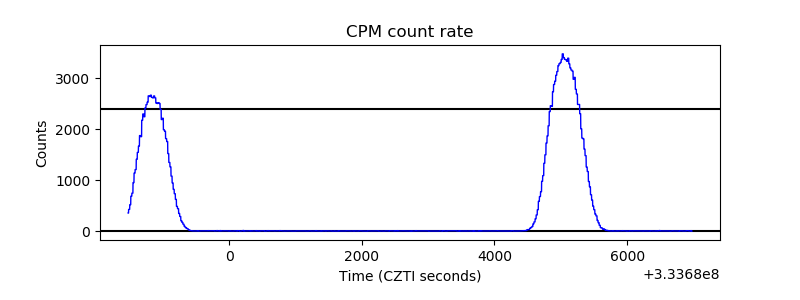 |
| CZT Counter | 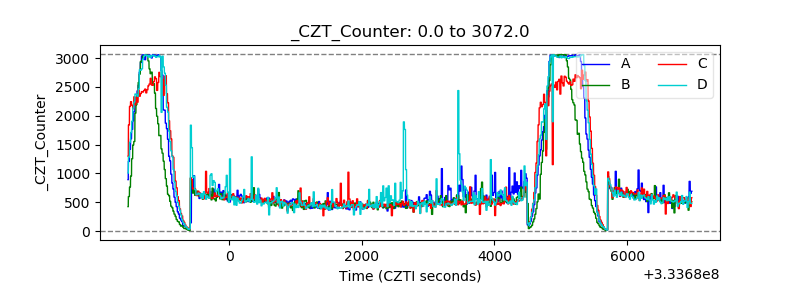 |
| +2.5 Volts monitor | 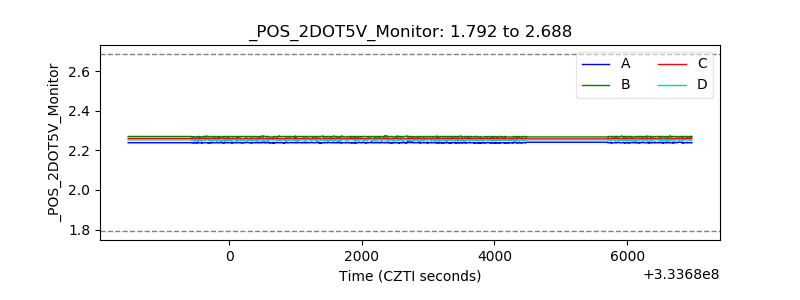 |
| +5 Volts monitor | 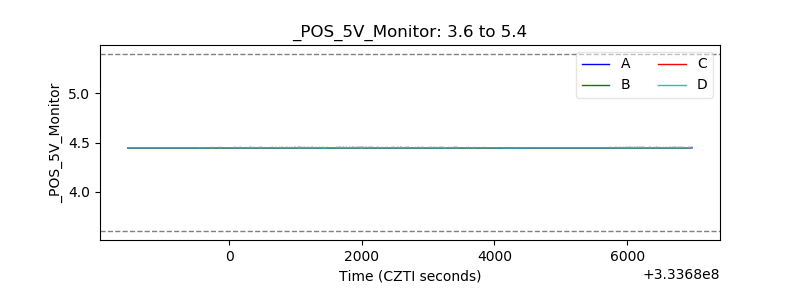 |
| _ROLL_ROT | 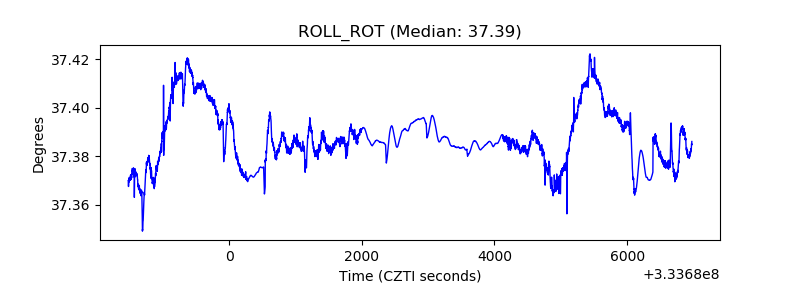 |
| _Roll_DEC | 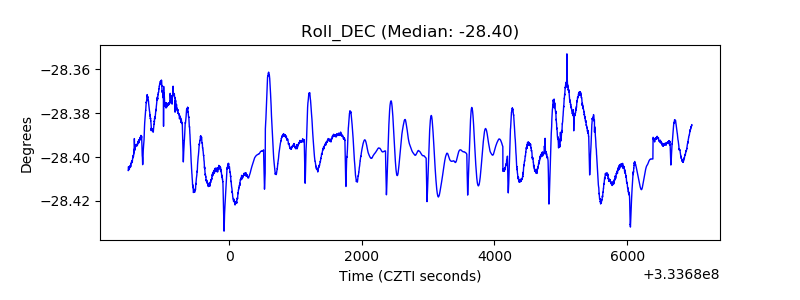 |
| _Roll_RA | 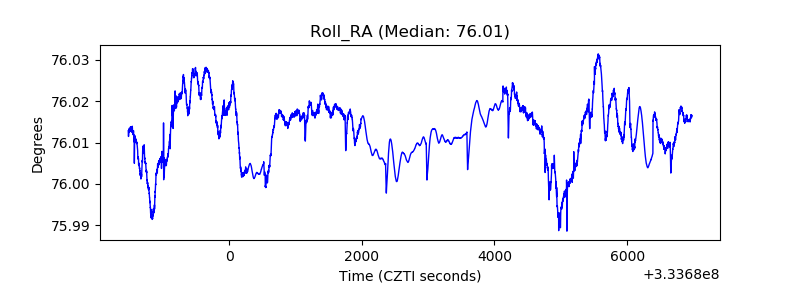 |
| Veto Counter | 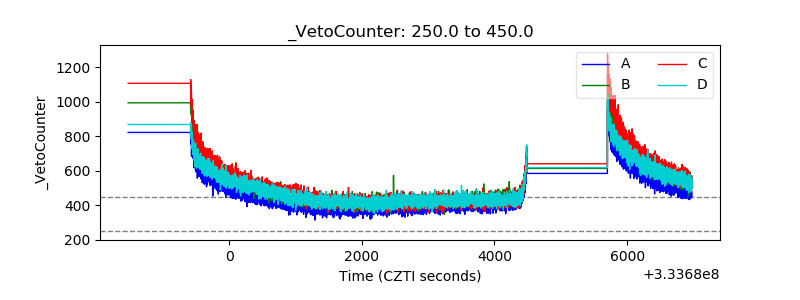 |