| Param | Original file | Final file |
|---|---|---|
| Filename | modeM0/AS1A09_138T04_9000003776_26141cztM0_level2.evt | modeM0/AS1A09_138T04_9000003776_26141cztM0_level2_quad_clean.evt |
| Size (bytes) | 408,337,920 | 93,744,000 |
| Size | 389.4 MB | 89.4 MB |
| Events in quadrant A | 2,985,353 | 610,505 |
| Events in quadrant B | 2,958,314 | 633,935 |
| Events in quadrant C | 3,010,525 | 608,370 |
| Events in quadrant D | 3,036,105 | 599,049 |
| Mode M9 | |||
|---|---|---|---|
| Quadrant | BADHDUFLAG | Total packets | Discarded packets |
| A | 0 | 14 | 0 |
| B | 0 | 14 | 0 |
| C | 0 | 14 | 0 |
| D | 0 | 14 | 0 |
| Mode M0 | |||
|---|---|---|---|
| Quadrant | BADHDUFLAG | Total packets | Discarded packets |
| A | 0 | 12058 | 0 |
| B | 0 | 12028 | 0 |
| C | 0 | 12205 | 0 |
| D | 0 | 12253 | 0 |
| Quadrant | Total seconds | Saturated seconds | Saturation percentage |
|---|---|---|---|
| A | 5535 | 31 | 0.560072% |
| B | 5536 | 58 | 1.047688% |
| C | 5536 | 92 | 1.661850% |
| D | 5536 | 66 | 1.192197% |
Noise dominated data is calculated using 1-second bins in cleaned event files. If a bin has >2000 counts, and if more than 50% of those come from <1% of pixels, then it is considered to be noise-dominated and hence unusable.
| Quadrant | # 1 sec bins | Bins with >0 counts | Bins with >2000 counts | High rate bins dominated by noise | Noise dominated (total time) | Noise dominated (detector-on time) | Marked lightcurve |
|---|---|---|---|---|---|---|---|
| A | 6910 | 5536 | 0 | 0 | 0.00% | 0.00% | 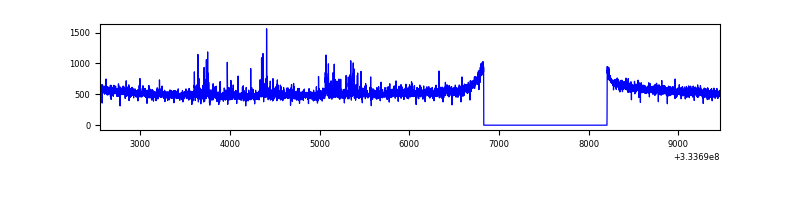 |
| B | 6911 | 5536 | 0 | 0 | 0.00% | 0.00% | 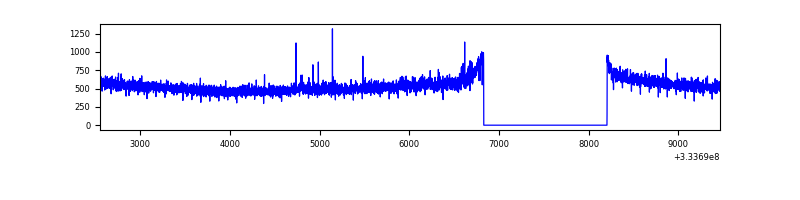 |
| C | 6911 | 5536 | 0 | 0 | 0.00% | 0.00% | 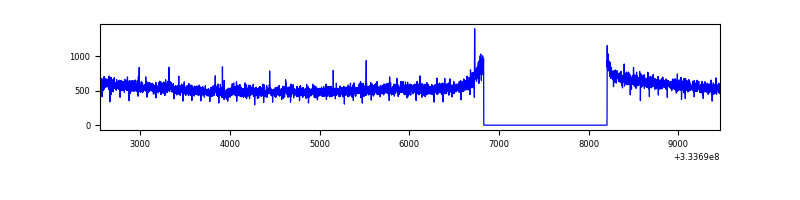 |
| D | 6911 | 5536 | 38 | 38 | 0.55% | 0.69% | 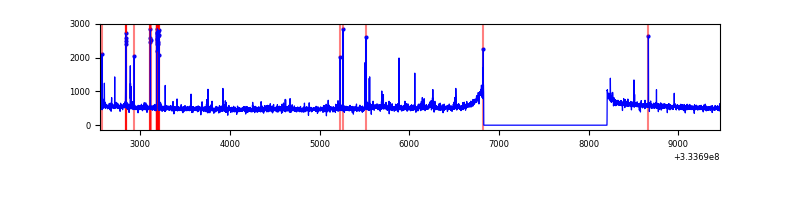 |
Top three noisy pixels from each quadrant. If the there are fewer than three noisy pixels in the level2.evt file, extra rows are filled as -1
| Pixel properties | Quadrant properties | ||||||
|---|---|---|---|---|---|---|---|
| Quadrant | DetID | PixID | Counts | Sigma | Mean | Median | Sigma |
| A | 0 | 13 | 90612 | 604.22 | 751 | 738 | 148.7 |
| A | 13 | 254 | 8476 | 52.02 | 751 | 738 | 148.7 |
| A | 0 | 226 | 6557 | 39.12 | 751 | 738 | 148.7 |
| B | 0 | 230 | 20129 | 138.7 | 748 | 732 | 139.9 |
| B | 12 | 111 | 16076 | 109.72 | 748 | 732 | 139.9 |
| B | 11 | 111 | 14500 | 98.45 | 748 | 732 | 139.9 |
| C | 14 | 238 | 119341 | 690.65 | 738 | 747 | 171.7 |
| C | 3 | 233 | 11561 | 62.98 | 738 | 747 | 171.7 |
| C | 13 | 61 | 4992 | 24.72 | 738 | 747 | 171.7 |
| D | 1 | 52 | 177078 | 1005.91 | 748 | 732 | 175.3 |
| D | 2 | 234 | 22275 | 122.89 | 748 | 732 | 175.3 |
| D | 12 | 233 | 21191 | 116.7 | 748 | 732 | 175.3 |
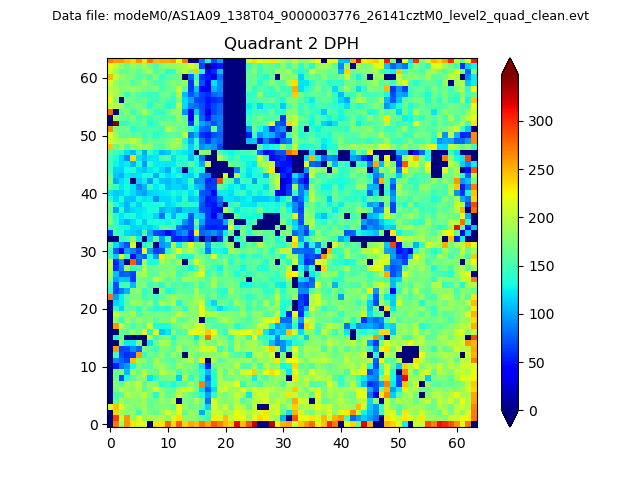
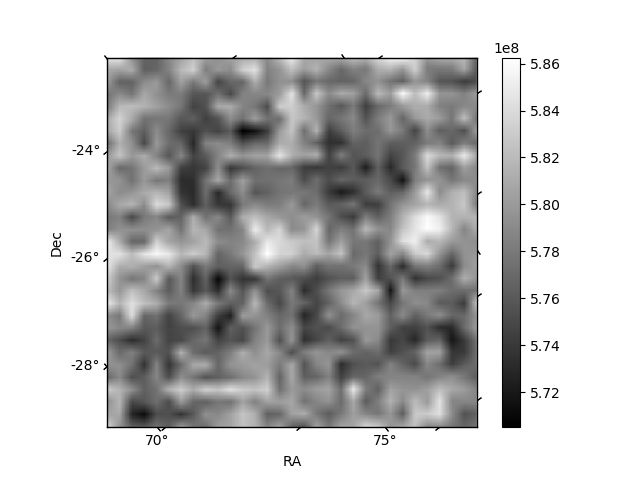
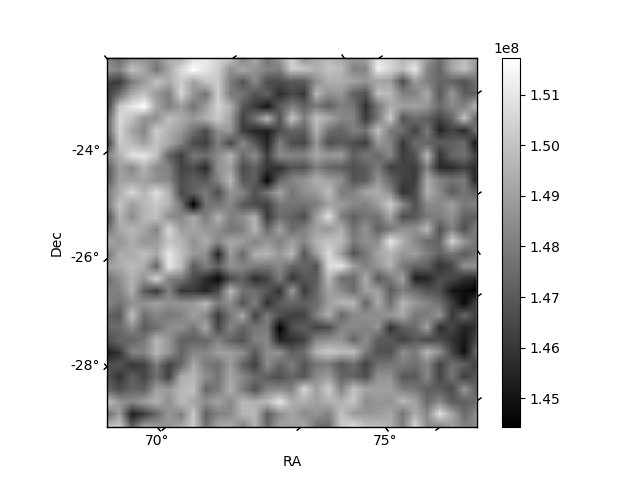
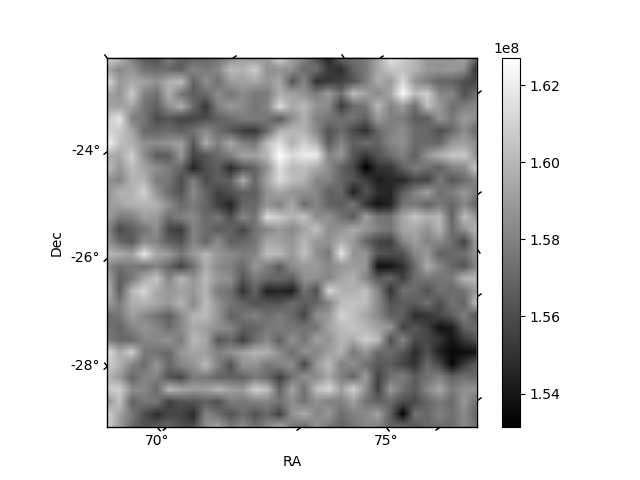
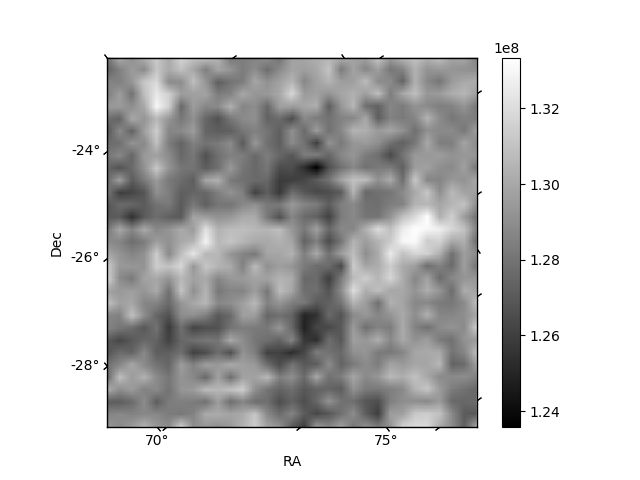
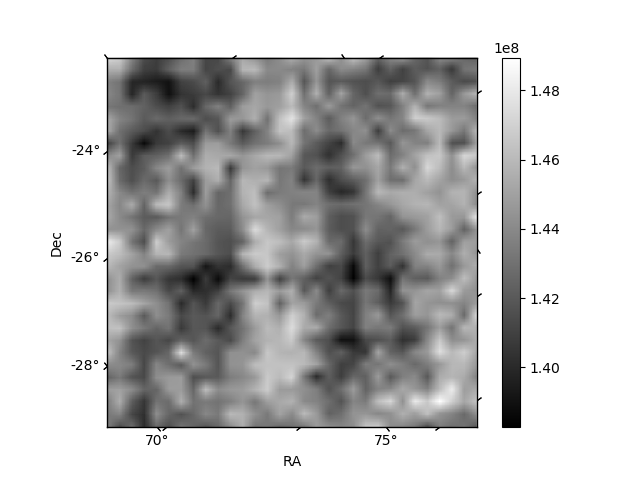
Histogram calculated using DETX and DETY for each event in the final _common_clean file
| Quadrant A | 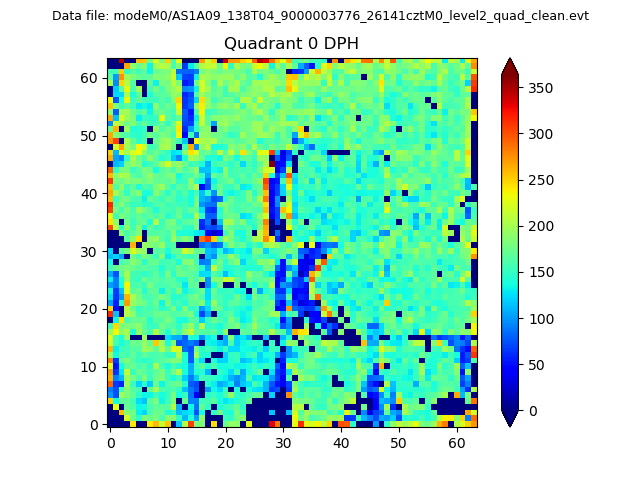 |
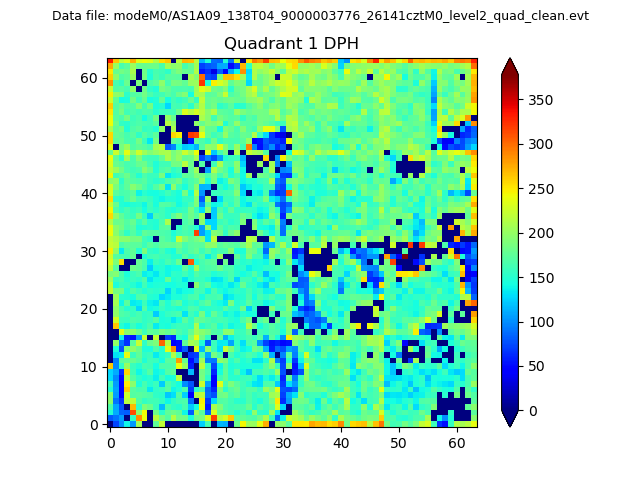 |
Quadrant B |
|---|---|---|---|
| Quadrant D | 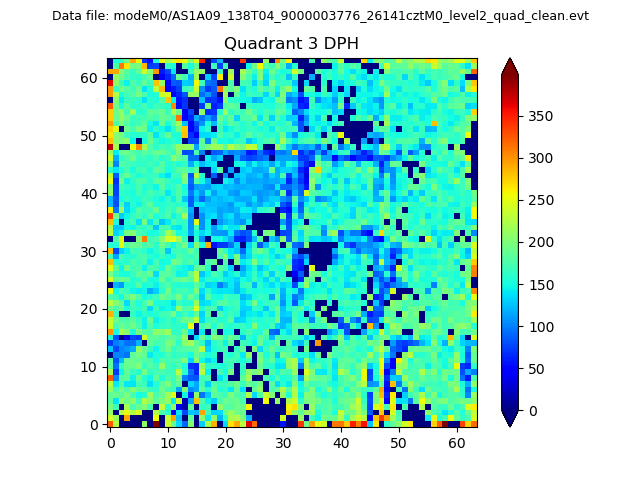 |
 |
Quadrant C |
| Plot type | Count rate plots | Images |
|---|---|---|
| Comparison with Poisson distribution Blue bars denote a histogram of data divided into 1 sec bins. Red curve is a Poisson curve with rate = median count rate of data. |
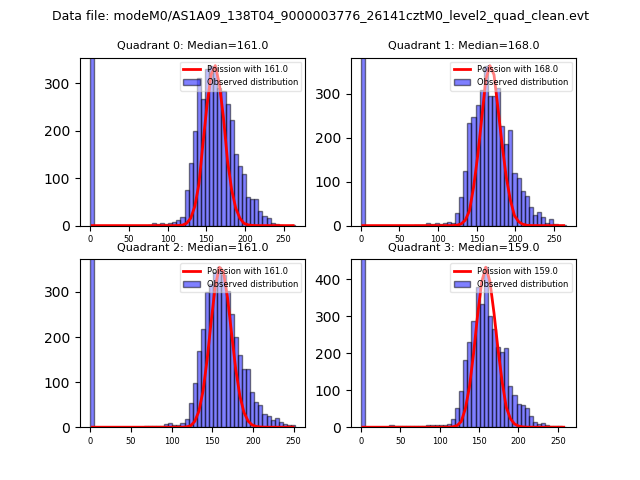 |
 |
| Quadrant-wise count rates Data is divided into 100 sec bins |
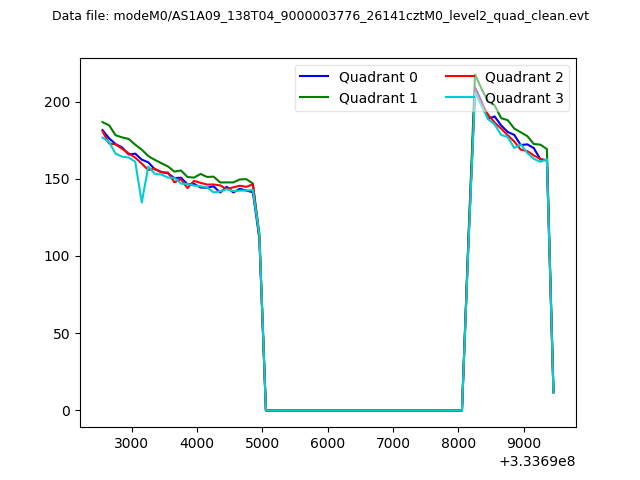 |
|
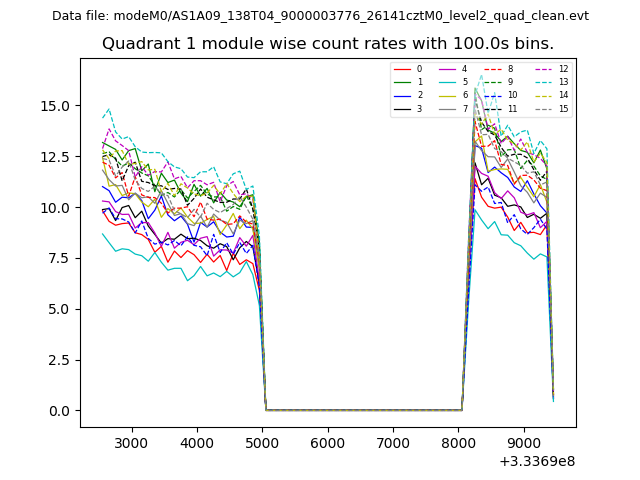
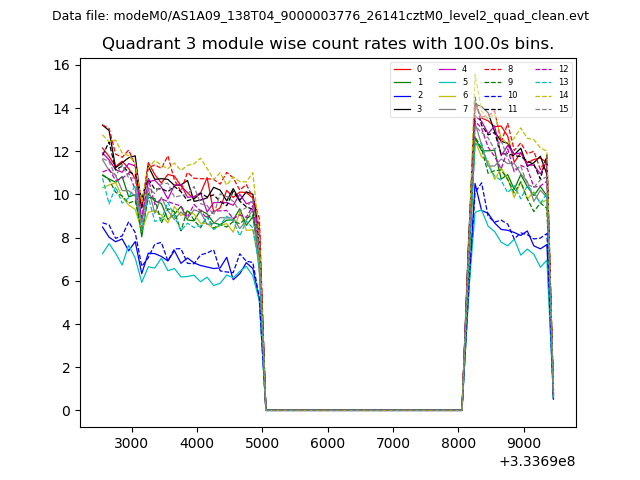
| Module-wise count rates for Quadrant A Data is divided into 100 sec bins |
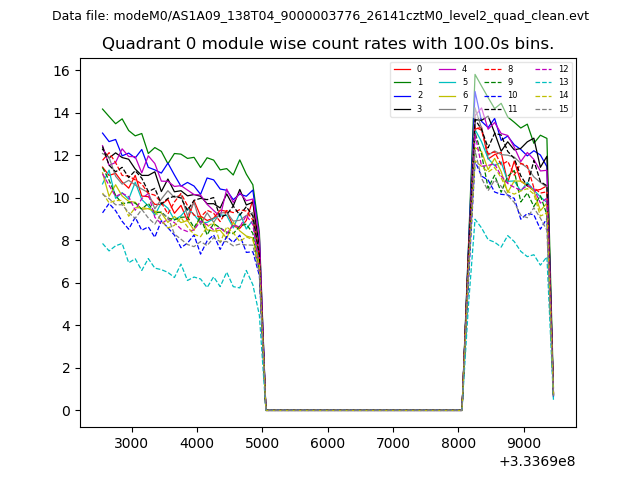 |
 |
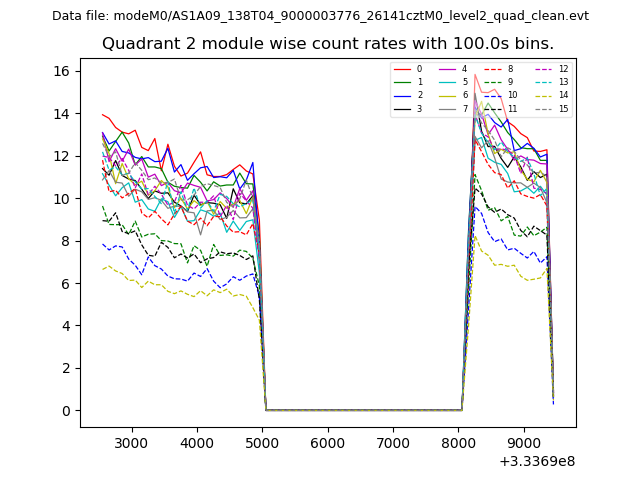
| Module-wise count rates for Quadrant B Data is divided into 100 sec bins |
 |
 |
| Module-wise count rates for Quadrant C Data is divided into 100 sec bins |
 |
 |
| Module-wise count rates for Quadrant D Data is divided into 100 sec bins |
 |
 |
| Parameter | Plot |
|---|---|
| CZT HV Monitor | 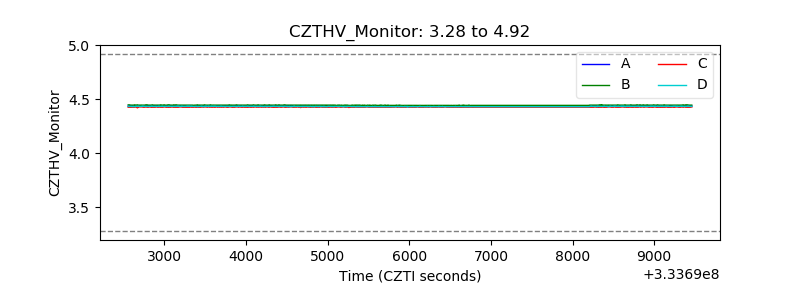 |
| D_VDD | 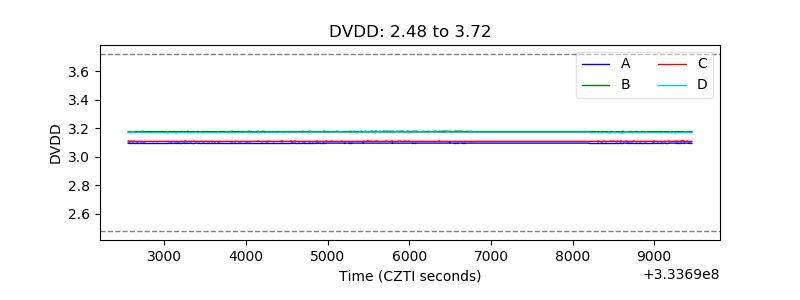 |
| Temperature 1 | 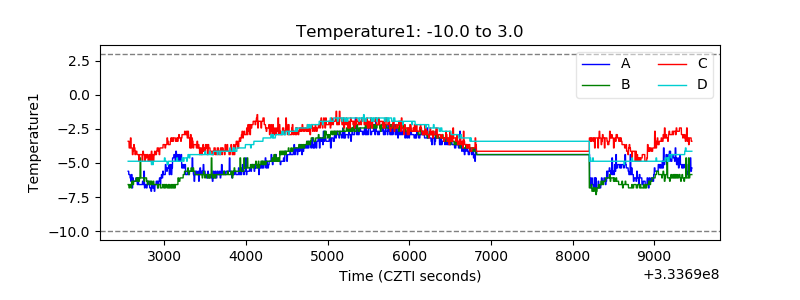 |
| Veto HV Monitor | 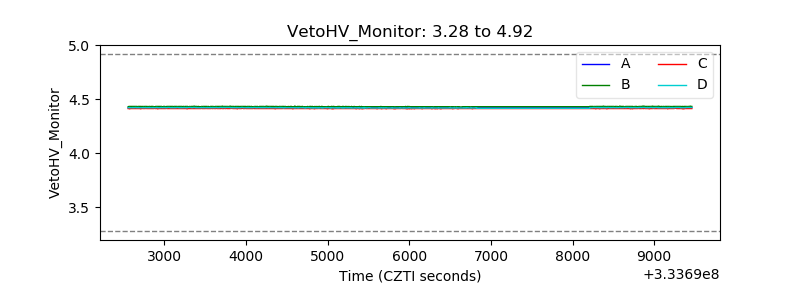 |
| Veto LLD | 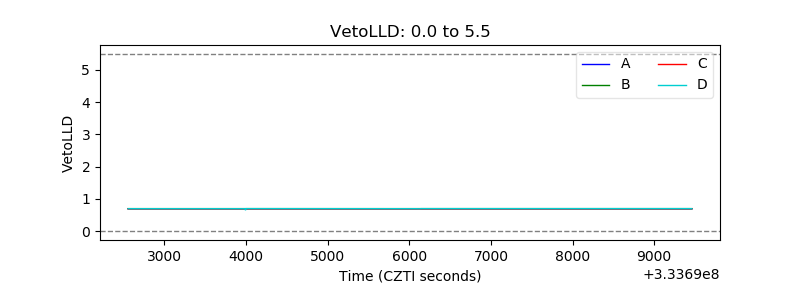 |
| Alpha Counter | 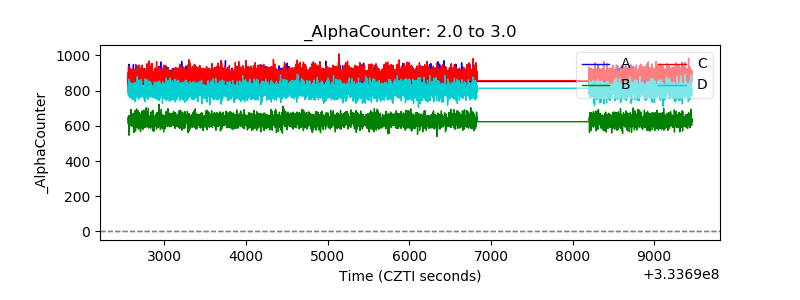 |
| _CPM_Rate | 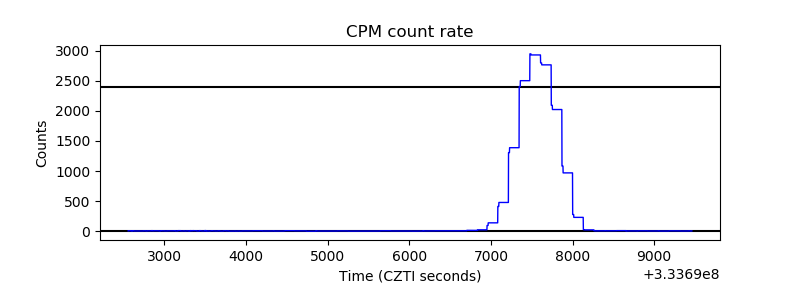 |
| CZT Counter | 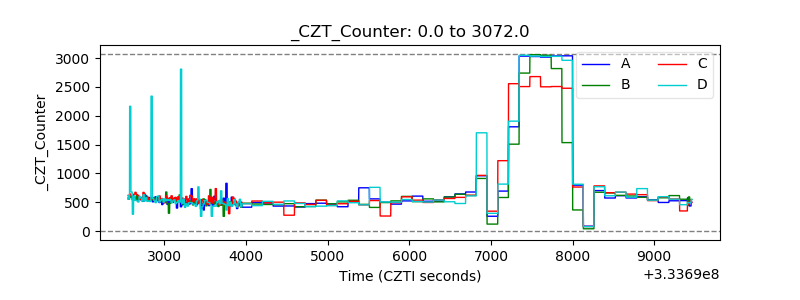 |
| +2.5 Volts monitor |  |
| +5 Volts monitor |  |
| _ROLL_ROT | 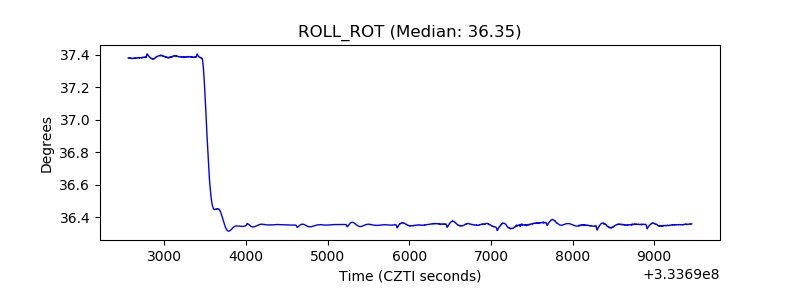 |
| _Roll_DEC | 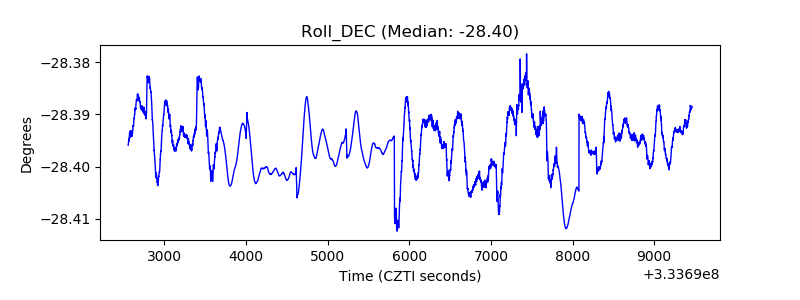 |
| _Roll_RA | 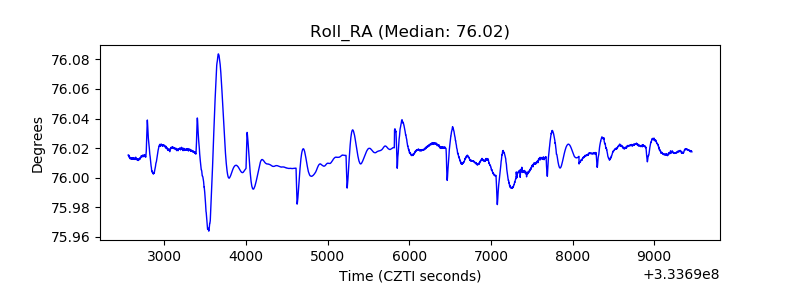 |
| Veto Counter |  |