| Param | Original file | Final file |
|---|---|---|
| Filename | modeM0/AS1A09_138T04_9000003776_26142cztM0_level2.evt | modeM0/AS1A09_138T04_9000003776_26142cztM0_level2_quad_clean.evt |
| Size (bytes) | 460,618,560 | 103,066,560 |
| Size | 439.3 MB | 98.3 MB |
| Events in quadrant A | 3,326,326 | 670,986 |
| Events in quadrant B | 3,374,425 | 694,457 |
| Events in quadrant C | 3,426,666 | 661,804 |
| Events in quadrant D | 3,400,277 | 660,209 |
| Mode M9 | |||
|---|---|---|---|
| Quadrant | BADHDUFLAG | Total packets | Discarded packets |
| A | 0 | 14 | 0 |
| B | 0 | 15 | 0 |
| C | 0 | 15 | 0 |
| D | 0 | 15 | 0 |
| Mode M0 | |||
|---|---|---|---|
| Quadrant | BADHDUFLAG | Total packets | Discarded packets |
| A | 0 | 13519 | 0 |
| B | 0 | 13707 | 0 |
| C | 0 | 13925 | 0 |
| D | 0 | 13769 | 0 |
| Quadrant | Total seconds | Saturated seconds | Saturation percentage |
|---|---|---|---|
| A | 6219 | 27 | 0.434153% |
| B | 6219 | 69 | 1.109503% |
| C | 6219 | 107 | 1.720534% |
| D | 6219 | 47 | 0.755749% |
Noise dominated data is calculated using 1-second bins in cleaned event files. If a bin has >2000 counts, and if more than 50% of those come from <1% of pixels, then it is considered to be noise-dominated and hence unusable.
| Quadrant | # 1 sec bins | Bins with >0 counts | Bins with >2000 counts | High rate bins dominated by noise | Noise dominated (total time) | Noise dominated (detector-on time) | Marked lightcurve |
|---|---|---|---|---|---|---|---|
| A | 7604 | 6220 | 0 | 0 | 0.00% | 0.00% | 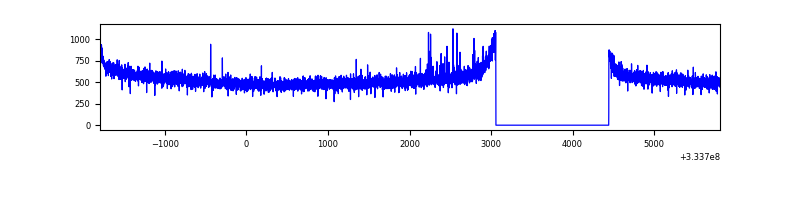 |
| B | 7604 | 6220 | 0 | 0 | 0.00% | 0.00% | 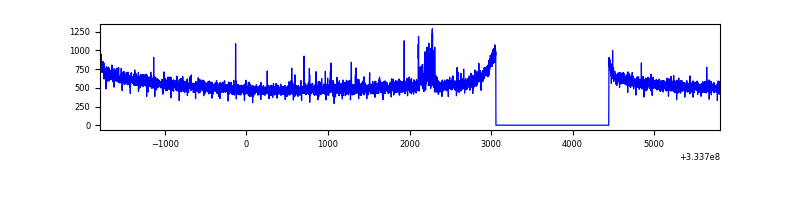 |
| C | 7604 | 6219 | 2 | 2 | 0.03% | 0.03% | 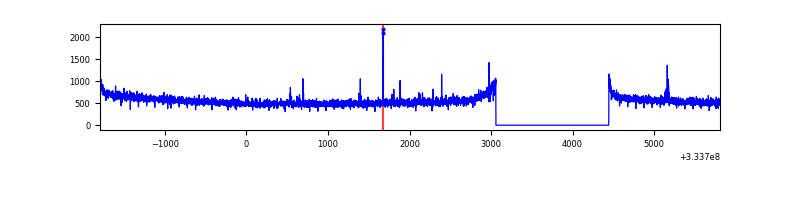 |
| D | 7604 | 6220 | 27 | 27 | 0.36% | 0.43% | 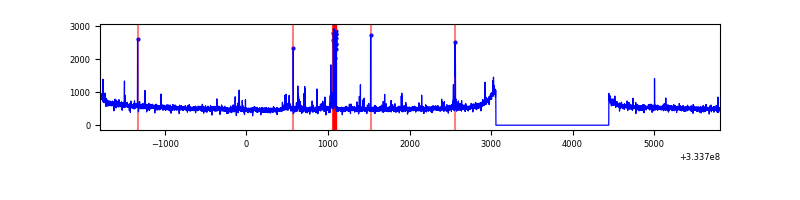 |
Top three noisy pixels from each quadrant. If the there are fewer than three noisy pixels in the level2.evt file, extra rows are filled as -1
| Pixel properties | Quadrant properties | ||||||
|---|---|---|---|---|---|---|---|
| Quadrant | DetID | PixID | Counts | Sigma | Mean | Median | Sigma |
| A | 0 | 13 | 26898 | 154.53 | 855 | 841 | 168.6 |
| A | 13 | 254 | 9440 | 51.0 | 855 | 841 | 168.6 |
| A | 0 | 226 | 7367 | 38.7 | 855 | 841 | 168.6 |
| B | 0 | 190 | 42897 | 264.85 | 849 | 830 | 158.8 |
| B | 12 | 111 | 18230 | 109.55 | 849 | 830 | 158.8 |
| B | 11 | 111 | 16480 | 98.53 | 849 | 830 | 158.8 |
| C | 14 | 238 | 133588 | 687.0 | 833 | 844 | 193.2 |
| C | 3 | 233 | 20130 | 99.81 | 833 | 844 | 193.2 |
| C | 2 | 16 | 16470 | 80.87 | 833 | 844 | 193.2 |
| D | 1 | 52 | 166156 | 828.67 | 848 | 829 | 199.5 |
| D | 2 | 234 | 22735 | 109.8 | 848 | 829 | 199.5 |
| D | 14 | 35 | 14450 | 68.27 | 848 | 829 | 199.5 |
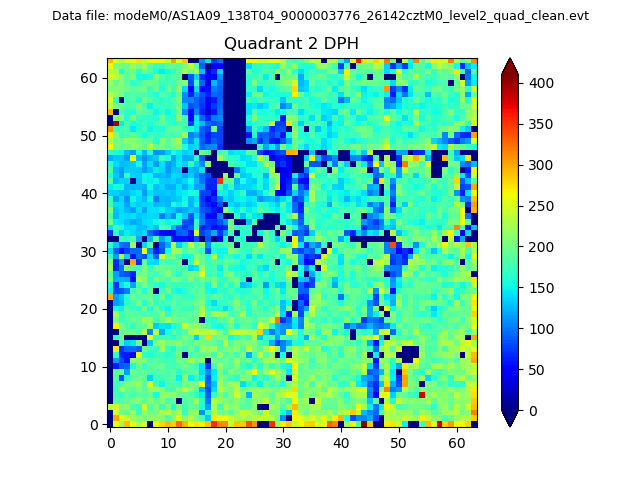
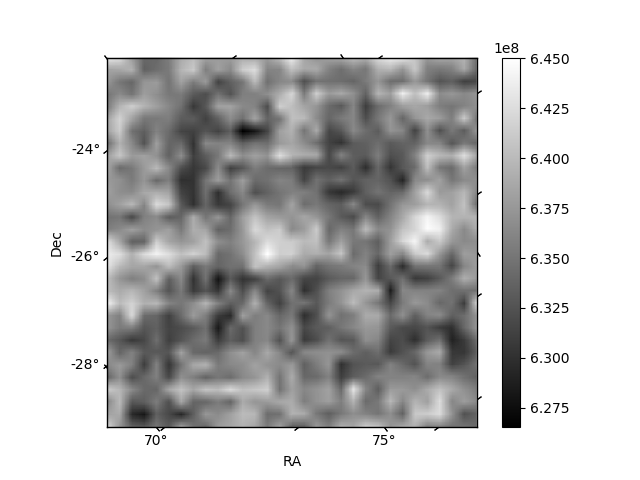
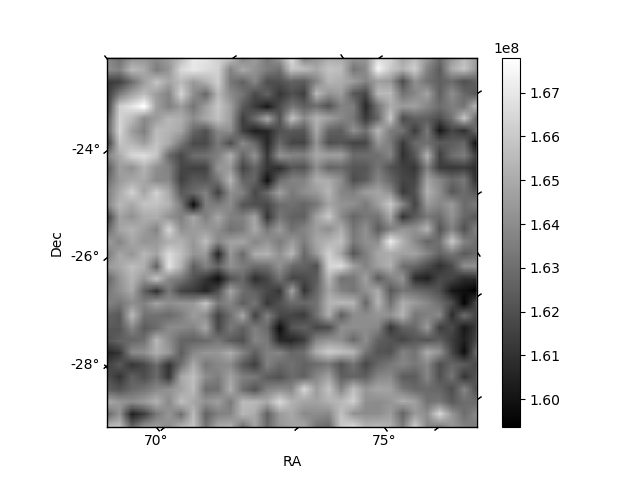
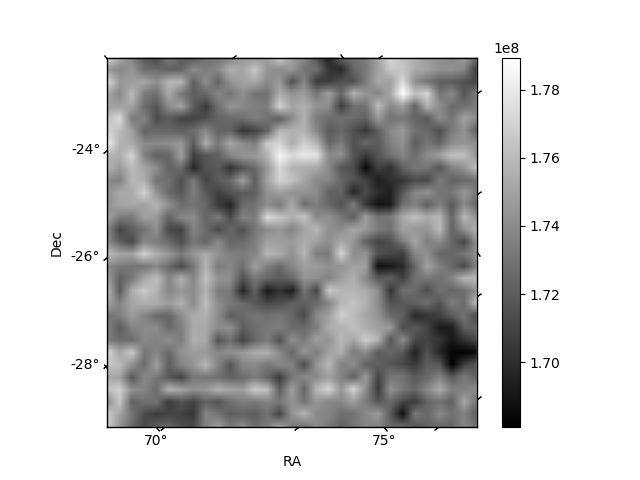
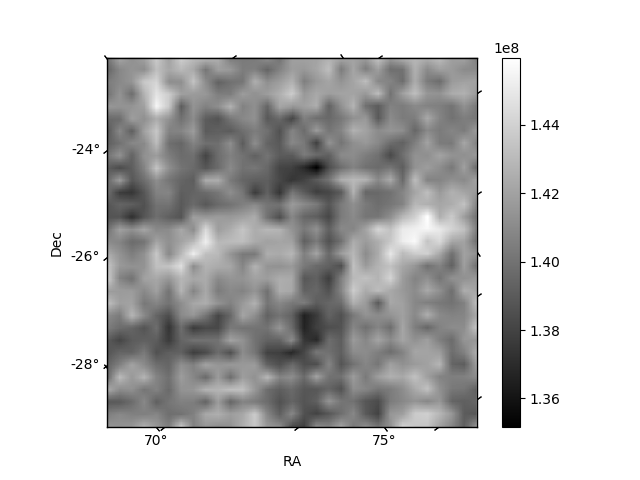
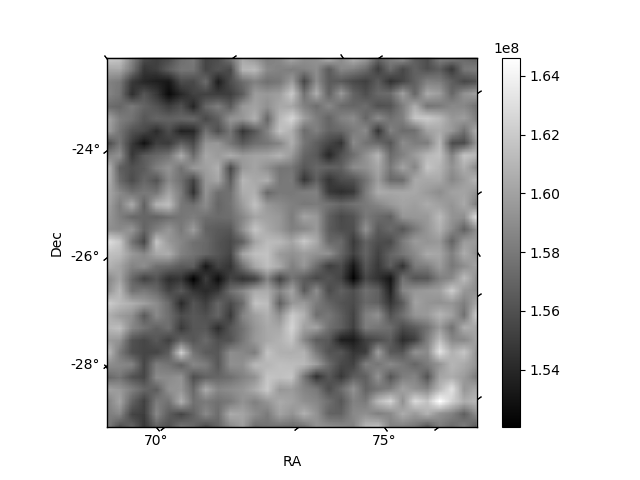
Histogram calculated using DETX and DETY for each event in the final _common_clean file
| Quadrant A | 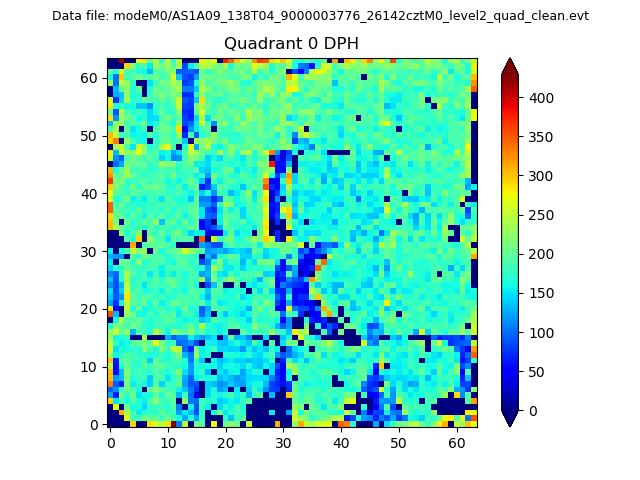 |
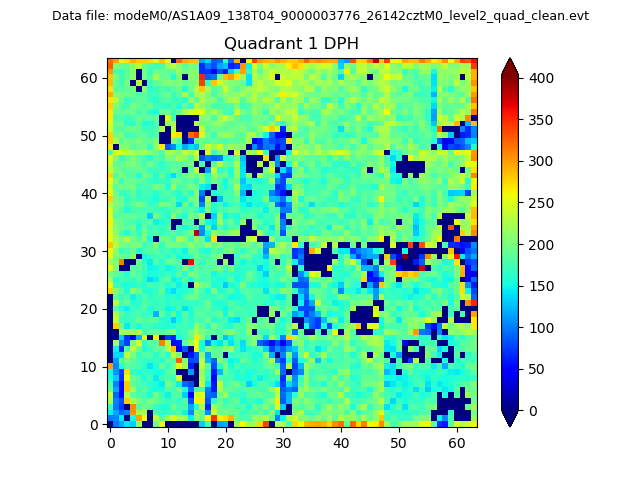 |
Quadrant B |
|---|---|---|---|
| Quadrant D | 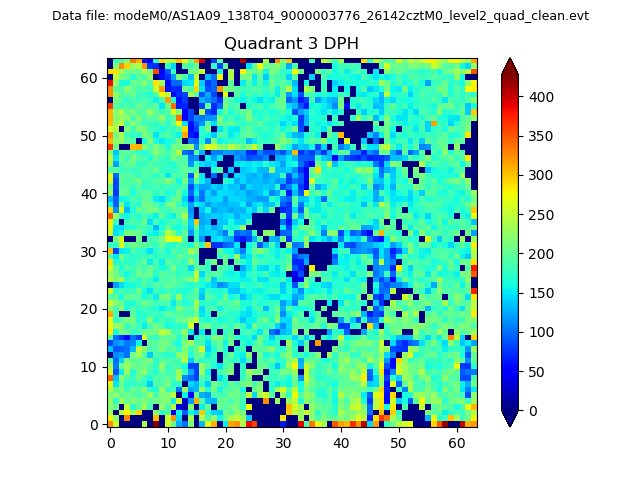 |
 |
Quadrant C |
| Plot type | Count rate plots | Images |
|---|---|---|
| Comparison with Poisson distribution Blue bars denote a histogram of data divided into 1 sec bins. Red curve is a Poisson curve with rate = median count rate of data. |
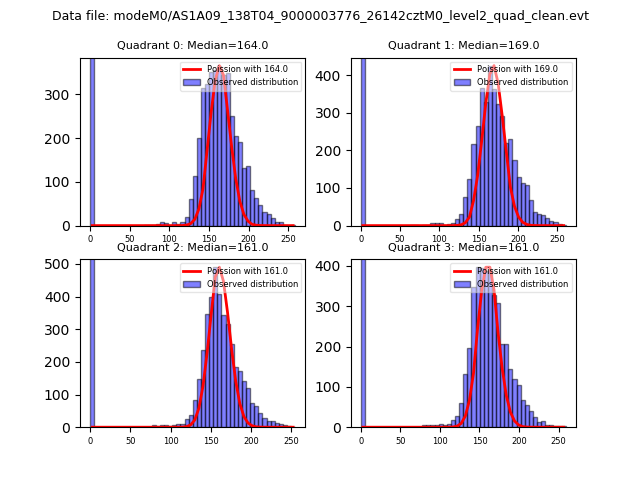 |
 |
| Quadrant-wise count rates Data is divided into 100 sec bins |
 |
|
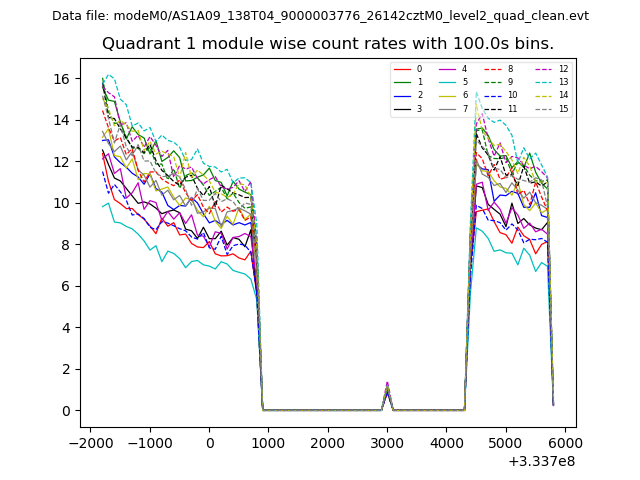
| Module-wise count rates for Quadrant A Data is divided into 100 sec bins |
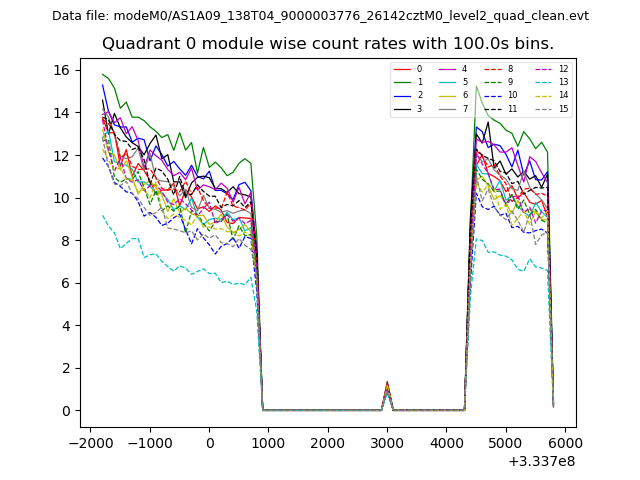 |
 |
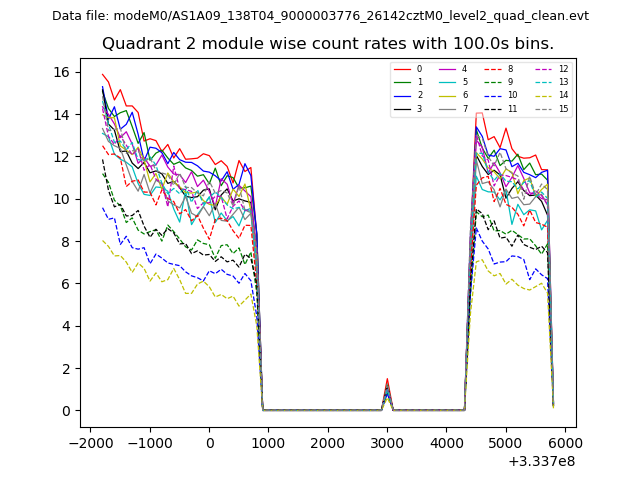
| Module-wise count rates for Quadrant B Data is divided into 100 sec bins |
 |
 |
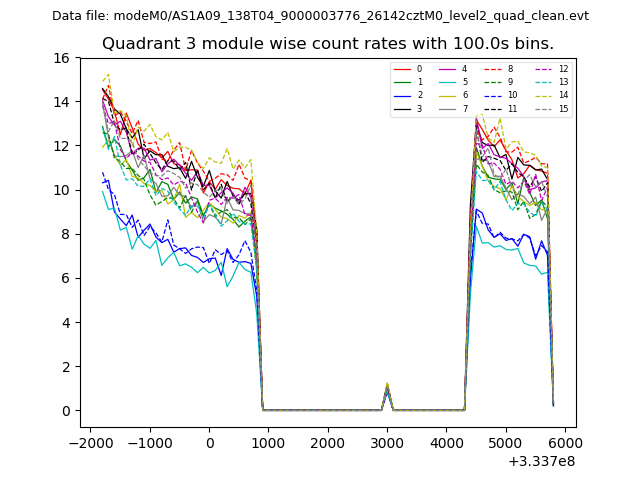
| Module-wise count rates for Quadrant C Data is divided into 100 sec bins |
 |
 |
| Module-wise count rates for Quadrant D Data is divided into 100 sec bins |
 |
 |
| Parameter | Plot |
|---|---|
| CZT HV Monitor | 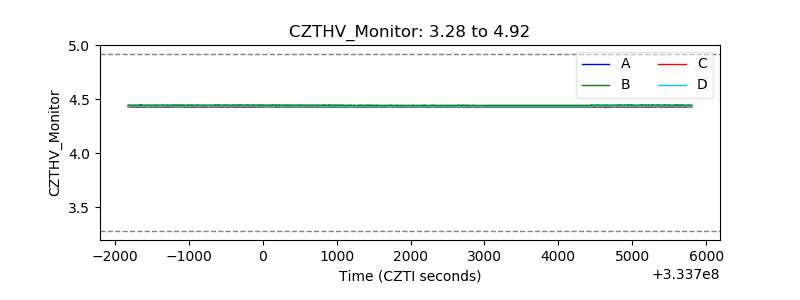 |
| D_VDD | 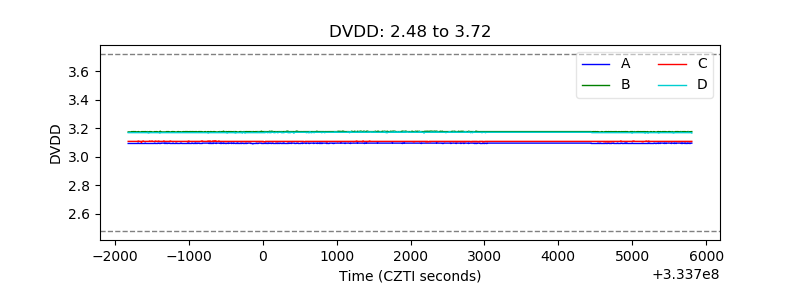 |
| Temperature 1 | 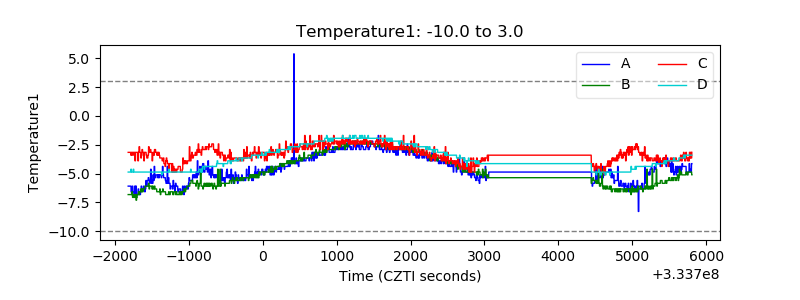 |
| Veto HV Monitor |  |
| Veto LLD | 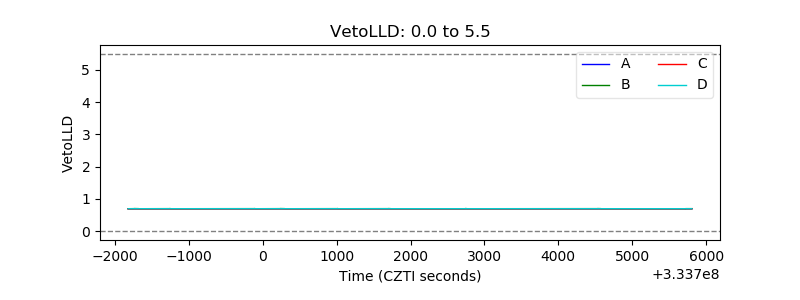 |
| Alpha Counter | 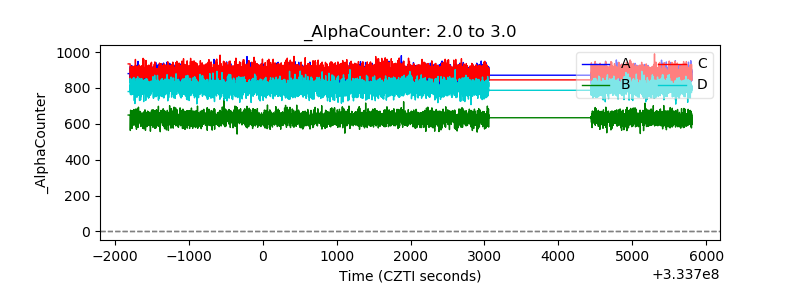 |
| _CPM_Rate | 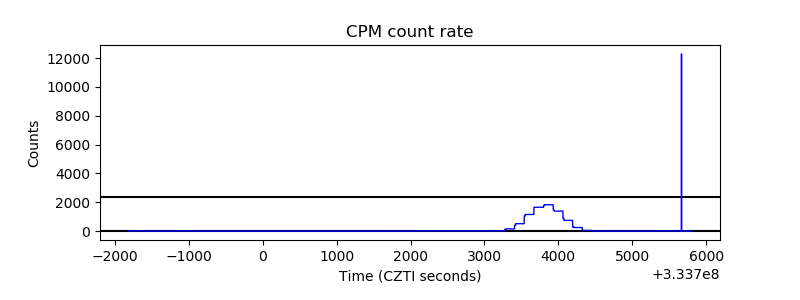 |
| CZT Counter | 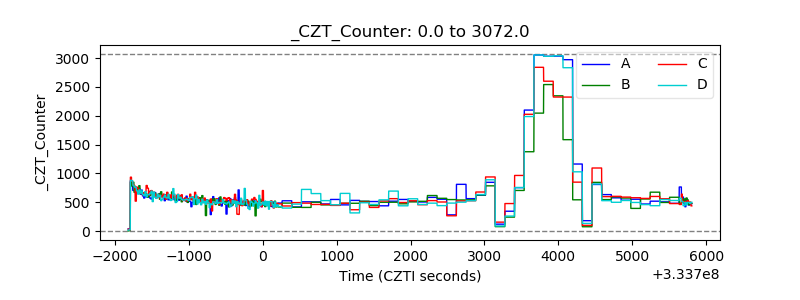 |
| +2.5 Volts monitor | 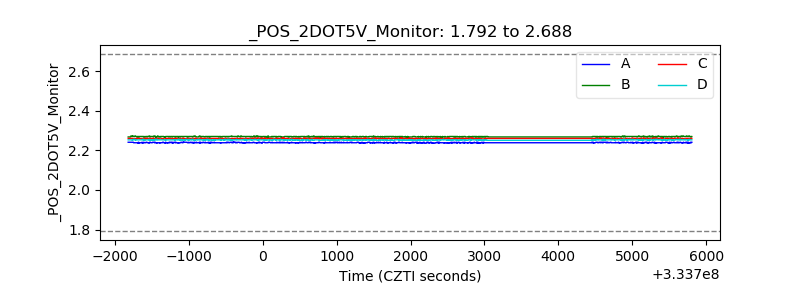 |
| +5 Volts monitor |  |
| _ROLL_ROT | 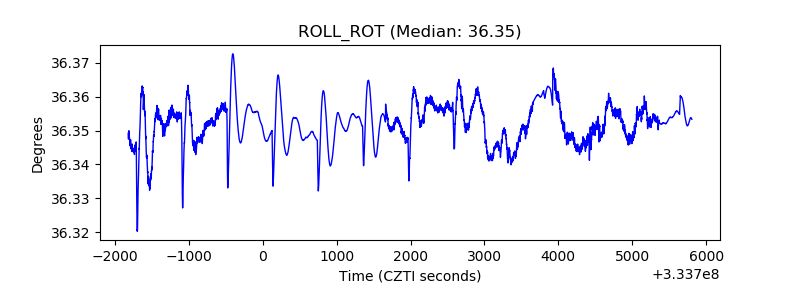 |
| _Roll_DEC | 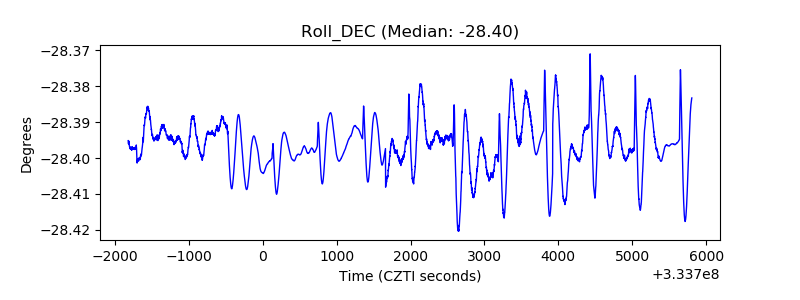 |
| _Roll_RA | 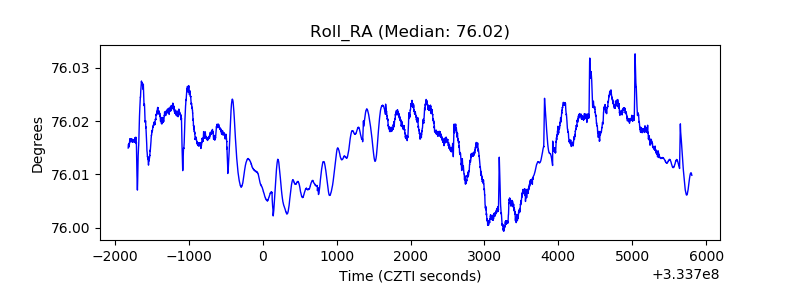 |
| Veto Counter | 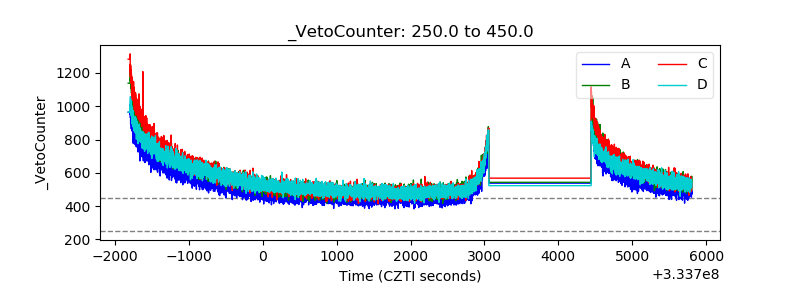 |