| Param | Original file | Final file |
|---|---|---|
| Filename | modeM0/AS1A09_138T04_9000003776_26143cztM0_level2.evt | modeM0/AS1A09_138T04_9000003776_26143cztM0_level2_quad_clean.evt |
| Size (bytes) | 478,123,200 | 105,828,480 |
| Size | 456.0 MB | 100.9 MB |
| Events in quadrant A | 3,488,942 | 690,303 |
| Events in quadrant B | 3,472,488 | 707,835 |
| Events in quadrant C | 3,488,348 | 671,018 |
| Events in quadrant D | 3,577,336 | 670,997 |
| Mode M9 | |||
|---|---|---|---|
| Quadrant | BADHDUFLAG | Total packets | Discarded packets |
| A | 0 | 12 | 0 |
| B | 0 | 12 | 0 |
| C | 0 | 12 | 0 |
| D | 0 | 12 | 0 |
| Mode M0 | |||
|---|---|---|---|
| Quadrant | BADHDUFLAG | Total packets | Discarded packets |
| A | 0 | 14246 | 0 |
| B | 0 | 14196 | 0 |
| C | 0 | 14330 | 0 |
| D | 0 | 14569 | 0 |
| Quadrant | Total seconds | Saturated seconds | Saturation percentage |
|---|---|---|---|
| A | 6667 | 82 | 1.229939% |
| B | 6667 | 111 | 1.664917% |
| C | 6668 | 154 | 2.309538% |
| D | 6668 | 90 | 1.349730% |
Noise dominated data is calculated using 1-second bins in cleaned event files. If a bin has >2000 counts, and if more than 50% of those come from <1% of pixels, then it is considered to be noise-dominated and hence unusable.
| Quadrant | # 1 sec bins | Bins with >0 counts | Bins with >2000 counts | High rate bins dominated by noise | Noise dominated (total time) | Noise dominated (detector-on time) | Marked lightcurve |
|---|---|---|---|---|---|---|---|
| A | 7872 | 6667 | 0 | 0 | 0.00% | 0.00% | 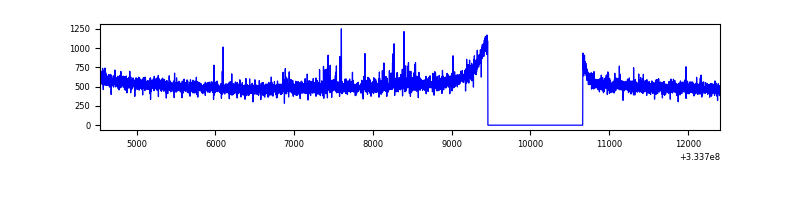 |
| B | 7872 | 6667 | 1 | 1 | 0.01% | 0.01% | 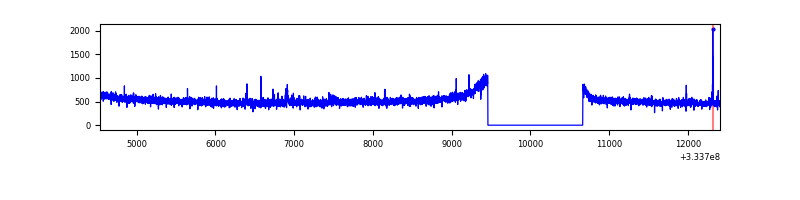 |
| C | 7873 | 6668 | 0 | 0 | 0.00% | 0.00% | 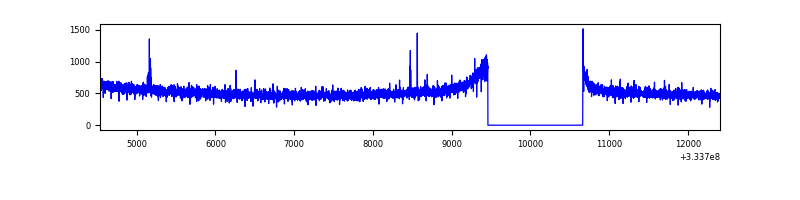 |
| D | 7873 | 6668 | 33 | 33 | 0.42% | 0.49% | 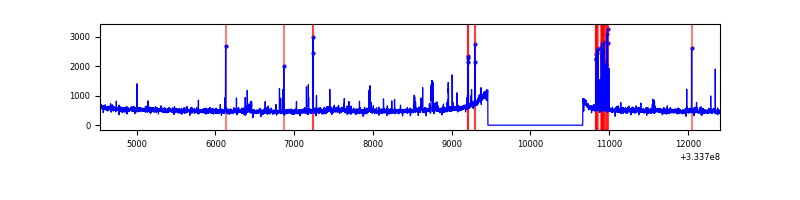 |
Top three noisy pixels from each quadrant. If the there are fewer than three noisy pixels in the level2.evt file, extra rows are filled as -1
| Pixel properties | Quadrant properties | ||||||
|---|---|---|---|---|---|---|---|
| Quadrant | DetID | PixID | Counts | Sigma | Mean | Median | Sigma |
| A | 0 | 13 | 66586 | 373.43 | 888 | 871 | 176.0 |
| A | 13 | 254 | 8836 | 45.26 | 888 | 871 | 176.0 |
| A | 0 | 226 | 7819 | 39.48 | 888 | 871 | 176.0 |
| B | 0 | 230 | 26261 | 153.4 | 875 | 852 | 165.6 |
| B | 12 | 111 | 19446 | 112.26 | 875 | 852 | 165.6 |
| B | 11 | 111 | 17737 | 101.94 | 875 | 852 | 165.6 |
| C | 14 | 238 | 137801 | 687.28 | 852 | 861 | 199.2 |
| C | 3 | 233 | 18540 | 88.73 | 852 | 861 | 199.2 |
| C | 2 | 16 | 9766 | 44.69 | 852 | 861 | 199.2 |
| D | 1 | 52 | 222886 | 1069.19 | 876 | 858 | 207.7 |
| D | 12 | 233 | 28748 | 134.31 | 876 | 858 | 207.7 |
| D | 2 | 234 | 26575 | 123.84 | 876 | 858 | 207.7 |
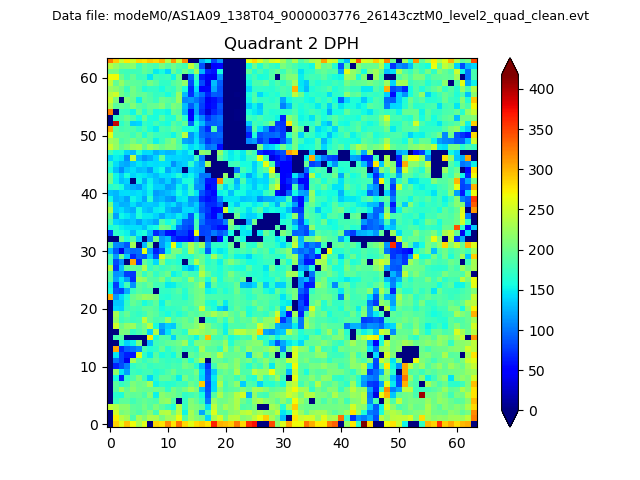
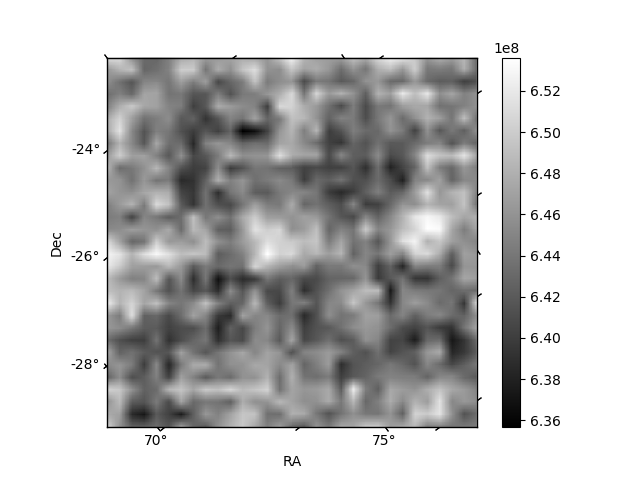
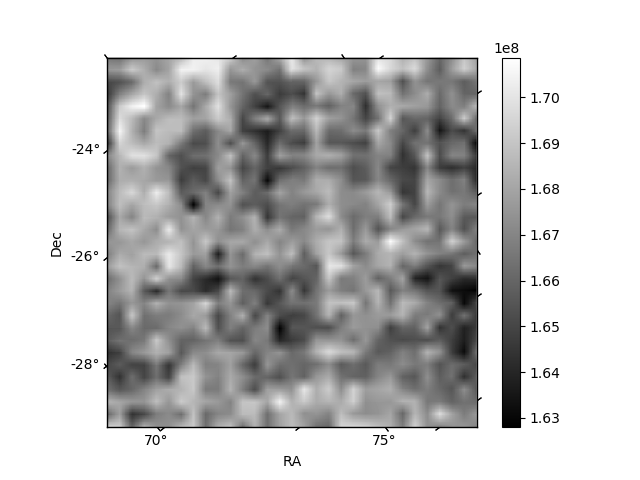
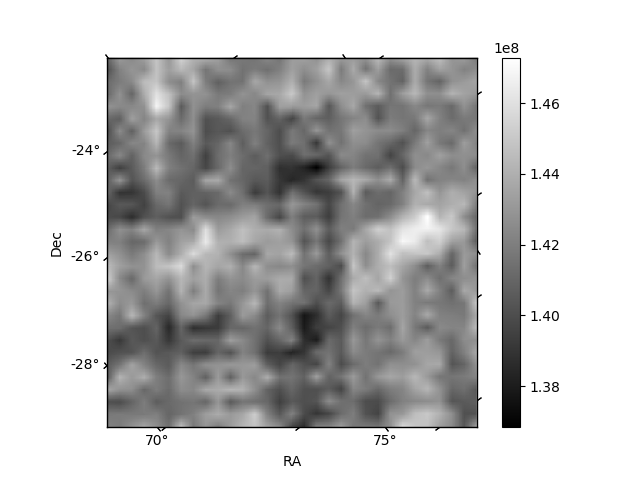
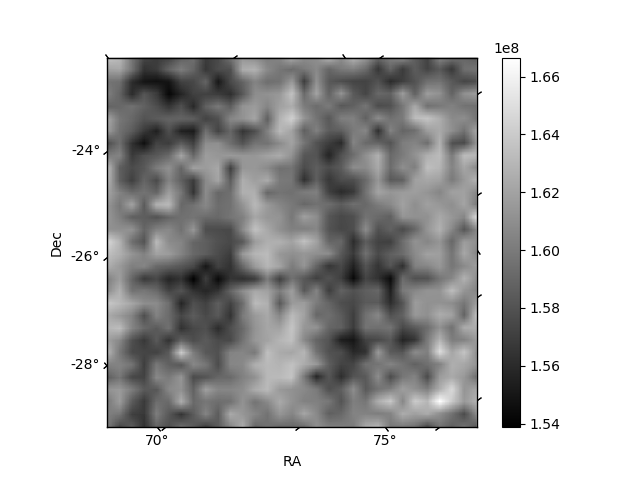
Histogram calculated using DETX and DETY for each event in the final _common_clean file
| Quadrant A | 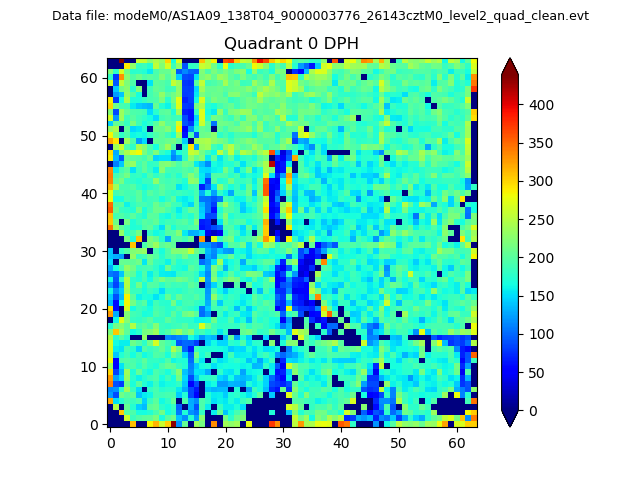 |
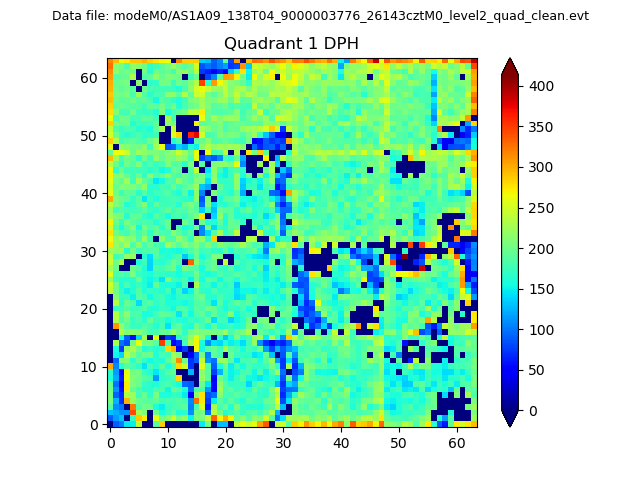 |
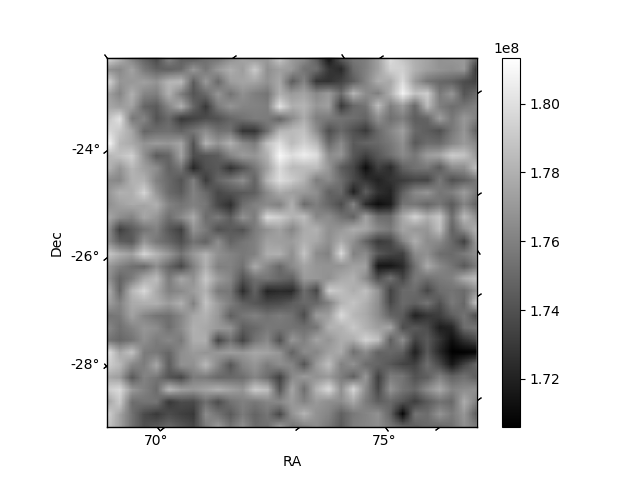
Quadrant B |
|---|---|---|---|
| Quadrant D | 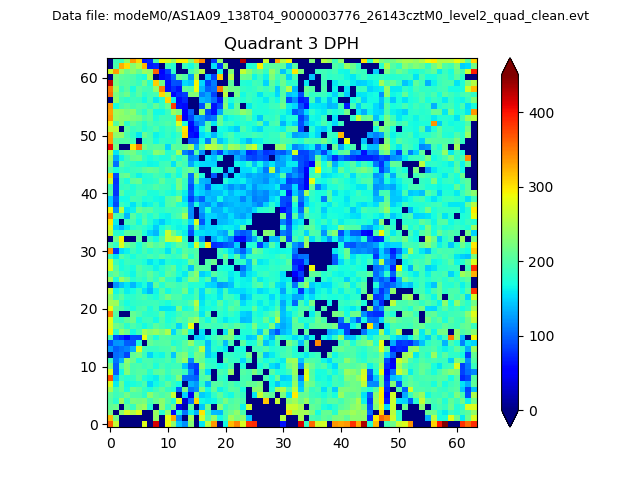 |
 |
Quadrant C |
| Plot type | Count rate plots | Images |
|---|---|---|
| Comparison with Poisson distribution Blue bars denote a histogram of data divided into 1 sec bins. Red curve is a Poisson curve with rate = median count rate of data. |
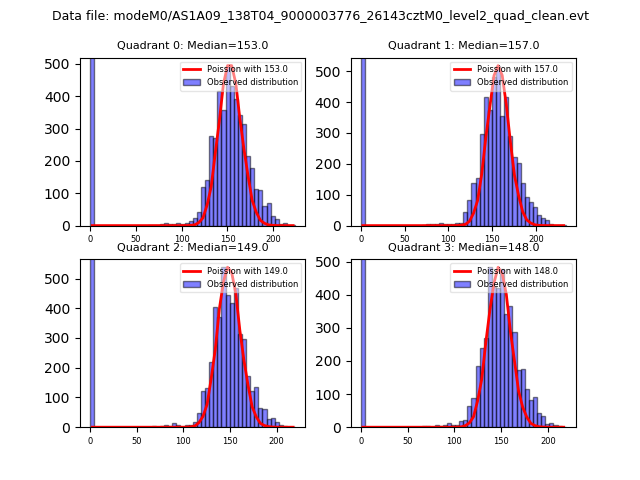 |
 |
| Quadrant-wise count rates Data is divided into 100 sec bins |
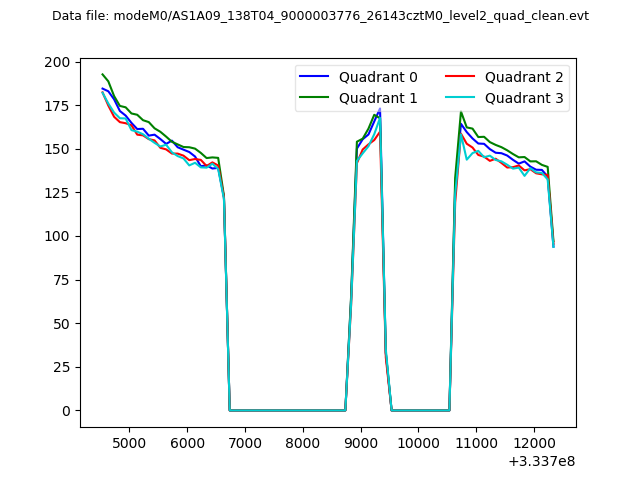 |
|
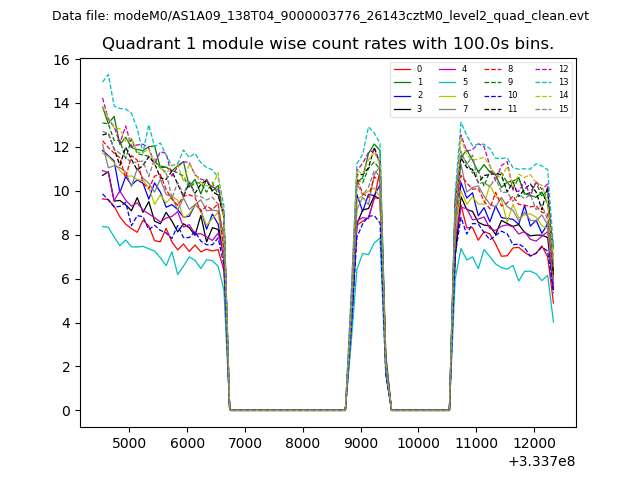
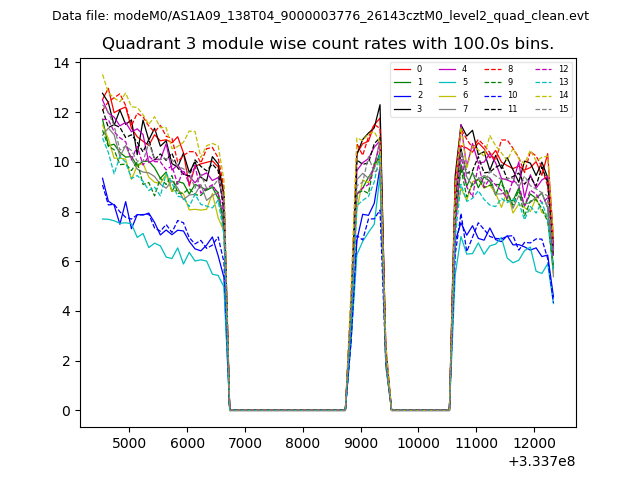
| Module-wise count rates for Quadrant A Data is divided into 100 sec bins |
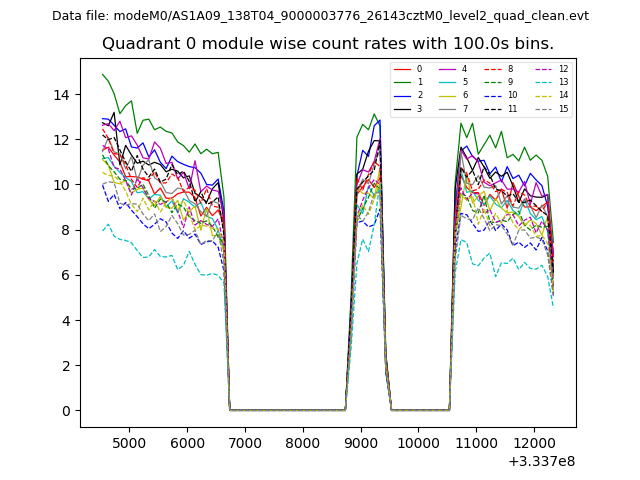 |
 |
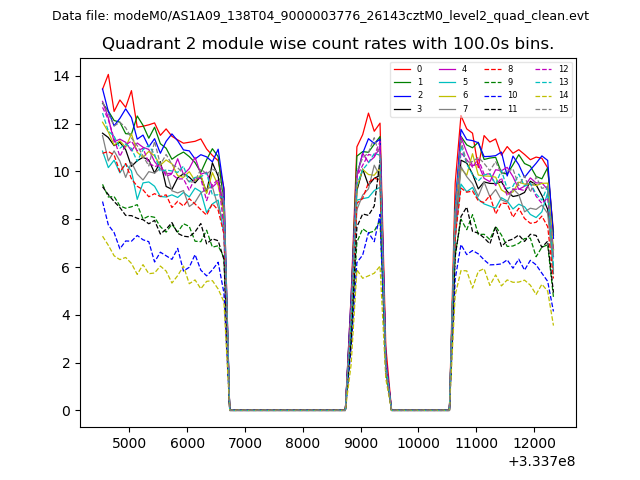
| Module-wise count rates for Quadrant B Data is divided into 100 sec bins |
 |
 |
| Module-wise count rates for Quadrant C Data is divided into 100 sec bins |
 |
 |
| Module-wise count rates for Quadrant D Data is divided into 100 sec bins |
 |
 |
| Parameter | Plot |
|---|---|
| CZT HV Monitor | 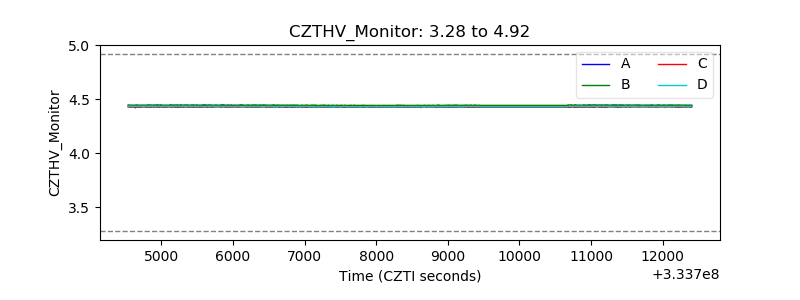 |
| D_VDD | 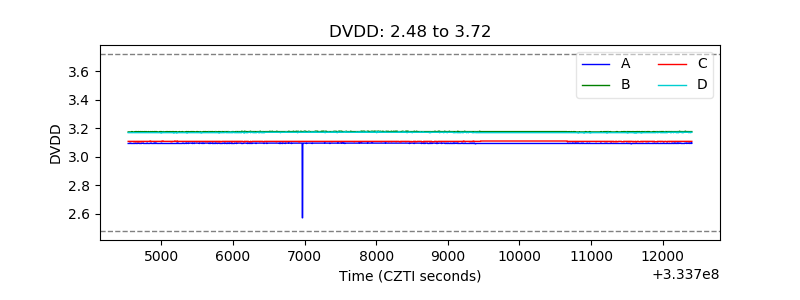 |
| Temperature 1 | 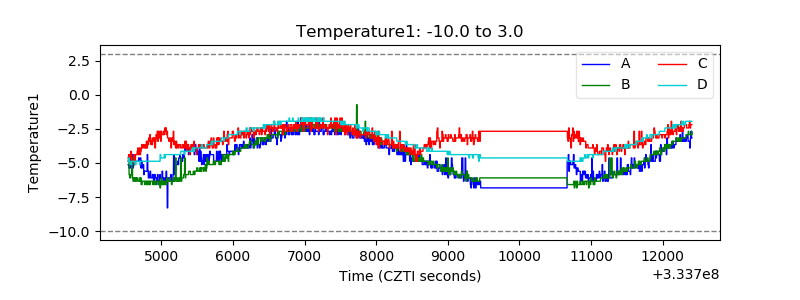 |
| Veto HV Monitor | 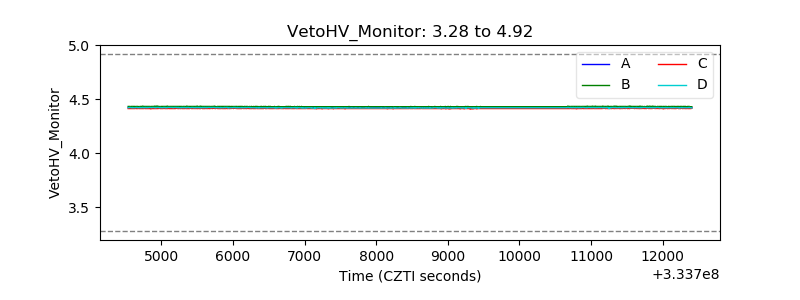 |
| Veto LLD | 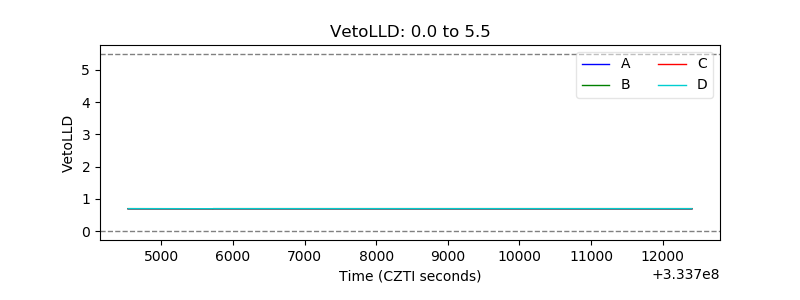 |
| Alpha Counter | 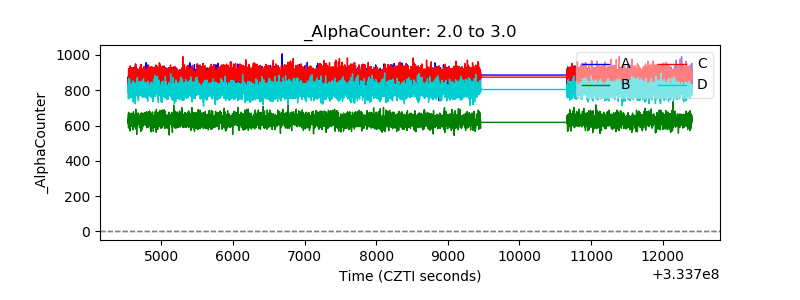 |
| _CPM_Rate | 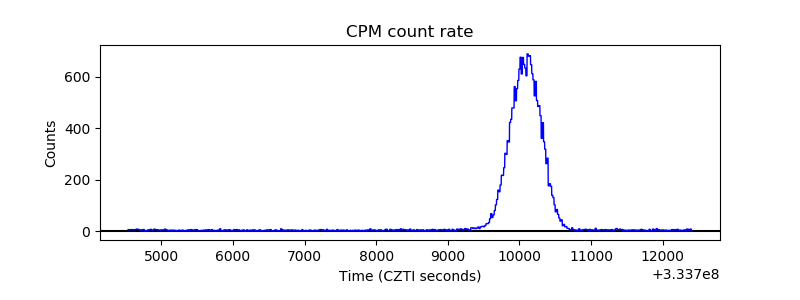 |
| CZT Counter | 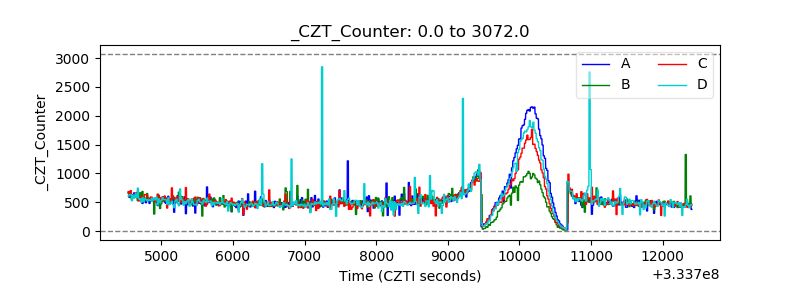 |
| +2.5 Volts monitor |  |
| +5 Volts monitor |  |
| _ROLL_ROT | 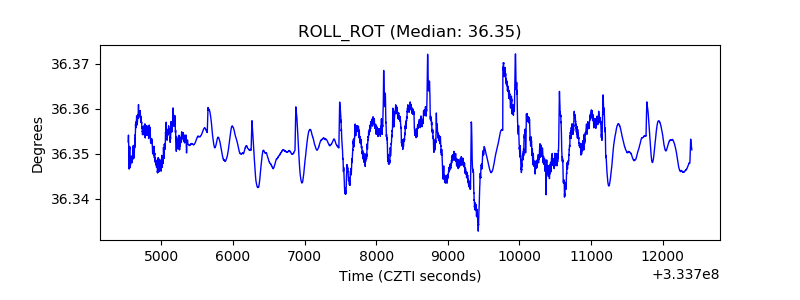 |
| _Roll_DEC | 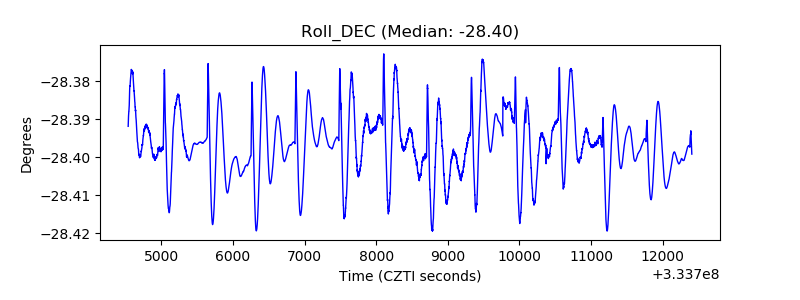 |
| _Roll_RA | 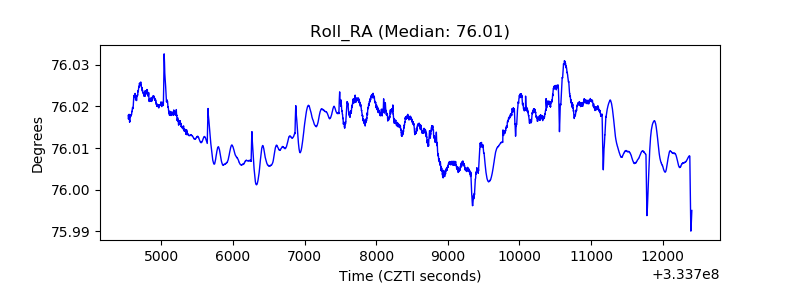 |
| Veto Counter | 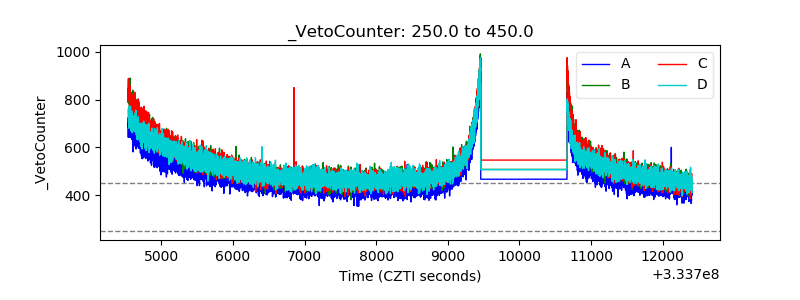 |