| Param | Original file | Final file |
|---|---|---|
| Filename | modeM0/AS1A09_138T04_9000003776_26144cztM0_level2.evt | modeM0/AS1A09_138T04_9000003776_26144cztM0_level2_quad_clean.evt |
| Size (bytes) | 448,922,880 | 90,648,000 |
| Size | 428.1 MB | 86.4 MB |
| Events in quadrant A | 3,273,086 | 576,363 |
| Events in quadrant B | 3,210,492 | 592,720 |
| Events in quadrant C | 3,193,848 | 563,056 |
| Events in quadrant D | 3,478,025 | 561,292 |
| Mode M9 | |||
|---|---|---|---|
| Quadrant | BADHDUFLAG | Total packets | Discarded packets |
| A | 0 | 9 | 0 |
| B | 0 | 9 | 0 |
| C | 0 | 9 | 0 |
| D | 0 | 9 | 0 |
| Mode M0 | |||
|---|---|---|---|
| Quadrant | BADHDUFLAG | Total packets | Discarded packets |
| A | 0 | 13552 | 0 |
| B | 0 | 13384 | 0 |
| C | 0 | 13377 | 0 |
| D | 0 | 14319 | 0 |
| Quadrant | Total seconds | Saturated seconds | Saturation percentage |
|---|---|---|---|
| A | 6473 | 82 | 1.266801% |
| B | 6474 | 81 | 1.251158% |
| C | 6474 | 104 | 1.606426% |
| D | 6474 | 156 | 2.409639% |
Noise dominated data is calculated using 1-second bins in cleaned event files. If a bin has >2000 counts, and if more than 50% of those come from <1% of pixels, then it is considered to be noise-dominated and hence unusable.
| Quadrant | # 1 sec bins | Bins with >0 counts | Bins with >2000 counts | High rate bins dominated by noise | Noise dominated (total time) | Noise dominated (detector-on time) | Marked lightcurve |
|---|---|---|---|---|---|---|---|
| A | 7373 | 6473 | 0 | 0 | 0.00% | 0.00% | 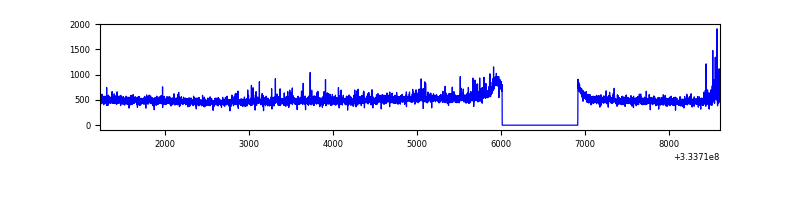 |
| B | 7374 | 6474 | 1 | 1 | 0.01% | 0.02% | 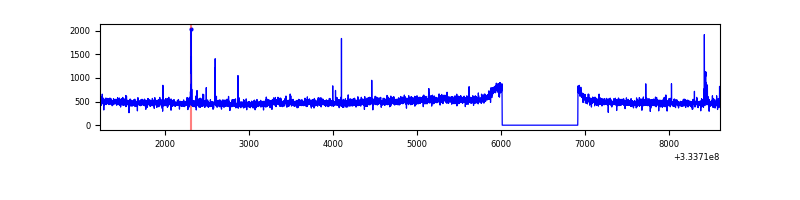 |
| C | 7374 | 6474 | 0 | 0 | 0.00% | 0.00% | 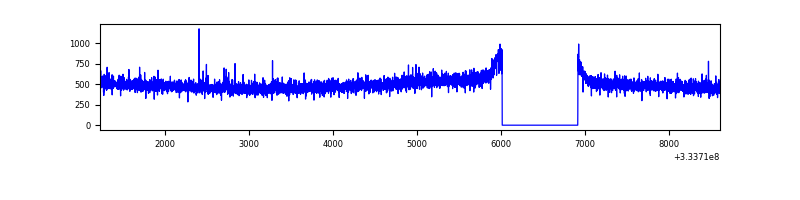 |
| D | 7374 | 6474 | 90 | 90 | 1.22% | 1.39% | 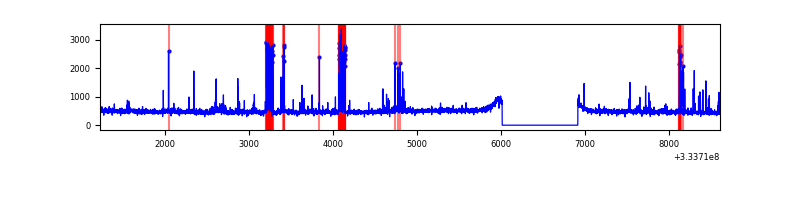 |
Top three noisy pixels from each quadrant. If the there are fewer than three noisy pixels in the level2.evt file, extra rows are filled as -1
| Pixel properties | Quadrant properties | ||||||
|---|---|---|---|---|---|---|---|
| Quadrant | DetID | PixID | Counts | Sigma | Mean | Median | Sigma |
| A | 0 | 13 | 119746 | 720.42 | 818 | 803 | 165.1 |
| A | 13 | 254 | 9007 | 49.69 | 818 | 803 | 165.1 |
| A | 3 | 137 | 7423 | 40.1 | 818 | 803 | 165.1 |
| B | 0 | 230 | 24810 | 156.24 | 805 | 785 | 153.8 |
| B | 0 | 190 | 19930 | 124.51 | 805 | 785 | 153.8 |
| B | 12 | 111 | 18449 | 114.87 | 805 | 785 | 153.8 |
| C | 14 | 238 | 127824 | 696.75 | 781 | 787 | 182.3 |
| C | 2 | 16 | 13730 | 70.99 | 781 | 787 | 182.3 |
| C | 3 | 233 | 7184 | 35.08 | 781 | 787 | 182.3 |
| D | 1 | 52 | 384911 | 2038.02 | 797 | 780 | 188.5 |
| D | 12 | 233 | 42146 | 219.47 | 797 | 780 | 188.5 |
| D | 2 | 234 | 28618 | 147.7 | 797 | 780 | 188.5 |
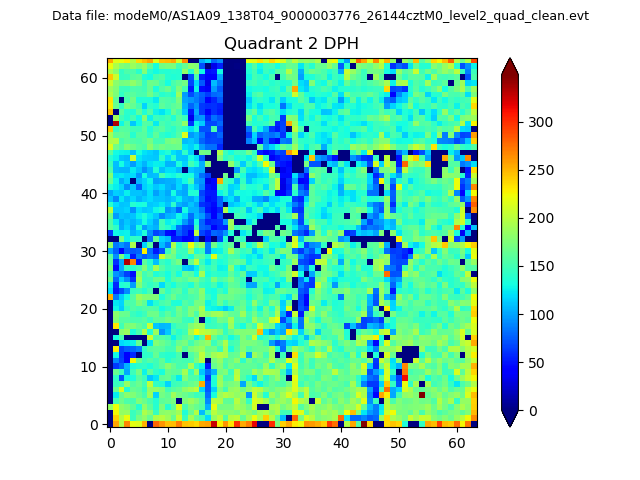
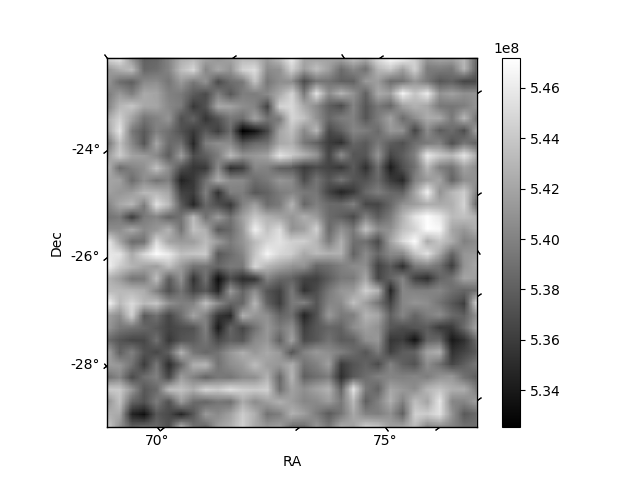
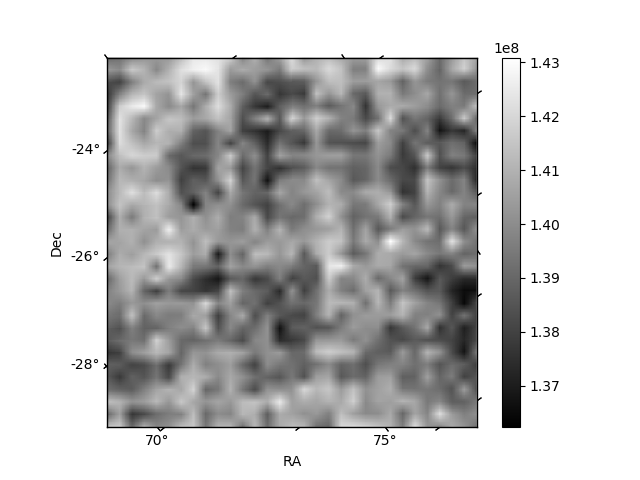
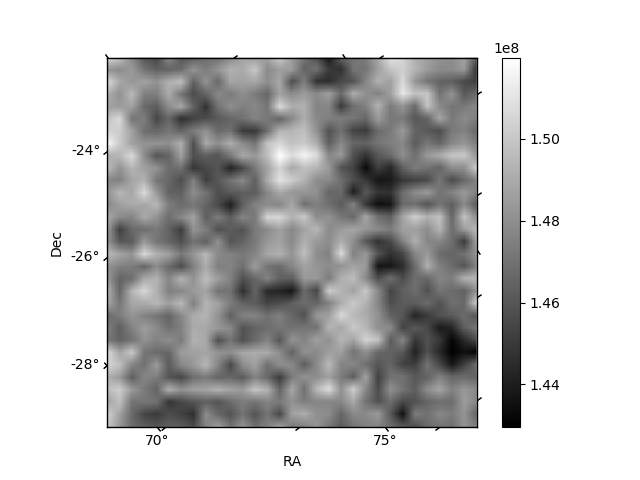
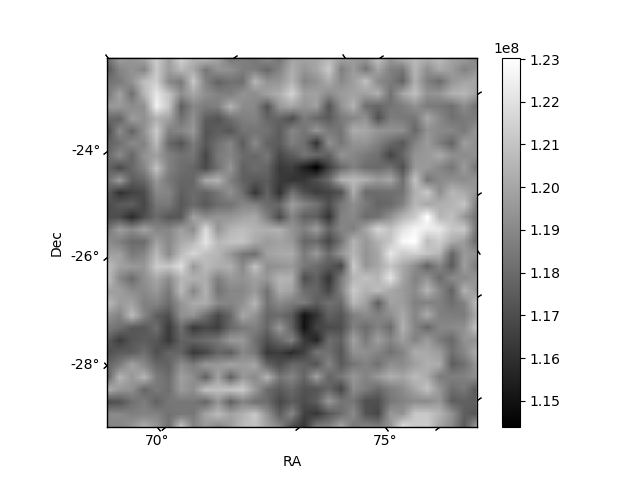
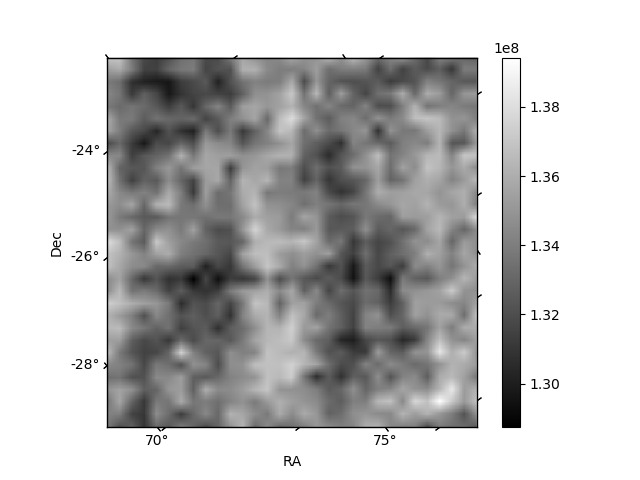
Histogram calculated using DETX and DETY for each event in the final _common_clean file
| Quadrant A | 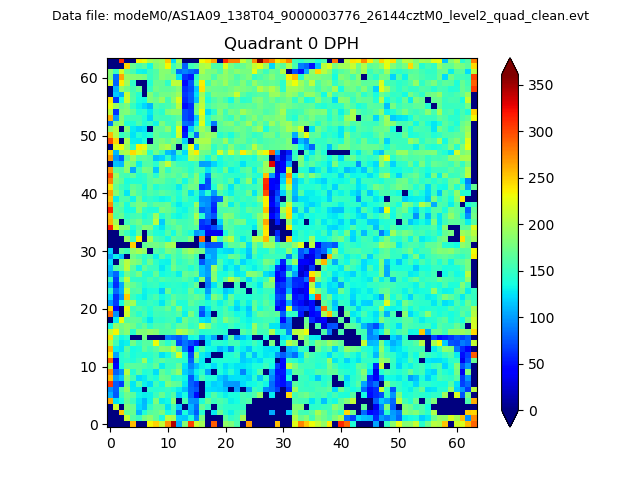 |
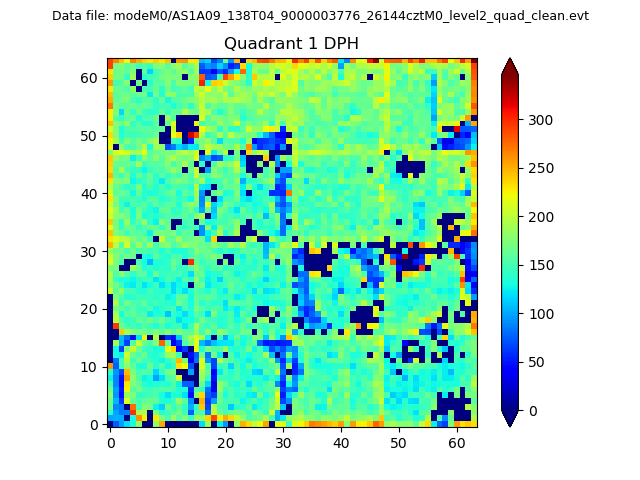 |
Quadrant B |
|---|---|---|---|
| Quadrant D | 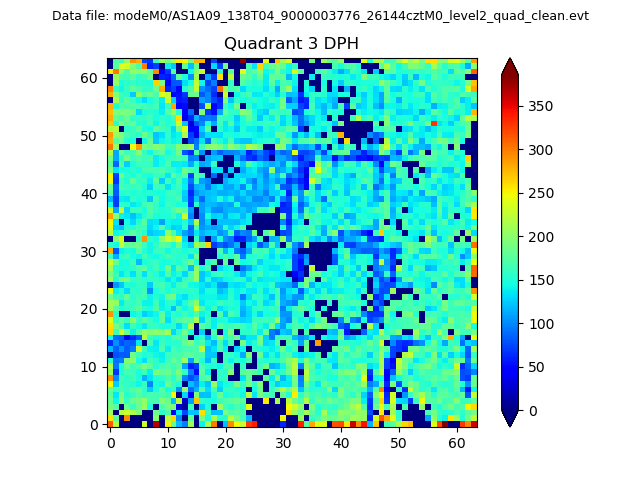 |
 |
Quadrant C |
| Plot type | Count rate plots | Images |
|---|---|---|
| Comparison with Poisson distribution Blue bars denote a histogram of data divided into 1 sec bins. Red curve is a Poisson curve with rate = median count rate of data. |
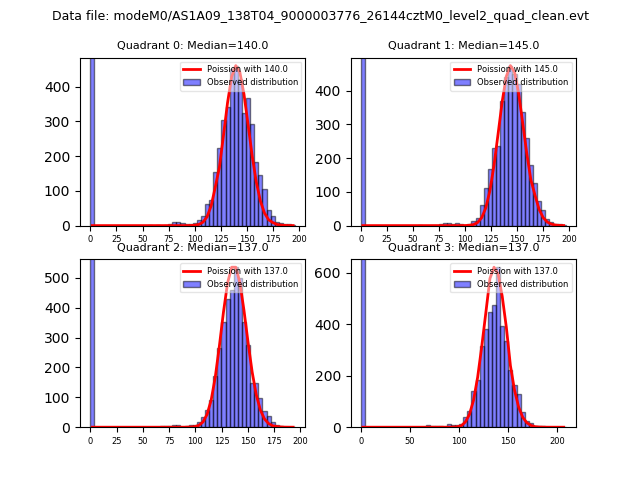 |
 |
| Quadrant-wise count rates Data is divided into 100 sec bins |
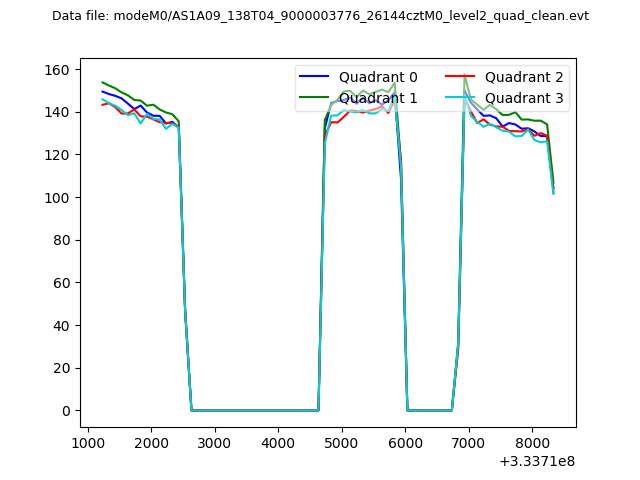 |
|
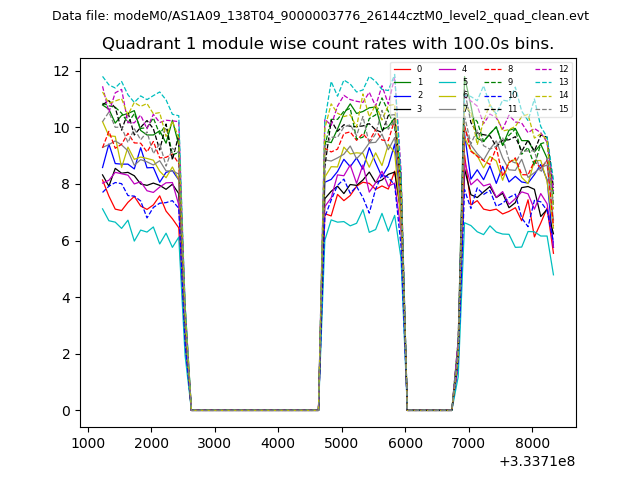
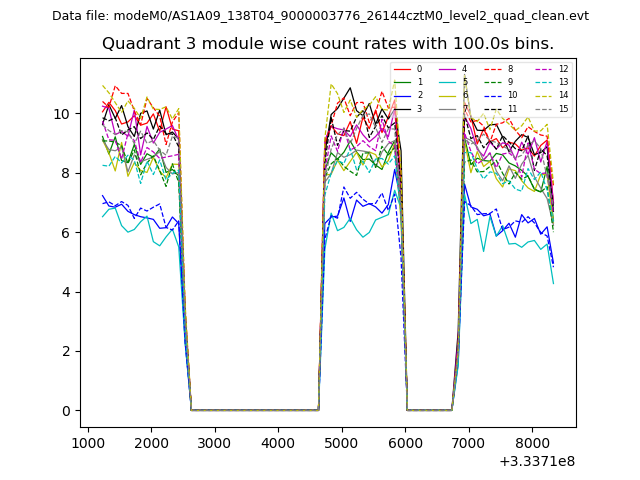
| Module-wise count rates for Quadrant A Data is divided into 100 sec bins |
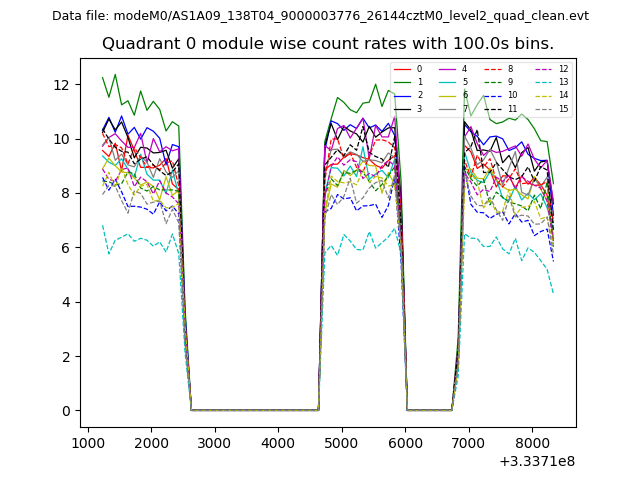 |
 |
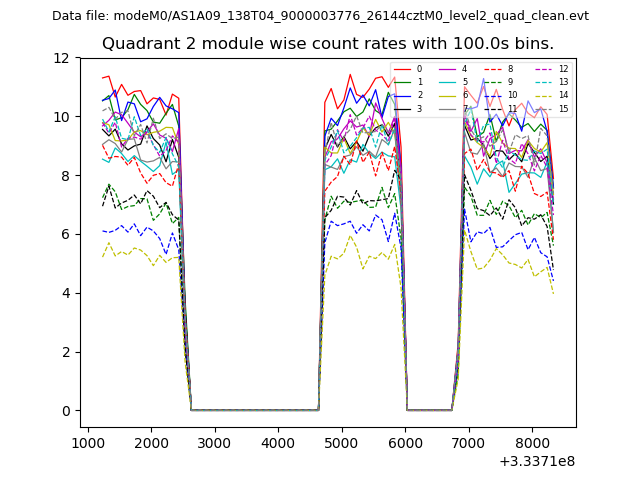
| Module-wise count rates for Quadrant B Data is divided into 100 sec bins |
 |
 |
| Module-wise count rates for Quadrant C Data is divided into 100 sec bins |
 |
 |
| Module-wise count rates for Quadrant D Data is divided into 100 sec bins |
 |
 |
| Parameter | Plot |
|---|---|
| CZT HV Monitor | 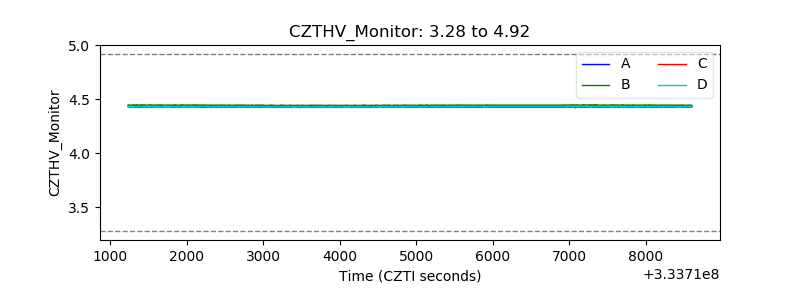 |
| D_VDD | 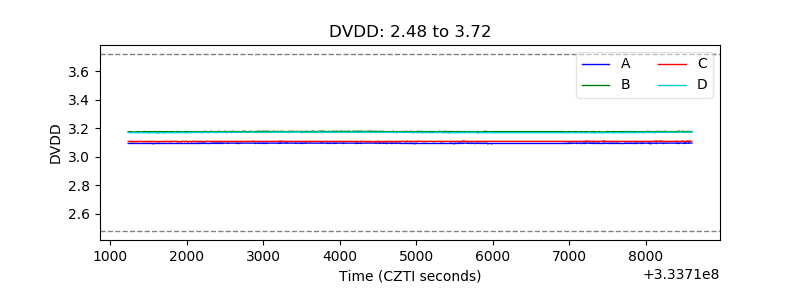 |
| Temperature 1 | 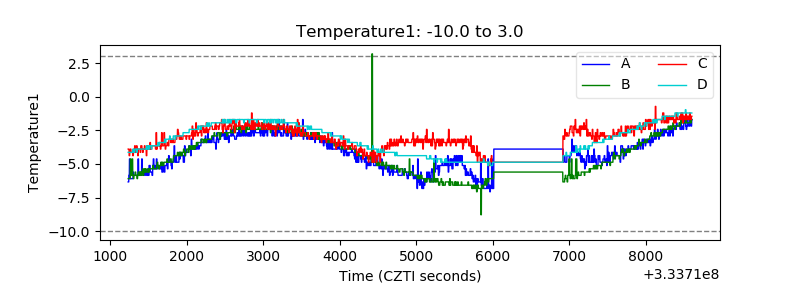 |
| Veto HV Monitor |  |
| Veto LLD | 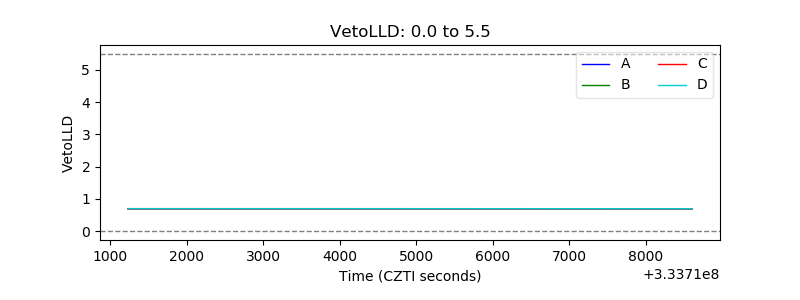 |
| Alpha Counter |  |
| _CPM_Rate |  |
| CZT Counter | 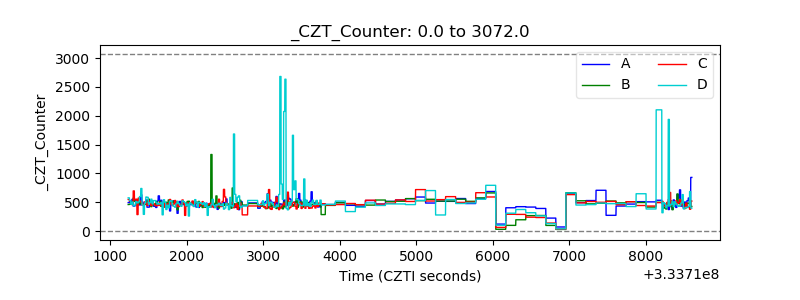 |
| +2.5 Volts monitor | 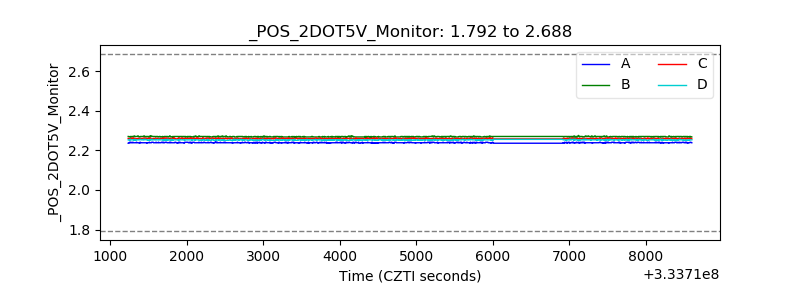 |
| +5 Volts monitor |  |
| _ROLL_ROT | 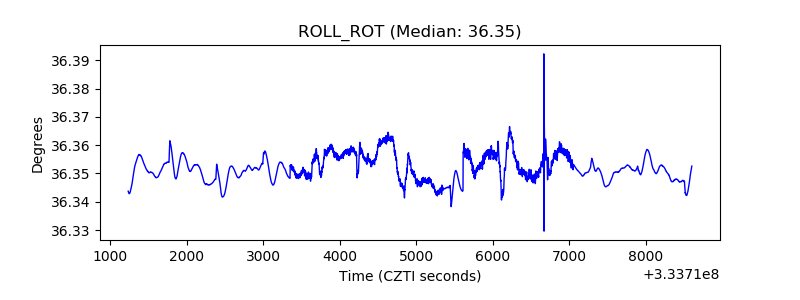 |
| _Roll_DEC | 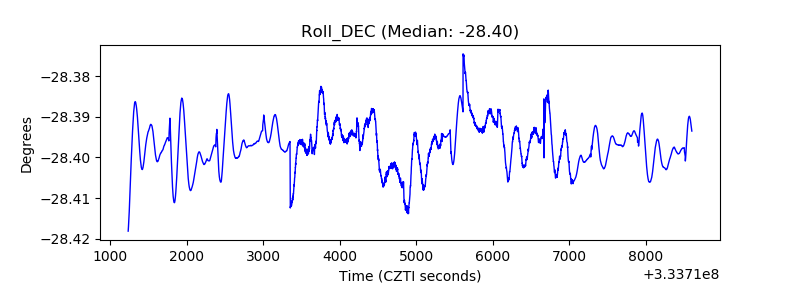 |
| _Roll_RA | 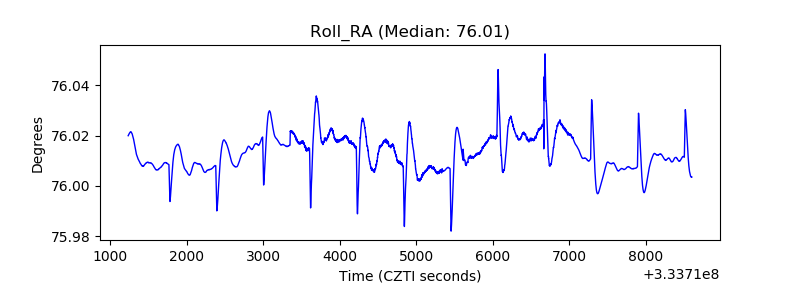 |
| Veto Counter | 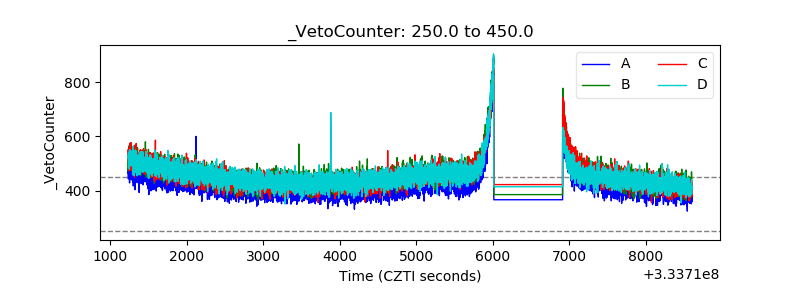 |