| Param | Original file | Final file |
|---|---|---|
| Filename | modeM0/AS1A09_138T04_9000003776_26145cztM0_level2.evt | modeM0/AS1A09_138T04_9000003776_26145cztM0_level2_quad_clean.evt |
| Size (bytes) | 504,279,360 | 96,534,720 |
| Size | 480.9 MB | 92.1 MB |
| Events in quadrant A | 3,576,344 | 608,697 |
| Events in quadrant B | 3,576,733 | 627,493 |
| Events in quadrant C | 3,521,614 | 596,397 |
| Events in quadrant D | 4,107,084 | 588,025 |
| Mode M9 | |||
|---|---|---|---|
| Quadrant | BADHDUFLAG | Total packets | Discarded packets |
| A | 0 | 4 | 0 |
| B | 0 | 4 | 0 |
| C | 0 | 4 | 0 |
| D | 0 | 4 | 0 |
| Mode M0 | |||
|---|---|---|---|
| Quadrant | BADHDUFLAG | Total packets | Discarded packets |
| A | 0 | 15045 | 0 |
| B | 0 | 15018 | 0 |
| C | 0 | 14908 | 0 |
| D | 0 | 16911 | 0 |
| Quadrant | Total seconds | Saturated seconds | Saturation percentage |
|---|---|---|---|
| A | 7218 | 159 | 2.202826% |
| B | 7219 | 181 | 2.507272% |
| C | 7219 | 180 | 2.493420% |
| D | 7218 | 267 | 3.699086% |
Noise dominated data is calculated using 1-second bins in cleaned event files. If a bin has >2000 counts, and if more than 50% of those come from <1% of pixels, then it is considered to be noise-dominated and hence unusable.
| Quadrant | # 1 sec bins | Bins with >0 counts | Bins with >2000 counts | High rate bins dominated by noise | Noise dominated (total time) | Noise dominated (detector-on time) | Marked lightcurve |
|---|---|---|---|---|---|---|---|
| A | 7623 | 7218 | 0 | 0 | 0.00% | 0.00% | 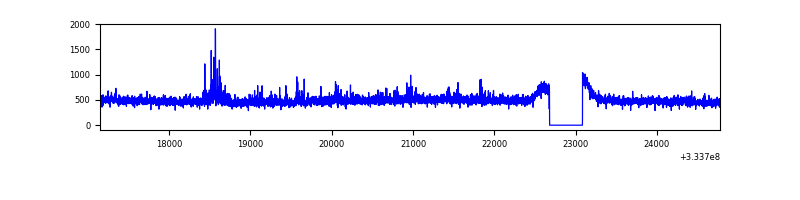 |
| B | 7624 | 7219 | 5 | 5 | 0.07% | 0.07% | 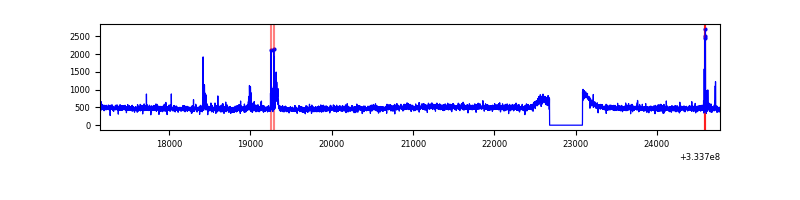 |
| C | 7624 | 7219 | 0 | 0 | 0.00% | 0.00% | 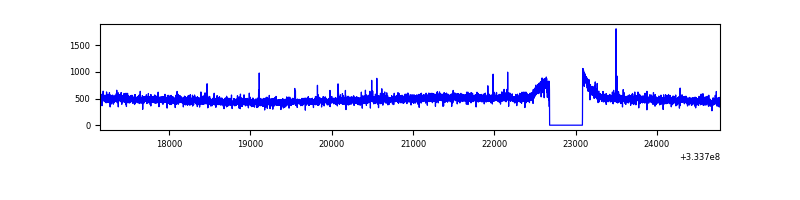 |
| D | 7623 | 7218 | 152 | 152 | 1.99% | 2.11% | 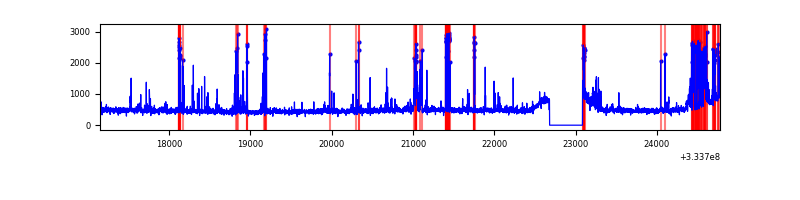 |
Top three noisy pixels from each quadrant. If the there are fewer than three noisy pixels in the level2.evt file, extra rows are filled as -1
| Pixel properties | Quadrant properties | ||||||
|---|---|---|---|---|---|---|---|
| Quadrant | DetID | PixID | Counts | Sigma | Mean | Median | Sigma |
| A | 0 | 13 | 132167 | 723.24 | 893 | 871 | 181.5 |
| A | 13 | 254 | 10353 | 52.23 | 893 | 871 | 181.5 |
| A | 3 | 137 | 8267 | 40.74 | 893 | 871 | 181.5 |
| B | 5 | 172 | 49942 | 287.6 | 884 | 862 | 170.7 |
| B | 0 | 190 | 25062 | 141.81 | 884 | 862 | 170.7 |
| B | 12 | 111 | 20716 | 116.34 | 884 | 862 | 170.7 |
| C | 14 | 238 | 138152 | 680.2 | 858 | 863 | 201.8 |
| C | 3 | 233 | 16548 | 77.71 | 858 | 863 | 201.8 |
| C | 2 | 16 | 11919 | 54.78 | 858 | 863 | 201.8 |
| D | 1 | 52 | 633014 | 3065.68 | 867 | 846 | 206.2 |
| D | 1 | 3 | 121359 | 584.42 | 867 | 846 | 206.2 |
| D | 12 | 233 | 37105 | 175.84 | 867 | 846 | 206.2 |
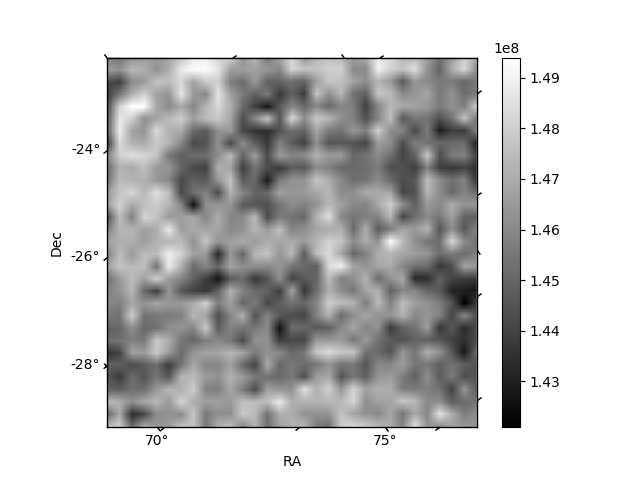
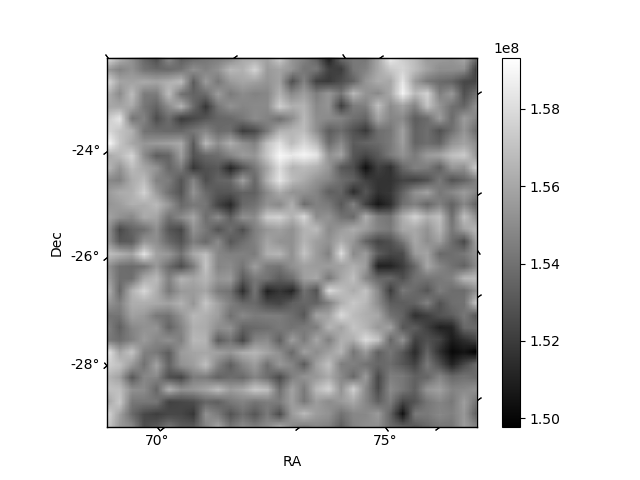
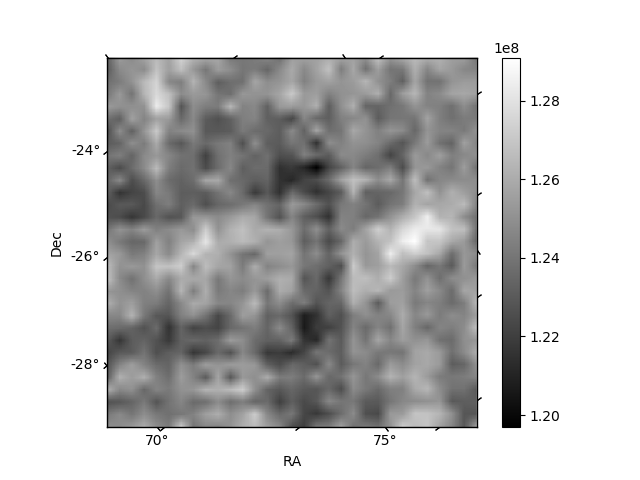
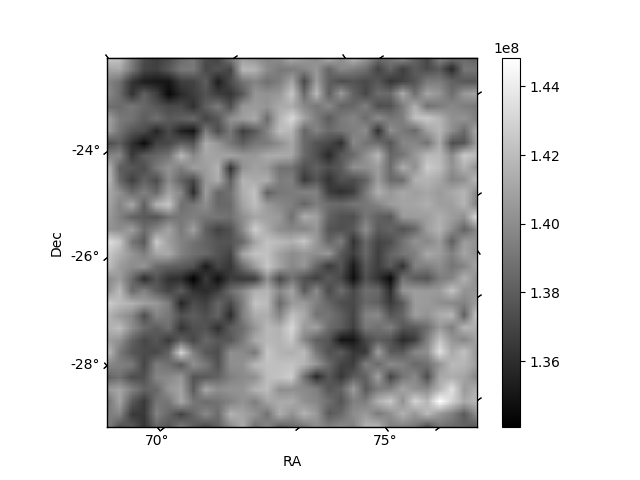
Histogram calculated using DETX and DETY for each event in the final _common_clean file
| Quadrant A | 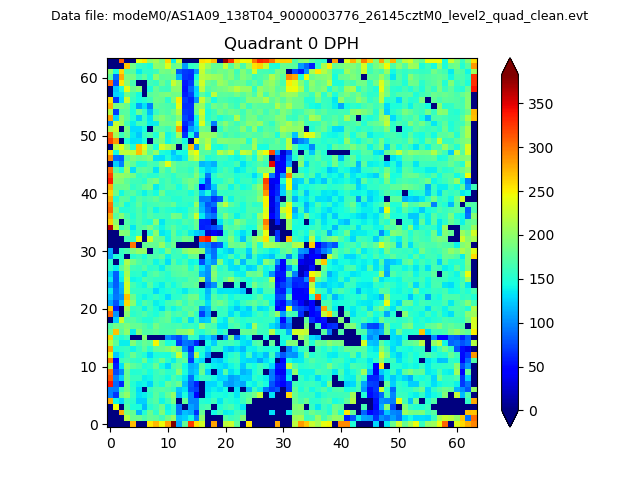 |
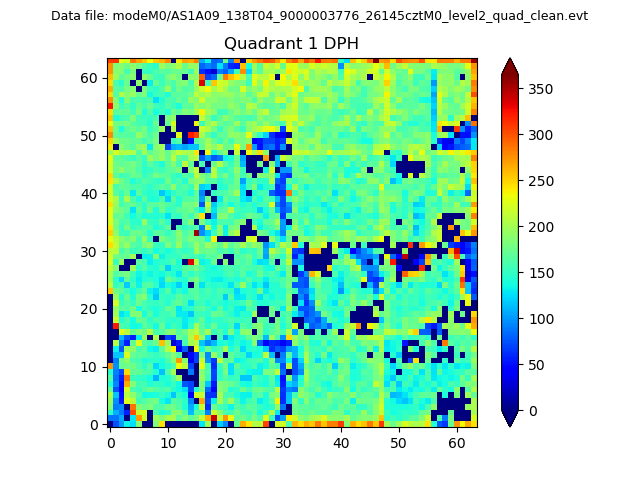 |
Quadrant B |
|---|---|---|---|
| Quadrant D | 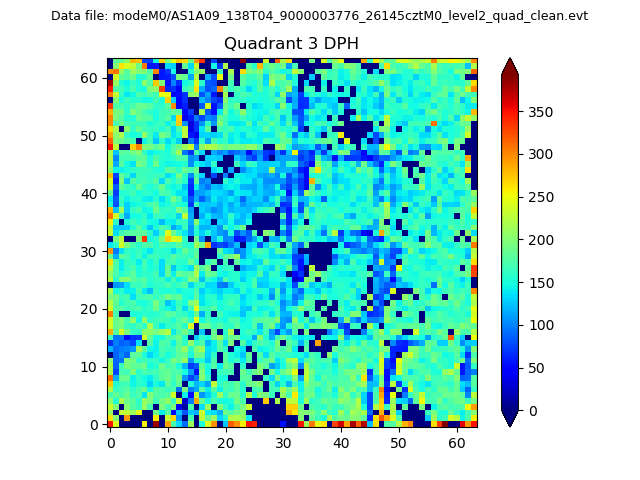 |
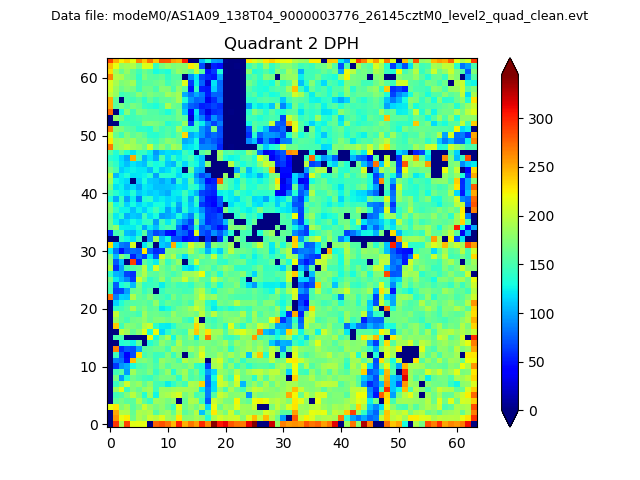 |
Quadrant C |
| Plot type | Count rate plots | Images |
|---|---|---|
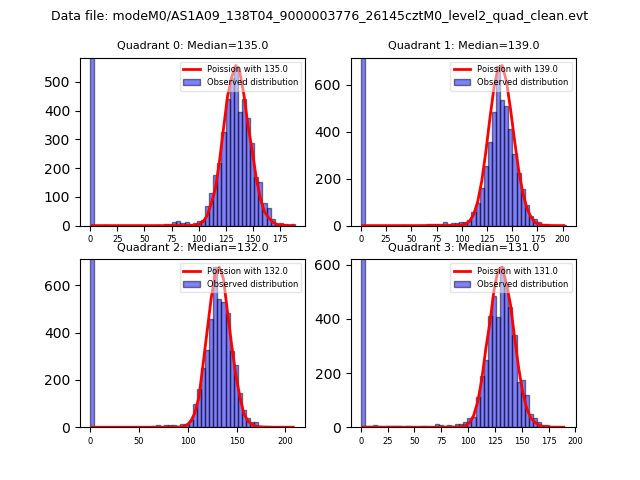
| Comparison with Poisson distribution Blue bars denote a histogram of data divided into 1 sec bins. Red curve is a Poisson curve with rate = median count rate of data. |
 |
 |
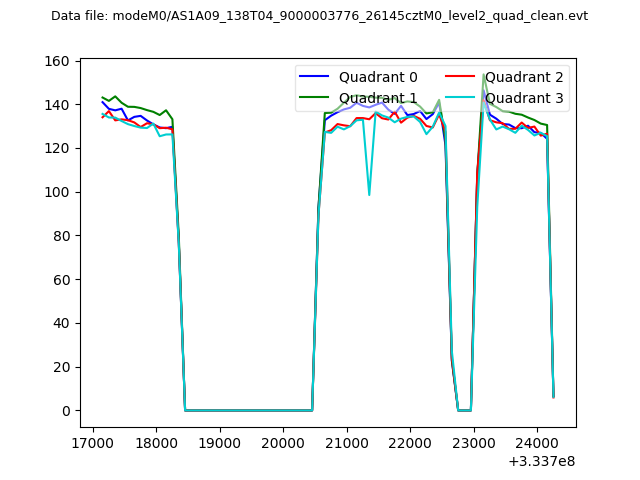
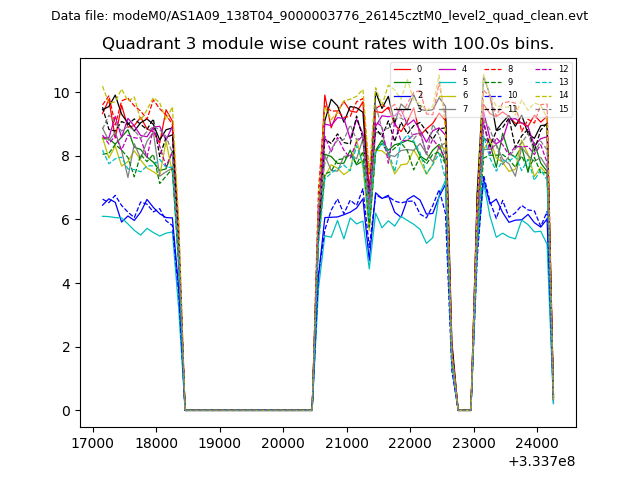
| Quadrant-wise count rates Data is divided into 100 sec bins |
 |
|
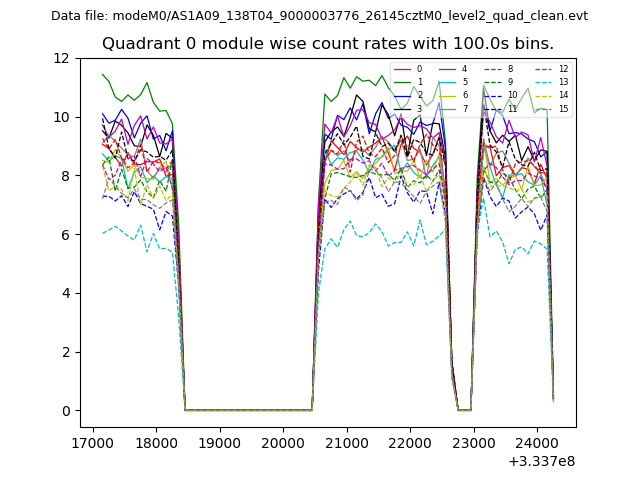
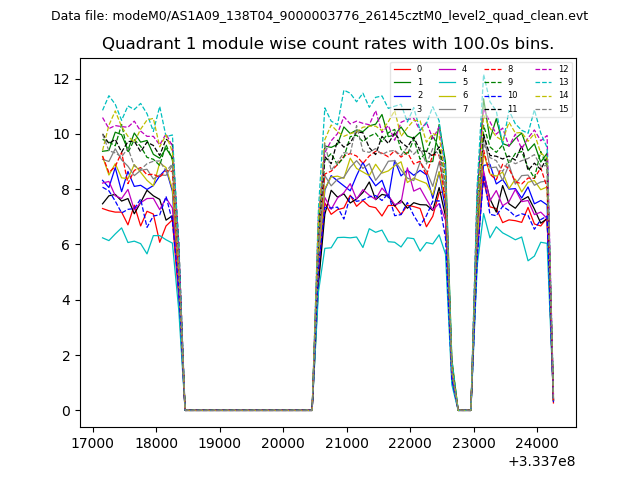
| Module-wise count rates for Quadrant A Data is divided into 100 sec bins |
 |
 |
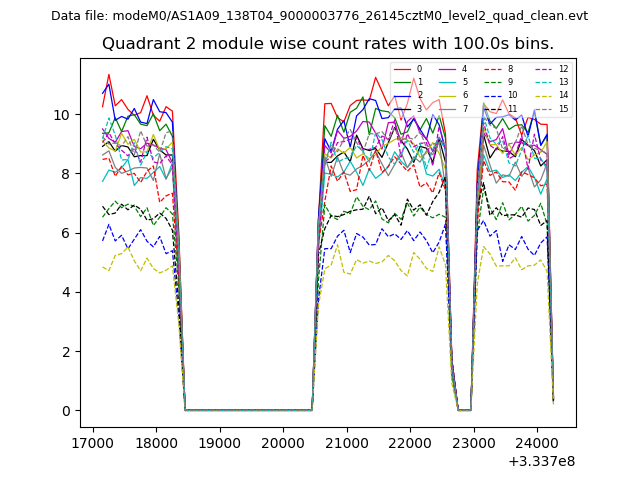
| Module-wise count rates for Quadrant B Data is divided into 100 sec bins |
 |
 |
| Module-wise count rates for Quadrant C Data is divided into 100 sec bins |
 |
 |
| Module-wise count rates for Quadrant D Data is divided into 100 sec bins |
 |
 |
| Parameter | Plot |
|---|---|
| CZT HV Monitor | 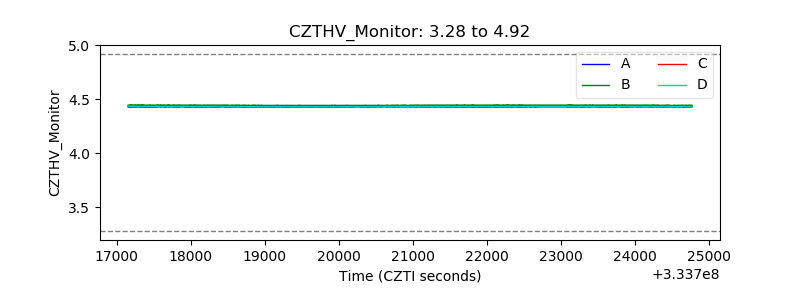 |
| D_VDD | 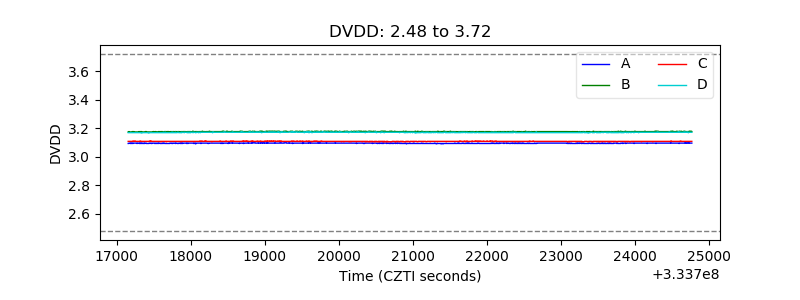 |
| Temperature 1 | 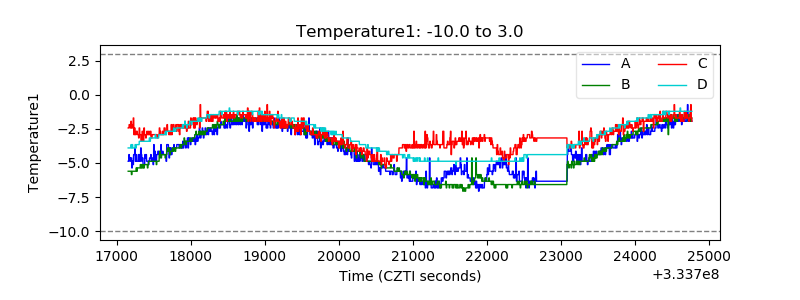 |
| Veto HV Monitor | 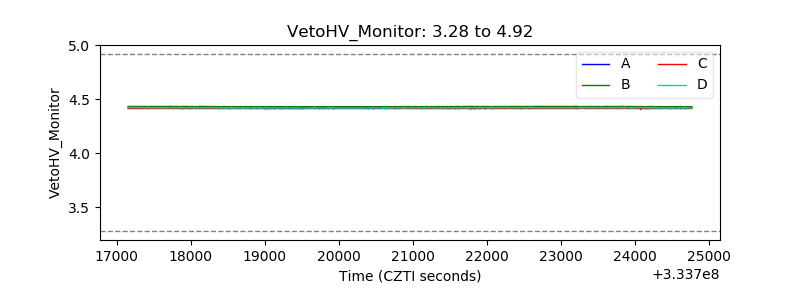 |
| Veto LLD | 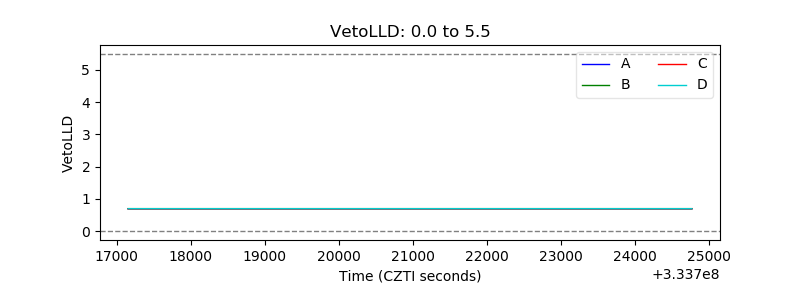 |
| Alpha Counter | 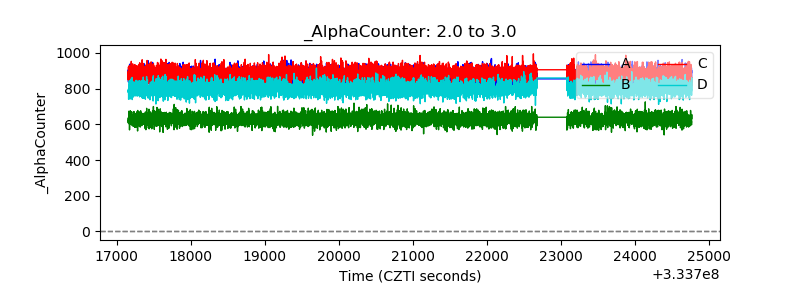 |
| _CPM_Rate | 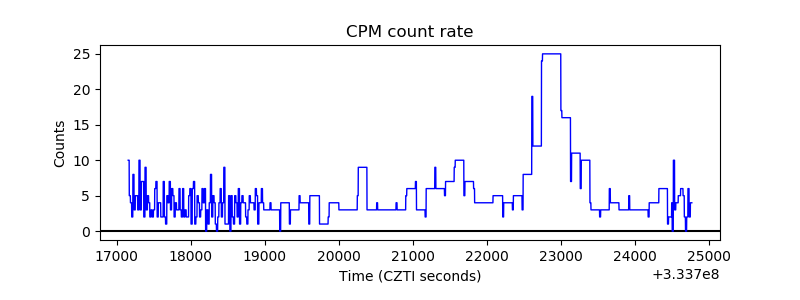 |
| CZT Counter | 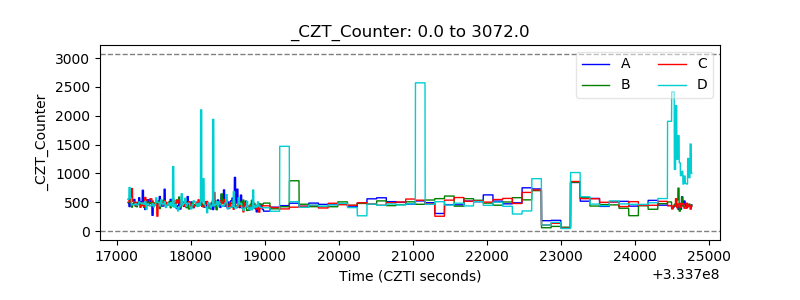 |
| +2.5 Volts monitor |  |
| +5 Volts monitor |  |
| _ROLL_ROT | 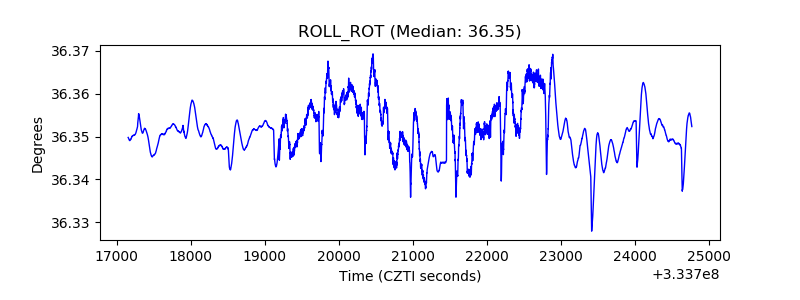 |
| _Roll_DEC | 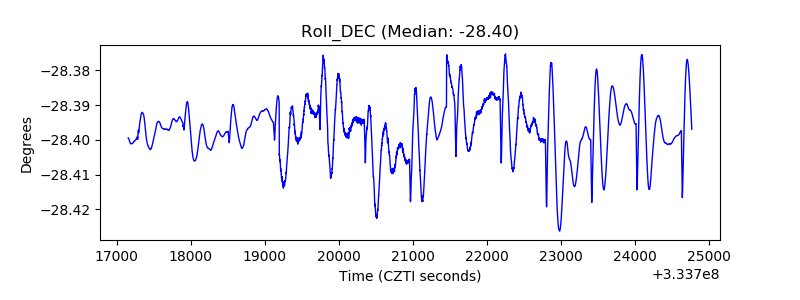 |
| _Roll_RA | 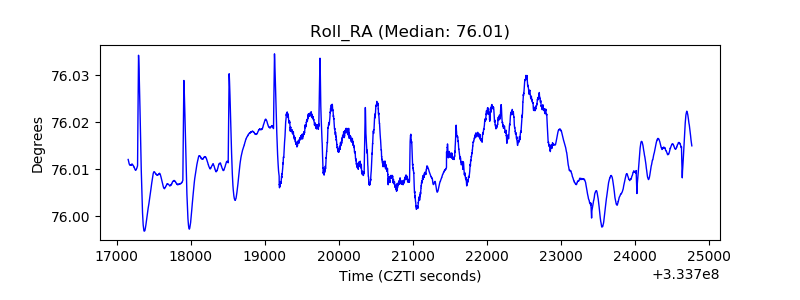 |
| Veto Counter | 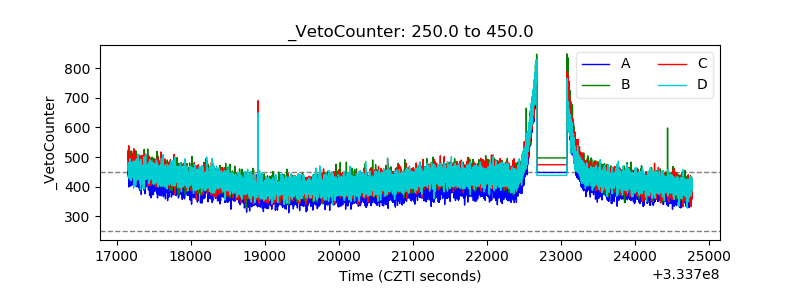 |