| Param | Original file | Final file |
|---|---|---|
| Filename | modeM0/AS1A09_138T04_9000003776_26146cztM0_level2.evt | modeM0/AS1A09_138T04_9000003776_26146cztM0_level2_quad_clean.evt |
| Size (bytes) | 593,663,040 | 86,086,080 |
| Size | 566.2 MB | 82.1 MB |
| Events in quadrant A | 3,459,419 | 536,017 |
| Events in quadrant B | 3,456,483 | 548,827 |
| Events in quadrant C | 3,509,624 | 523,821 |
| Events in quadrant D | 7,076,078 | 507,364 |
| Mode M9 | |||
|---|---|---|---|
| Quadrant | BADHDUFLAG | Total packets | Discarded packets |
| A | 0 | 1 | 0 |
| B | 0 | 1 | 0 |
| C | 0 | 1 | 0 |
| D | 0 | 1 | 0 |
| Mode M0 | |||
|---|---|---|---|
| Quadrant | BADHDUFLAG | Total packets | Discarded packets |
| A | 0 | 14818 | 0 |
| B | 0 | 14676 | 0 |
| C | 0 | 14795 | 0 |
| D | 0 | 25633 | 0 |
| Quadrant | Total seconds | Saturated seconds | Saturation percentage |
|---|---|---|---|
| A | 7037 | 213 | 3.026858% |
| B | 7038 | 233 | 3.310600% |
| C | 7038 | 204 | 2.898551% |
| D | 7038 | 1030 | 14.634839% |
Noise dominated data is calculated using 1-second bins in cleaned event files. If a bin has >2000 counts, and if more than 50% of those come from <1% of pixels, then it is considered to be noise-dominated and hence unusable.
| Quadrant | # 1 sec bins | Bins with >0 counts | Bins with >2000 counts | High rate bins dominated by noise | Noise dominated (total time) | Noise dominated (detector-on time) | Marked lightcurve |
|---|---|---|---|---|---|---|---|
| A | 7167 | 7037 | 7 | 7 | 0.10% | 0.10% | 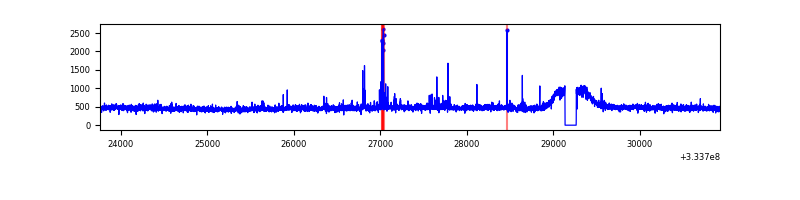 |
| B | 7168 | 7038 | 3 | 3 | 0.04% | 0.04% | 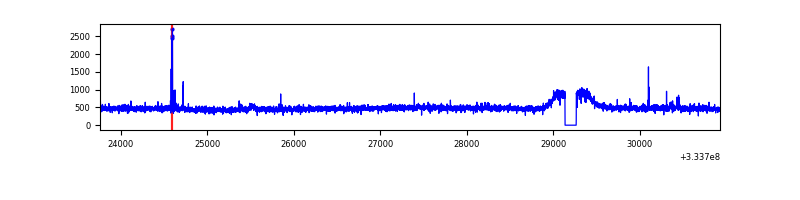 |
| C | 7168 | 7038 | 0 | 0 | 0.00% | 0.00% | 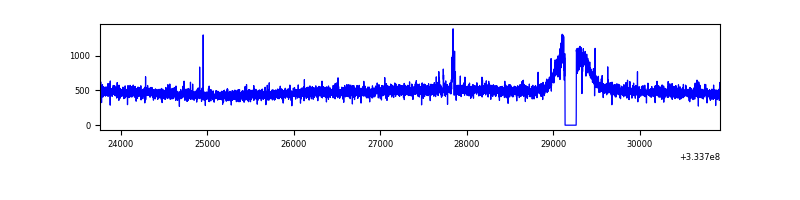 |
| D | 7168 | 7038 | 943 | 943 | 13.16% | 13.40% | 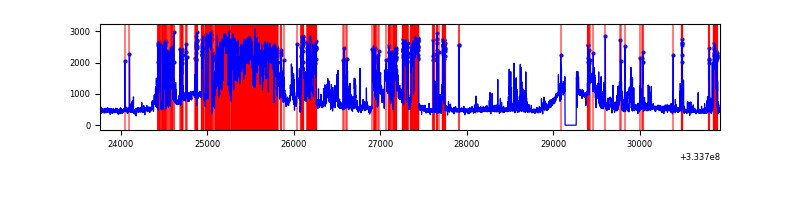 |
Top three noisy pixels from each quadrant. If the there are fewer than three noisy pixels in the level2.evt file, extra rows are filled as -1
| Pixel properties | Quadrant properties | ||||||
|---|---|---|---|---|---|---|---|
| Quadrant | DetID | PixID | Counts | Sigma | Mean | Median | Sigma |
| A | 0 | 13 | 68159 | 375.02 | 879 | 857 | 179.5 |
| A | 13 | 254 | 10297 | 52.6 | 879 | 857 | 179.5 |
| A | 3 | 137 | 8439 | 42.25 | 879 | 857 | 179.5 |
| B | 0 | 190 | 21233 | 120.34 | 868 | 846 | 169.4 |
| B | 12 | 111 | 20889 | 118.31 | 868 | 846 | 169.4 |
| B | 11 | 111 | 18813 | 106.06 | 868 | 846 | 169.4 |
| C | 14 | 238 | 133006 | 660.38 | 842 | 848 | 200.1 |
| C | 3 | 233 | 48409 | 237.66 | 842 | 848 | 200.1 |
| C | 13 | 250 | 39745 | 194.36 | 842 | 848 | 200.1 |
| D | 1 | 52 | 2888672 | 14652.71 | 827 | 808 | 197.1 |
| D | 1 | 3 | 982762 | 4982.33 | 827 | 808 | 197.1 |
| D | 12 | 233 | 46465 | 231.66 | 827 | 808 | 197.1 |
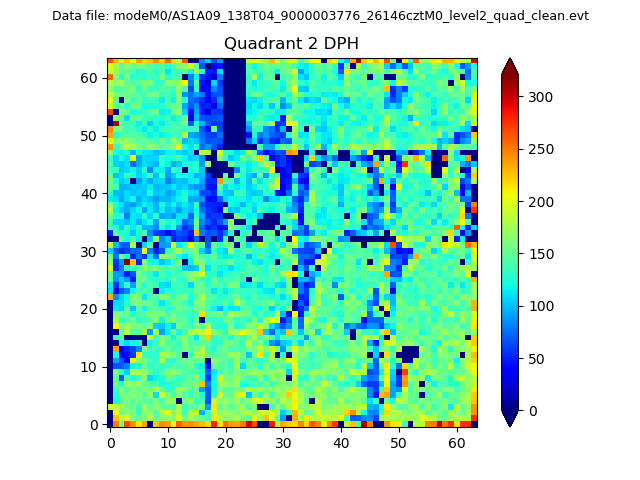
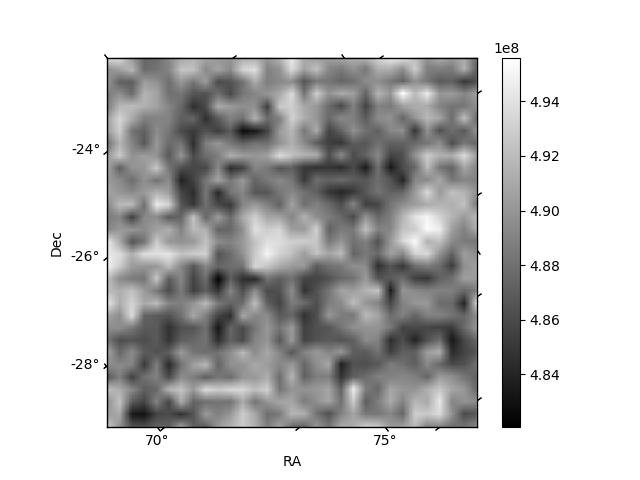
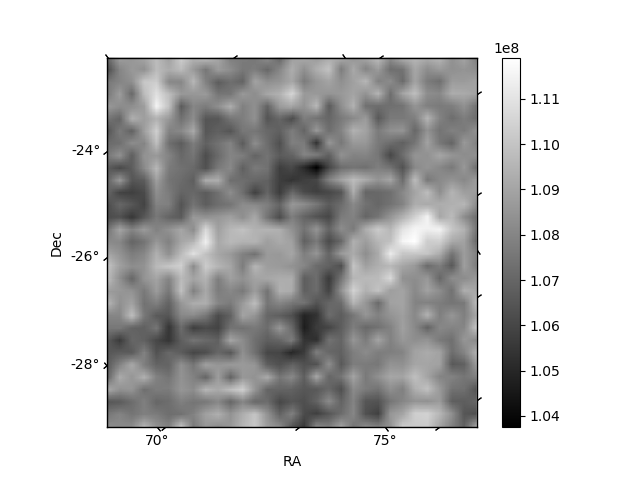
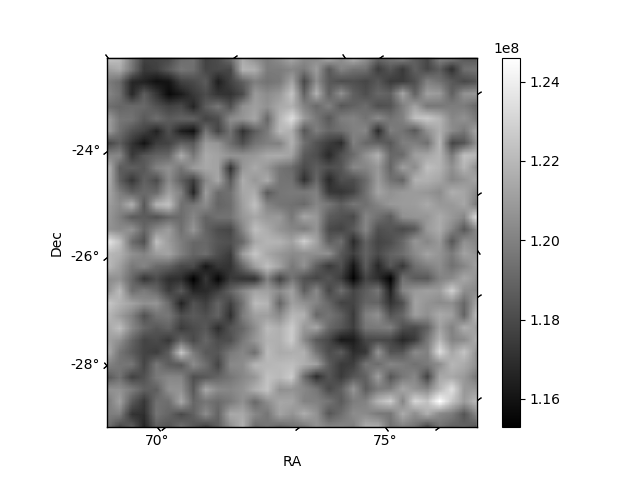
Histogram calculated using DETX and DETY for each event in the final _common_clean file
| Quadrant A | 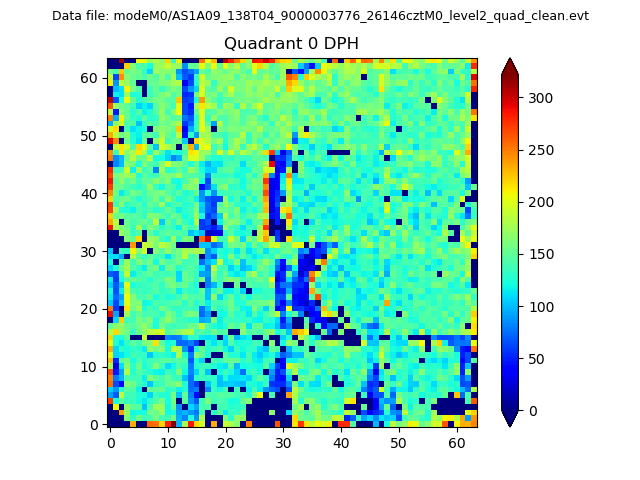 |
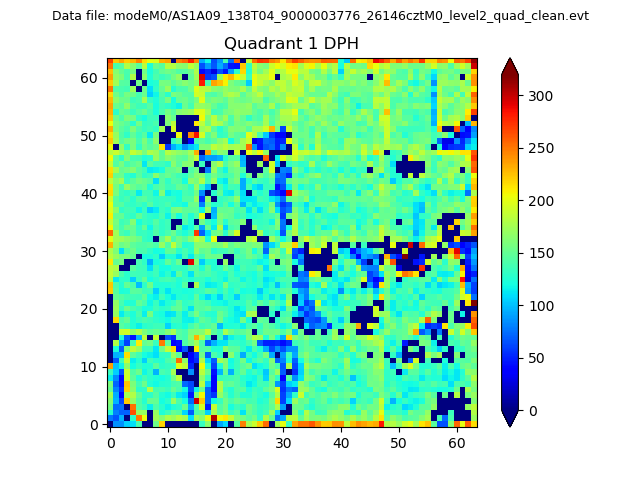 |
Quadrant B |
|---|---|---|---|
| Quadrant D | 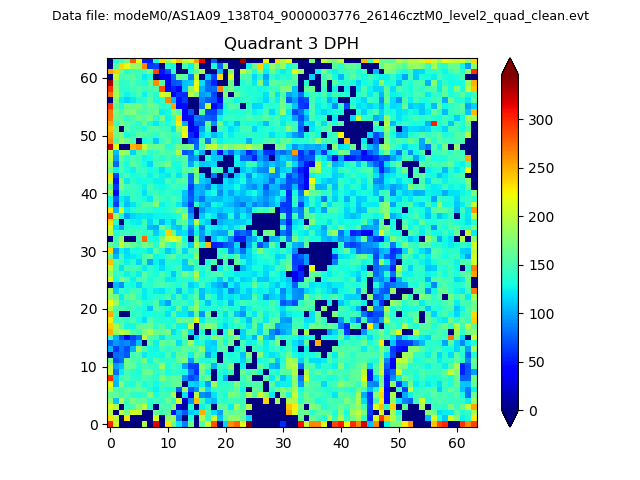 |
 |
Quadrant C |
| Plot type | Count rate plots | Images |
|---|---|---|
| Comparison with Poisson distribution Blue bars denote a histogram of data divided into 1 sec bins. Red curve is a Poisson curve with rate = median count rate of data. |
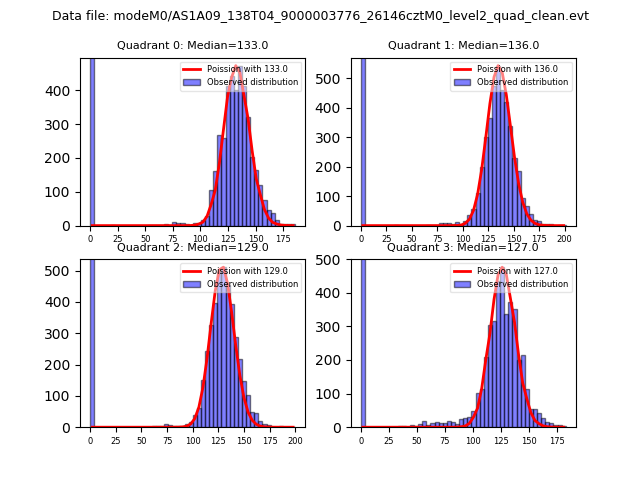 |
 |
| Quadrant-wise count rates Data is divided into 100 sec bins |
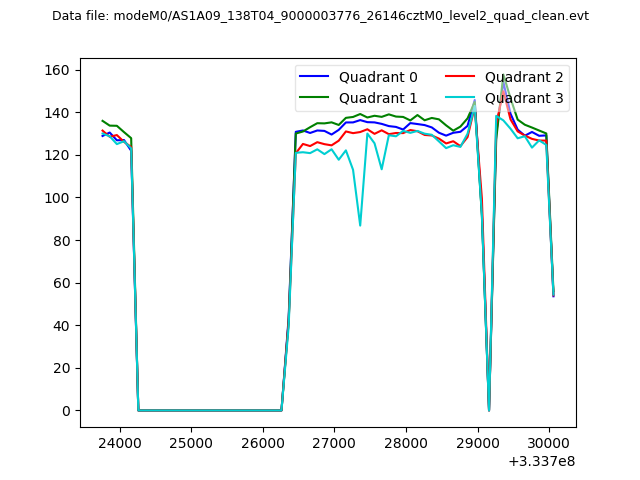 |
|
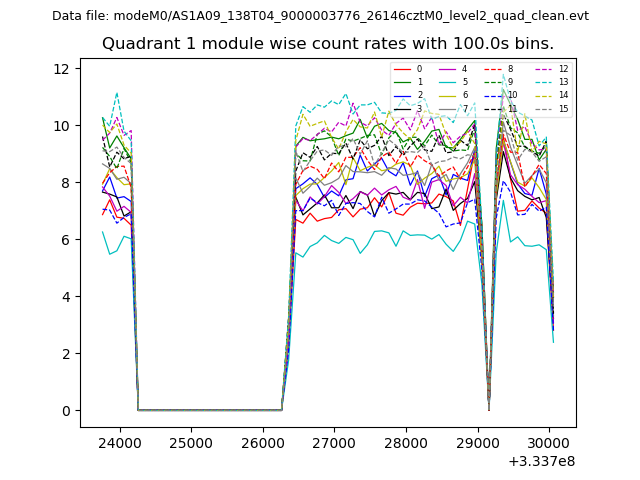
| Module-wise count rates for Quadrant A Data is divided into 100 sec bins |
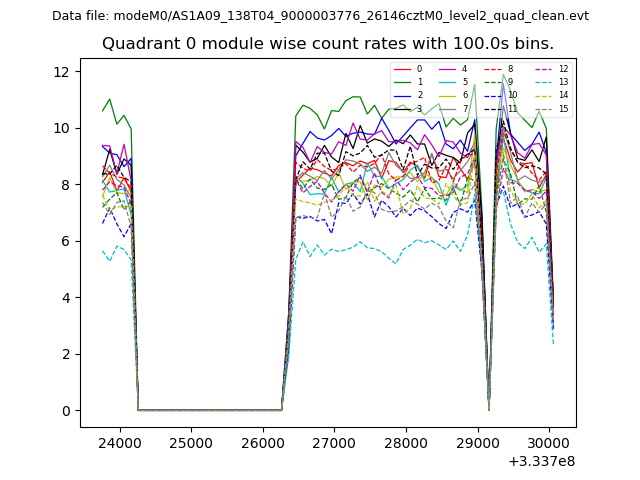 |
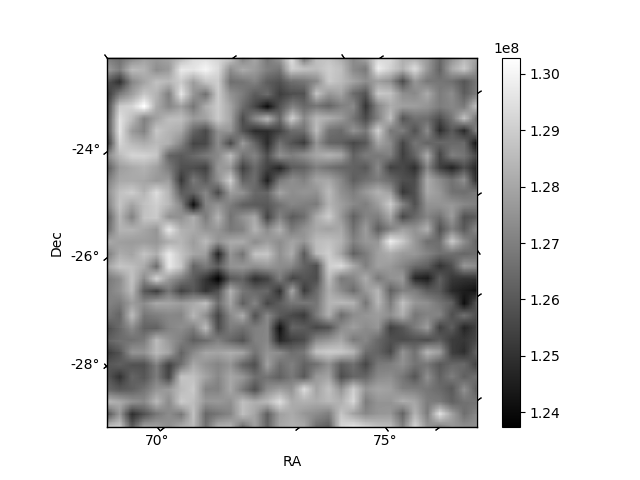 |
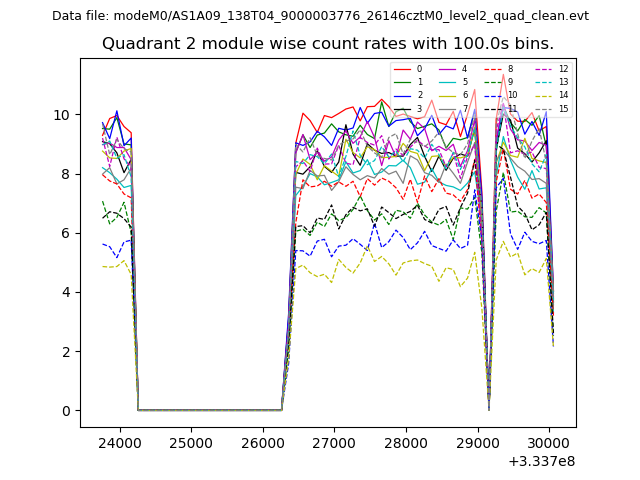
| Module-wise count rates for Quadrant B Data is divided into 100 sec bins |
 |
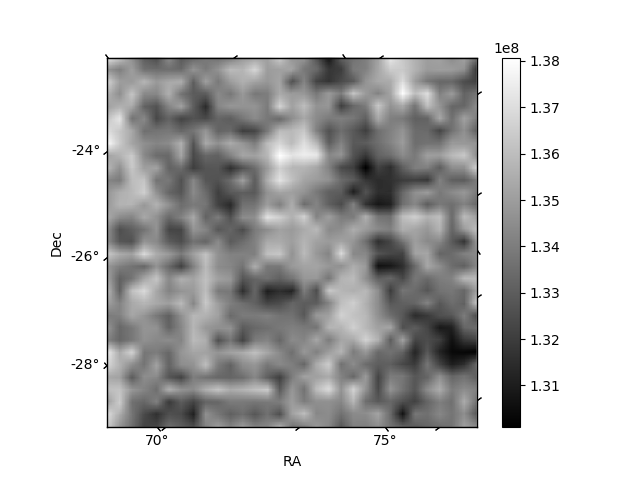 |
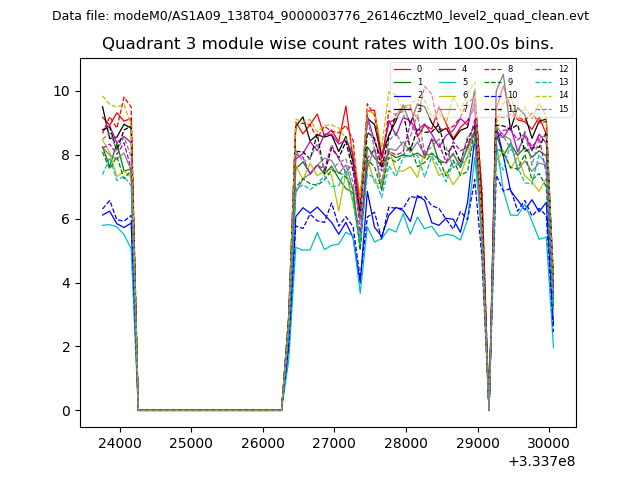
| Module-wise count rates for Quadrant C Data is divided into 100 sec bins |
 |
 |
| Module-wise count rates for Quadrant D Data is divided into 100 sec bins |
 |
 |
| Parameter | Plot |
|---|---|
| CZT HV Monitor | 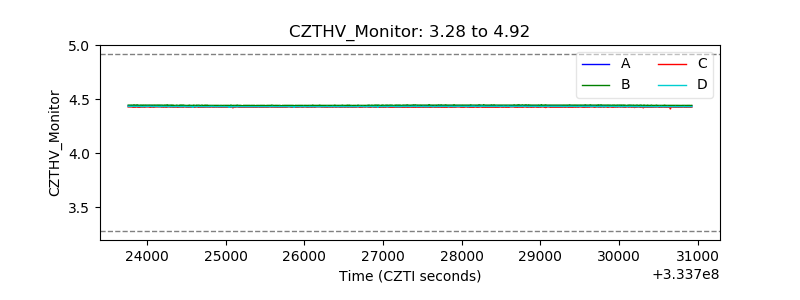 |
| D_VDD | 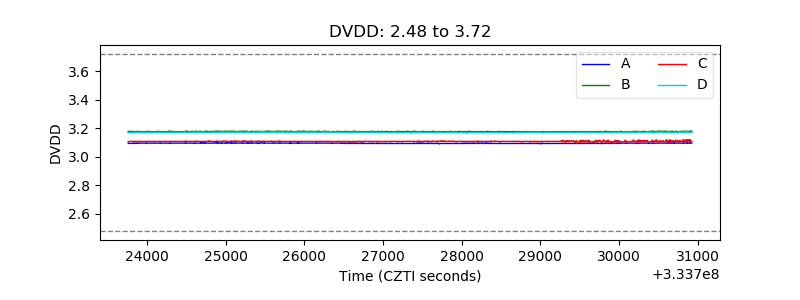 |
| Temperature 1 | 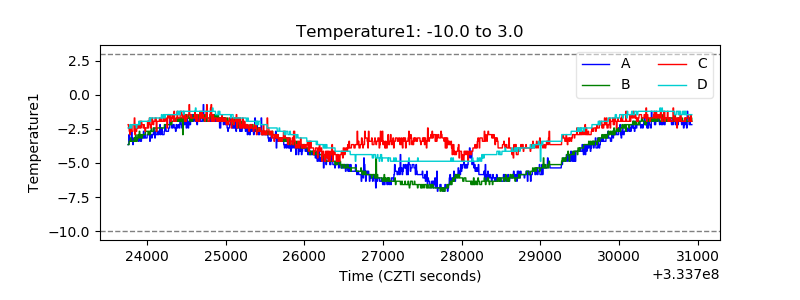 |
| Veto HV Monitor | 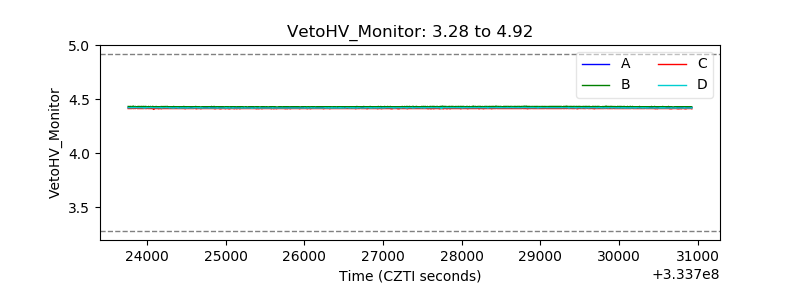 |
| Veto LLD | 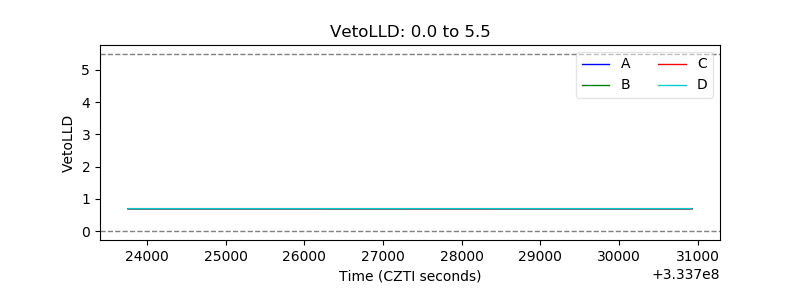 |
| Alpha Counter | 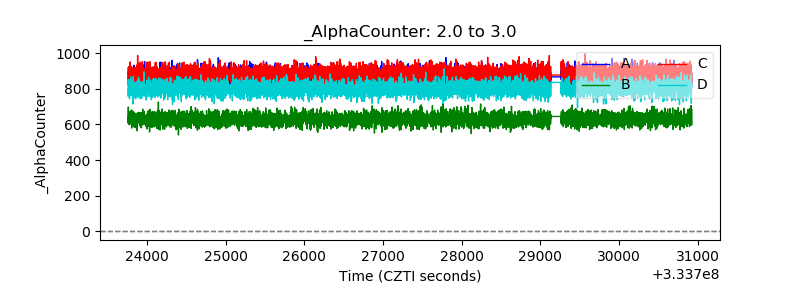 |
| _CPM_Rate | 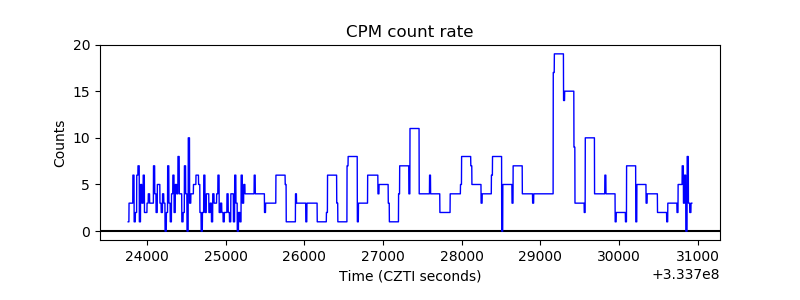 |
| CZT Counter | 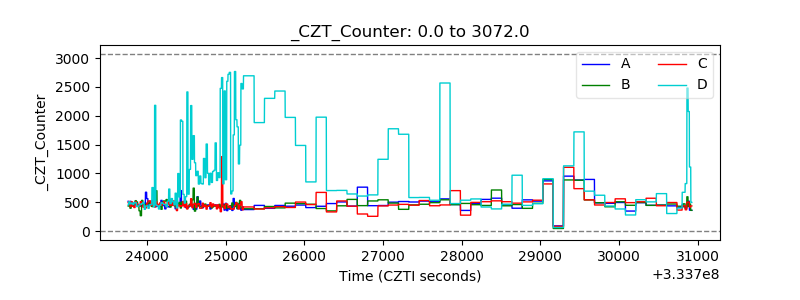 |
| +2.5 Volts monitor |  |
| +5 Volts monitor |  |
| _ROLL_ROT | 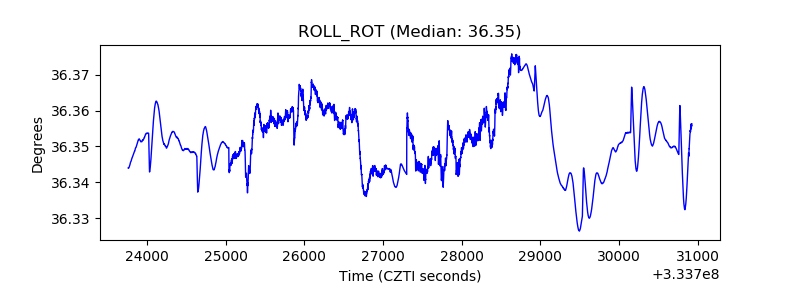 |
| _Roll_DEC | 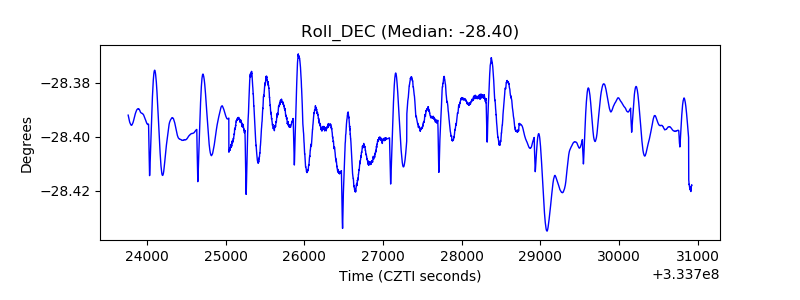 |
| _Roll_RA | 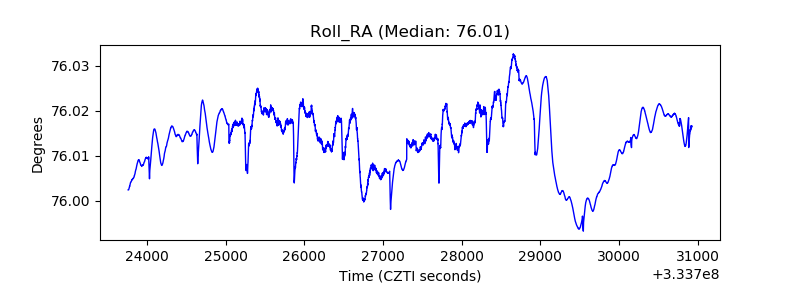 |
| Veto Counter | 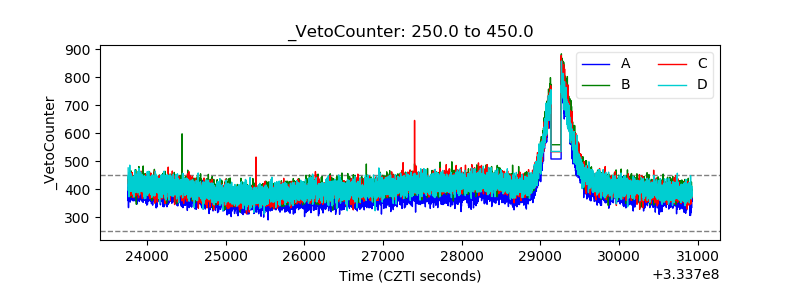 |