| Param | Original file | Final file |
|---|---|---|
| Filename | modeM0/AS1A09_138T04_9000003776_26147cztM0_level2.evt | modeM0/AS1A09_138T04_9000003776_26147cztM0_level2_quad_clean.evt |
| Size (bytes) | 652,904,640 | 86,405,760 |
| Size | 622.7 MB | 82.4 MB |
| Events in quadrant A | 3,664,182 | 539,272 |
| Events in quadrant B | 3,705,105 | 549,539 |
| Events in quadrant C | 3,732,935 | 525,003 |
| Events in quadrant D | 8,158,933 | 476,863 |
| Mode M9 | |||
|---|---|---|---|
| Quadrant | BADHDUFLAG | Total packets | Discarded packets |
| A | 0 | 3 | 0 |
| B | 0 | 3 | 0 |
| C | 0 | 3 | 0 |
| D | 0 | 3 | 0 |
| Mode M0 | |||
|---|---|---|---|
| Quadrant | BADHDUFLAG | Total packets | Discarded packets |
| A | 0 | 15721 | 0 |
| B | 0 | 15722 | 0 |
| C | 0 | 15774 | 0 |
| D | 0 | 29303 | 0 |
| Quadrant | Total seconds | Saturated seconds | Saturation percentage |
|---|---|---|---|
| A | 7549 | 105 | 1.390913% |
| B | 7549 | 138 | 1.828057% |
| C | 7548 | 129 | 1.709062% |
| D | 7549 | 1696 | 22.466552% |
Noise dominated data is calculated using 1-second bins in cleaned event files. If a bin has >2000 counts, and if more than 50% of those come from <1% of pixels, then it is considered to be noise-dominated and hence unusable.
| Quadrant | # 1 sec bins | Bins with >0 counts | Bins with >2000 counts | High rate bins dominated by noise | Noise dominated (total time) | Noise dominated (detector-on time) | Marked lightcurve |
|---|---|---|---|---|---|---|---|
| A | 7899 | 7550 | 1 | 1 | 0.01% | 0.01% | 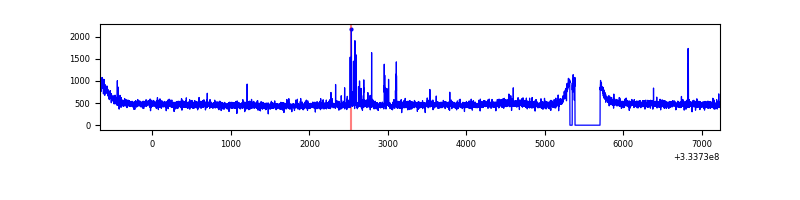 |
| B | 7899 | 7549 | 3 | 3 | 0.04% | 0.04% | 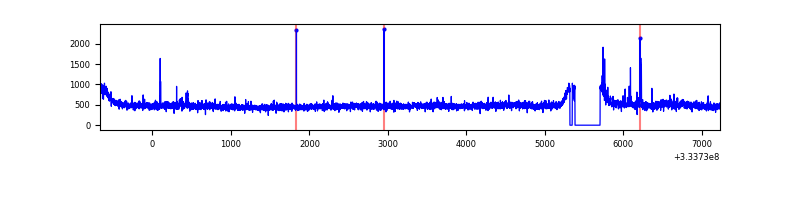 |
| C | 7897 | 7547 | 4 | 4 | 0.05% | 0.05% | 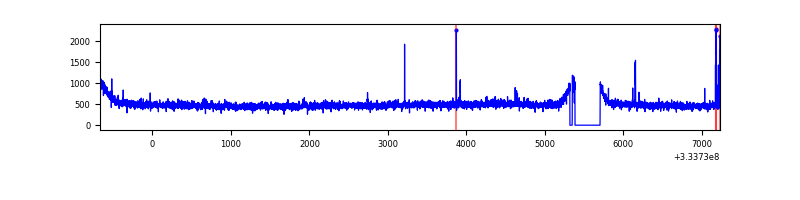 |
| D | 7899 | 7549 | 1582 | 1582 | 20.03% | 20.96% | 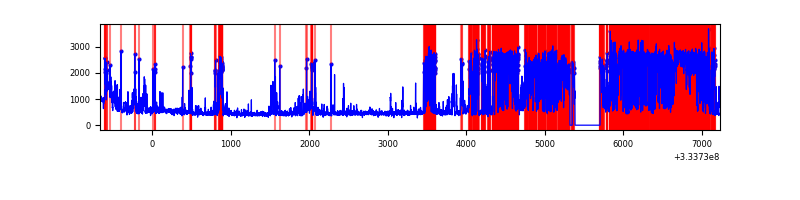 |
Top three noisy pixels from each quadrant. If the there are fewer than three noisy pixels in the level2.evt file, extra rows are filled as -1
| Pixel properties | Quadrant properties | ||||||
|---|---|---|---|---|---|---|---|
| Quadrant | DetID | PixID | Counts | Sigma | Mean | Median | Sigma |
| A | 0 | 13 | 56947 | 295.61 | 936 | 915 | 189.5 |
| A | 13 | 254 | 11794 | 57.4 | 936 | 915 | 189.5 |
| A | 3 | 137 | 8916 | 42.21 | 936 | 915 | 189.5 |
| B | 0 | 190 | 26649 | 143.48 | 923 | 899 | 179.5 |
| B | 12 | 111 | 22248 | 118.96 | 923 | 899 | 179.5 |
| B | 11 | 111 | 19974 | 106.29 | 923 | 899 | 179.5 |
| C | 14 | 238 | 141361 | 664.57 | 891 | 898 | 211.4 |
| C | 3 | 233 | 76350 | 356.99 | 891 | 898 | 211.4 |
| C | 13 | 250 | 19149 | 86.35 | 891 | 898 | 211.4 |
| D | 1 | 52 | 4801316 | 24695.37 | 817 | 800 | 194.4 |
| D | 1 | 3 | 203011 | 1040.24 | 817 | 800 | 194.4 |
| D | 2 | 234 | 31434 | 157.59 | 817 | 800 | 194.4 |
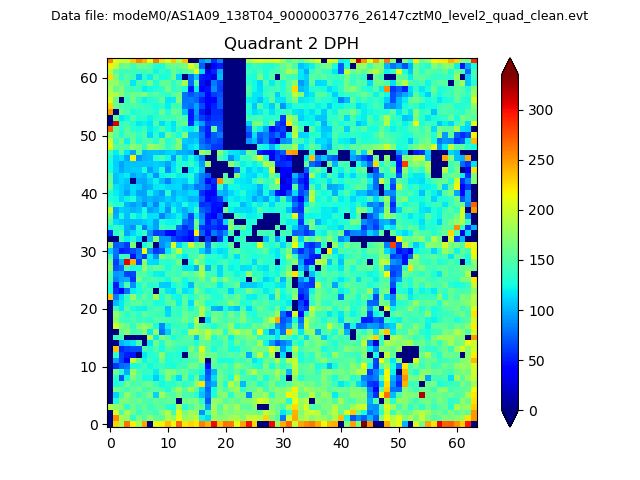
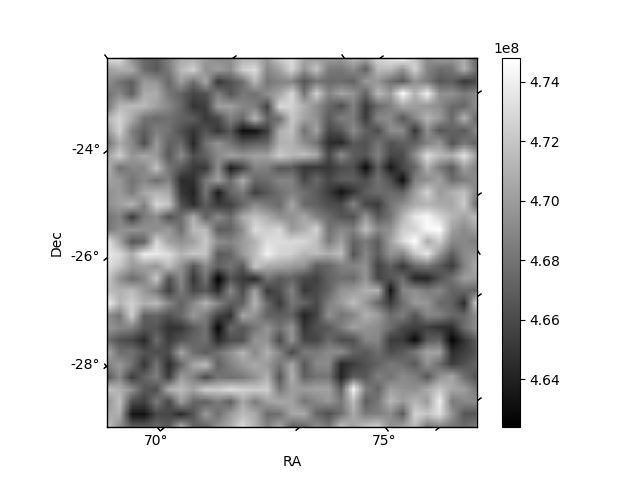
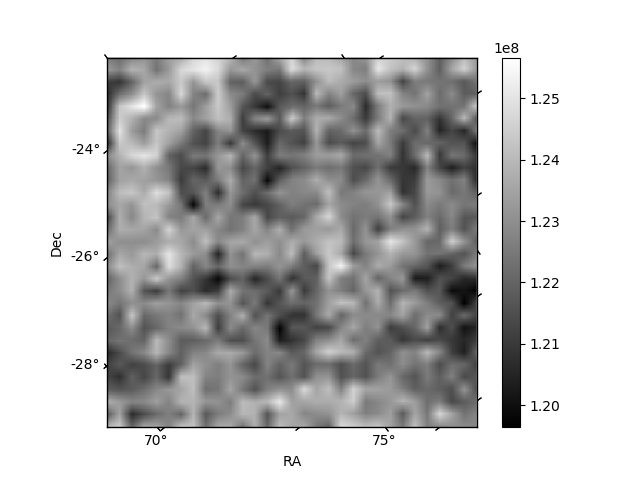
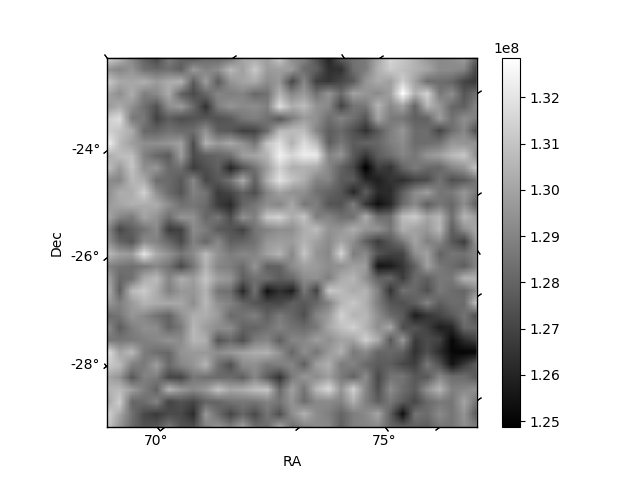
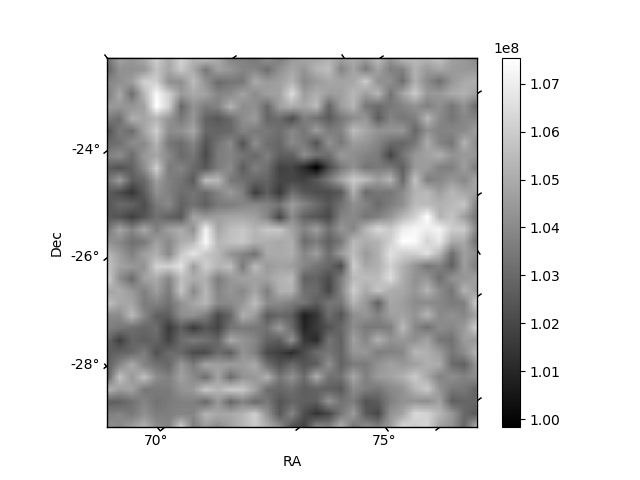
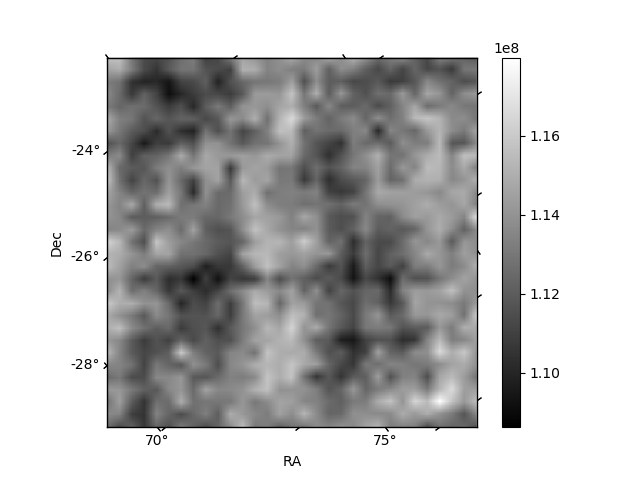
Histogram calculated using DETX and DETY for each event in the final _common_clean file
| Quadrant A | 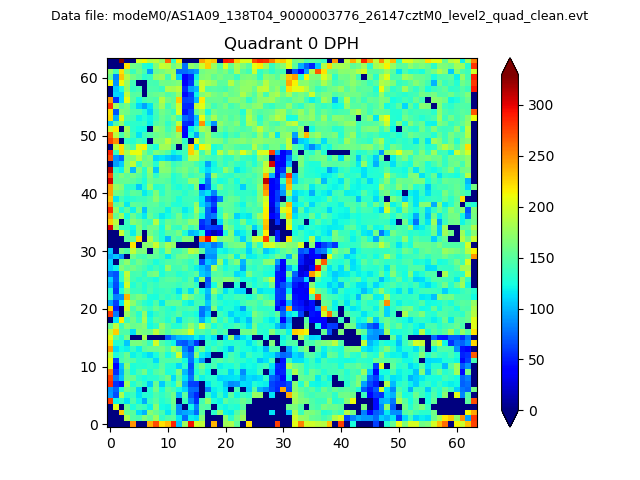 |
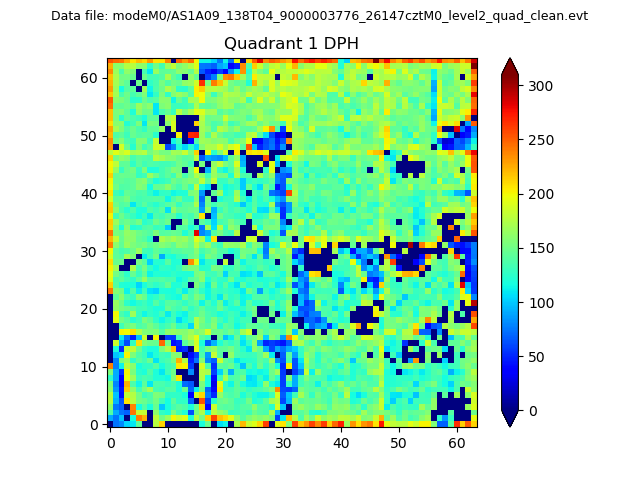 |
Quadrant B |
|---|---|---|---|
| Quadrant D | 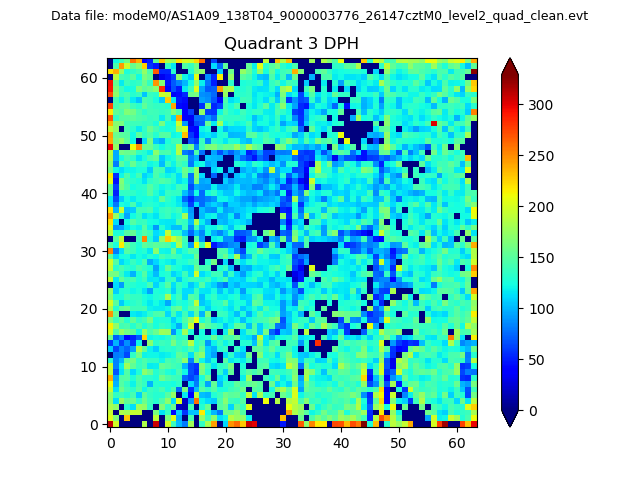 |
 |
Quadrant C |
| Plot type | Count rate plots | Images |
|---|---|---|
| Comparison with Poisson distribution Blue bars denote a histogram of data divided into 1 sec bins. Red curve is a Poisson curve with rate = median count rate of data. |
 |
 |
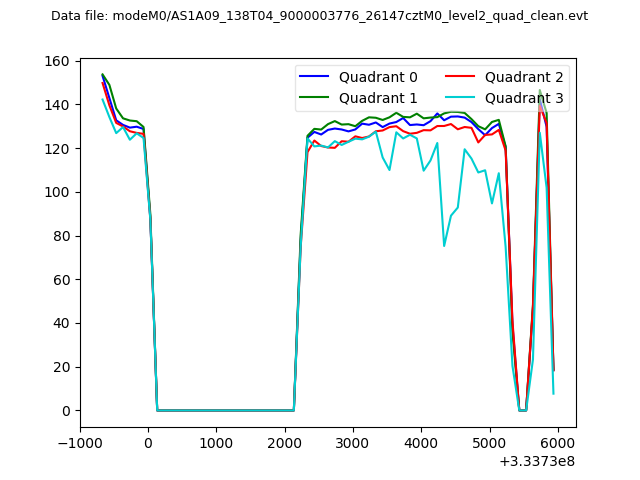
| Quadrant-wise count rates Data is divided into 100 sec bins |
 |
|
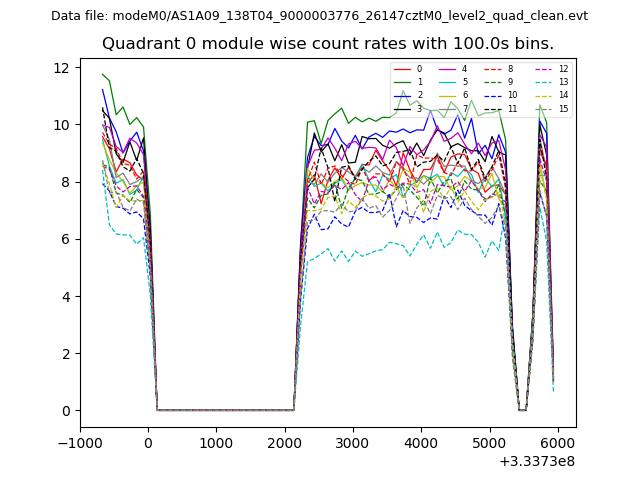
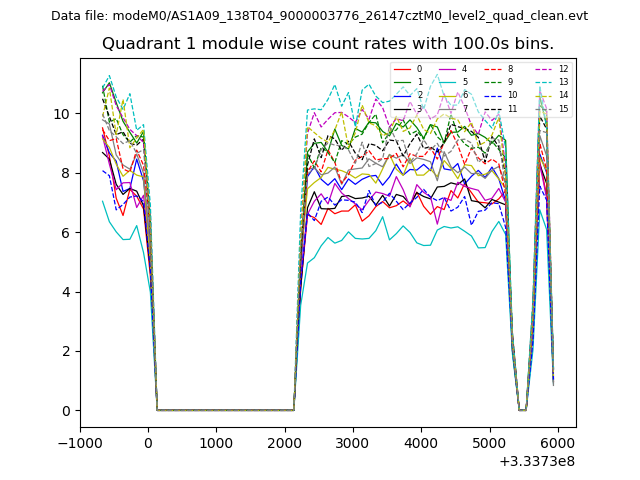
| Module-wise count rates for Quadrant A Data is divided into 100 sec bins |
 |
 |
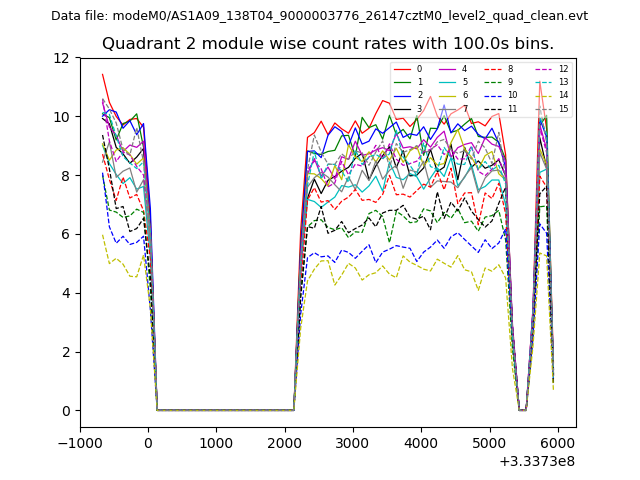
| Module-wise count rates for Quadrant B Data is divided into 100 sec bins |
 |
 |
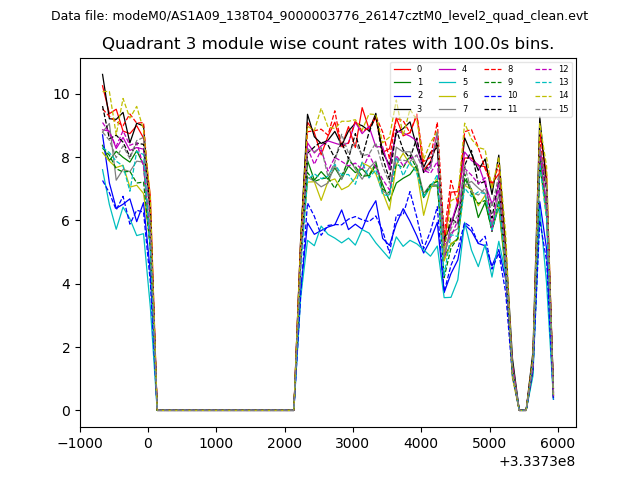
| Module-wise count rates for Quadrant C Data is divided into 100 sec bins |
 |
 |
| Module-wise count rates for Quadrant D Data is divided into 100 sec bins |
 |
 |
| Parameter | Plot |
|---|---|
| CZT HV Monitor | 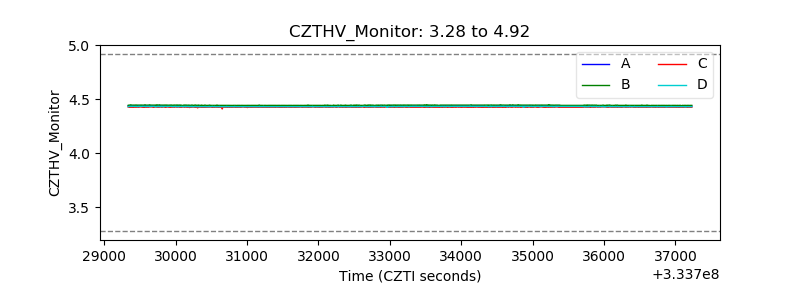 |
| D_VDD | 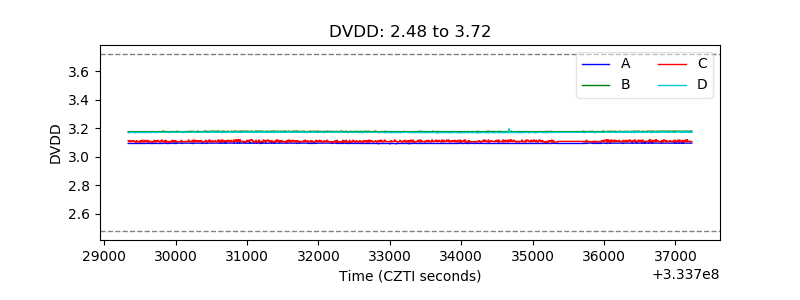 |
| Temperature 1 | 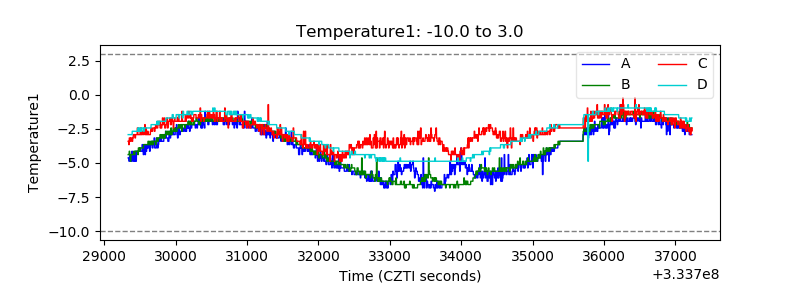 |
| Veto HV Monitor | 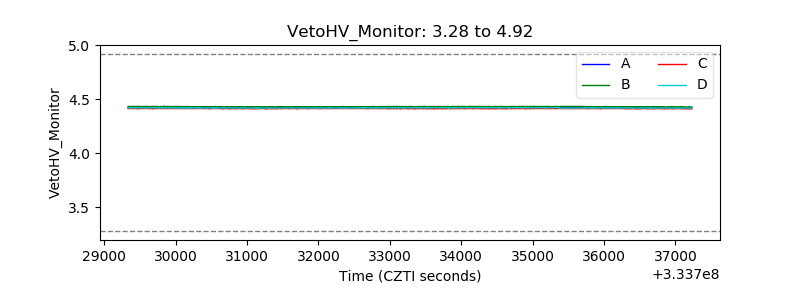 |
| Veto LLD | 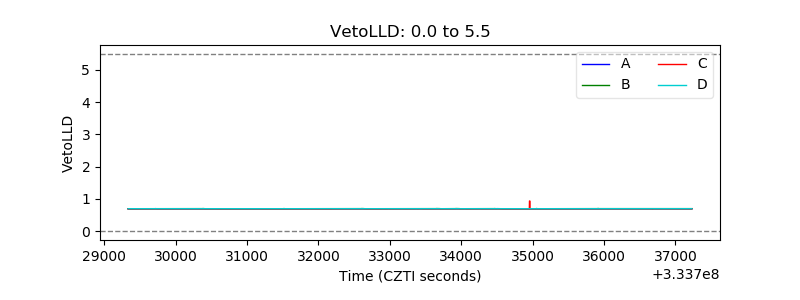 |
| Alpha Counter | 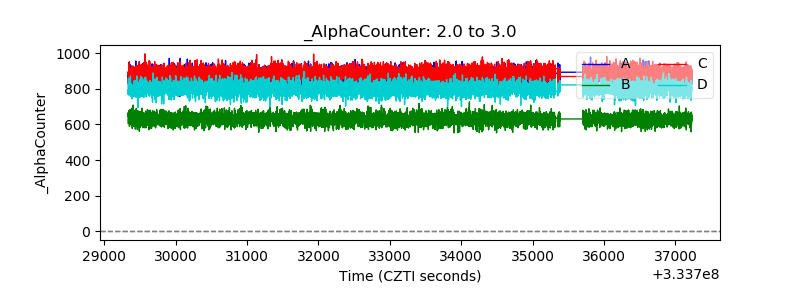 |
| _CPM_Rate | 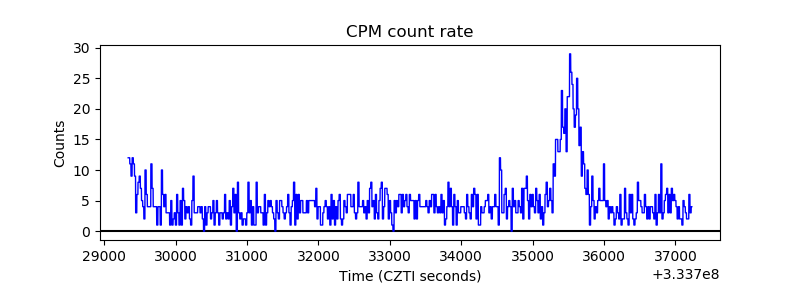 |
| CZT Counter | 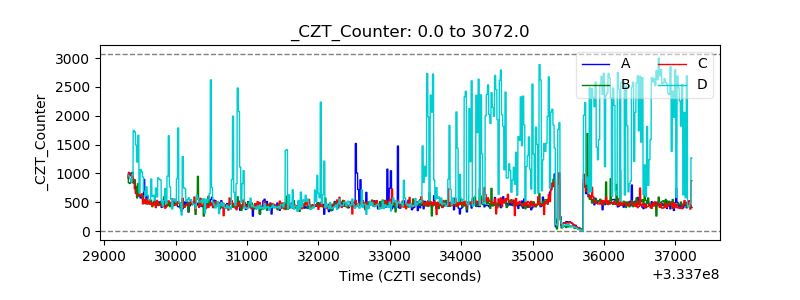 |
| +2.5 Volts monitor |  |
| +5 Volts monitor | 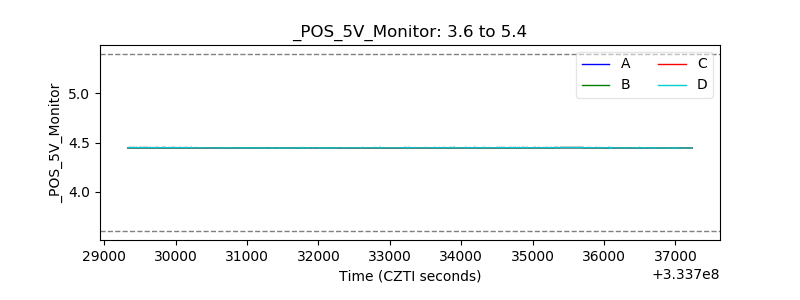 |
| _ROLL_ROT | 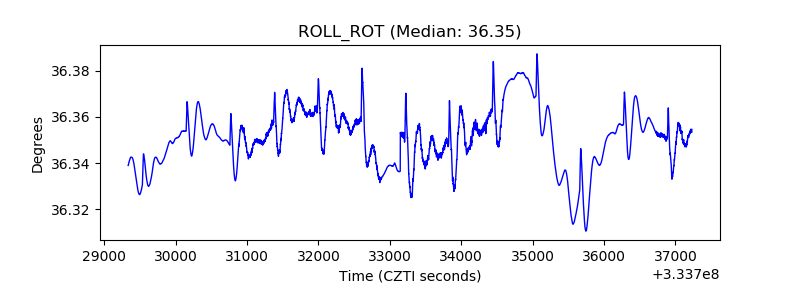 |
| _Roll_DEC | 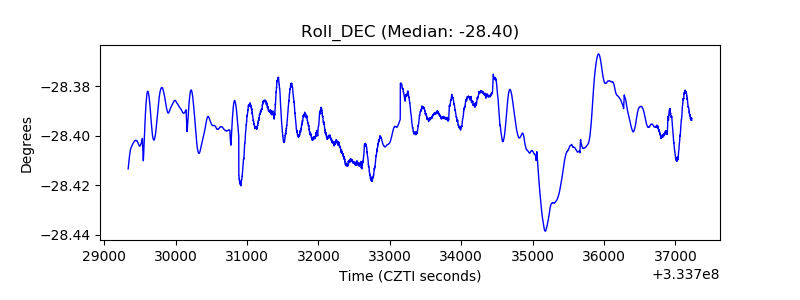 |
| _Roll_RA | 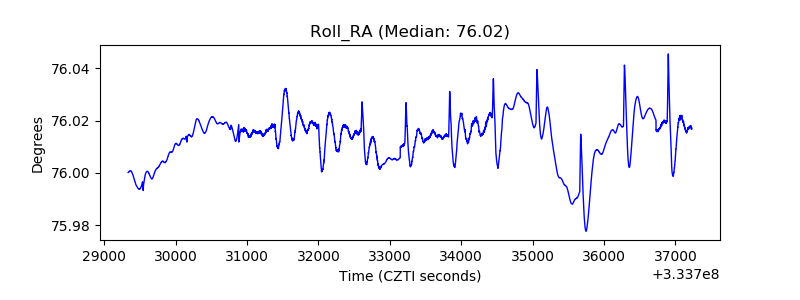 |
| Veto Counter | 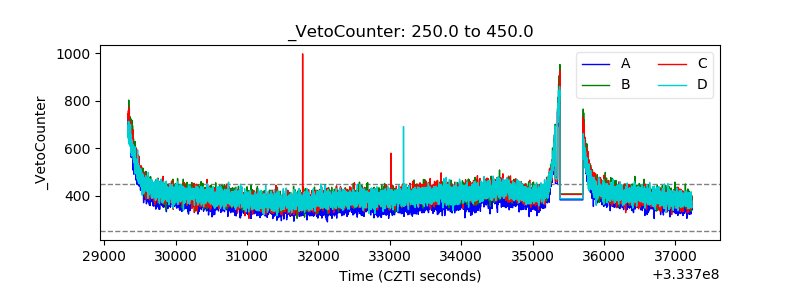 |