| Param | Original file | Final file |
|---|---|---|
| Filename | modeM0/AS1A09_138T04_9000003776_26149cztM0_level2.evt | modeM0/AS1A09_138T04_9000003776_26149cztM0_level2_quad_clean.evt |
| Size (bytes) | 892,080,000 | 106,968,960 |
| Size | 850.8 MB | 102.0 MB |
| Events in quadrant A | 7,815,462 | 608,507 |
| Events in quadrant B | 4,525,256 | 694,096 |
| Events in quadrant C | 4,760,463 | 653,421 |
| Events in quadrant D | 9,276,055 | 626,709 |
| Mode M9 | |||
|---|---|---|---|
| Quadrant | BADHDUFLAG | Total packets | Discarded packets |
| A | 0 | 5 | 0 |
| B | 0 | 5 | 0 |
| C | 0 | 5 | 0 |
| D | 0 | 5 | 0 |
| Mode M0 | |||
|---|---|---|---|
| Quadrant | BADHDUFLAG | Total packets | Discarded packets |
| A | 0 | 29305 | 0 |
| B | 0 | 19444 | 0 |
| C | 0 | 19968 | 0 |
| D | 0 | 33981 | 0 |
| Quadrant | Total seconds | Saturated seconds | Saturation percentage |
|---|---|---|---|
| A | 9452 | 1441 | 15.245451% |
| B | 9453 | 61 | 0.645298% |
| C | 9453 | 137 | 1.449275% |
| D | 9453 | 1582 | 16.735428% |
Noise dominated data is calculated using 1-second bins in cleaned event files. If a bin has >2000 counts, and if more than 50% of those come from <1% of pixels, then it is considered to be noise-dominated and hence unusable.
| Quadrant | # 1 sec bins | Bins with >0 counts | Bins with >2000 counts | High rate bins dominated by noise | Noise dominated (total time) | Noise dominated (detector-on time) | Marked lightcurve |
|---|---|---|---|---|---|---|---|
| A | 9961 | 9451 | 1372 | 1372 | 13.77% | 14.52% | 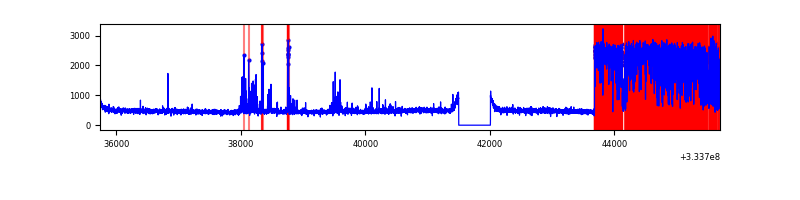 |
| B | 9963 | 9453 | 1 | 1 | 0.01% | 0.01% | 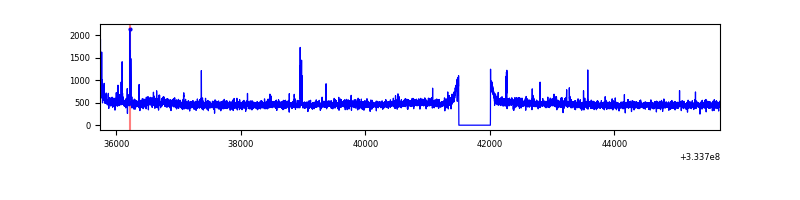 |
| C | 9963 | 9453 | 45 | 45 | 0.45% | 0.48% | 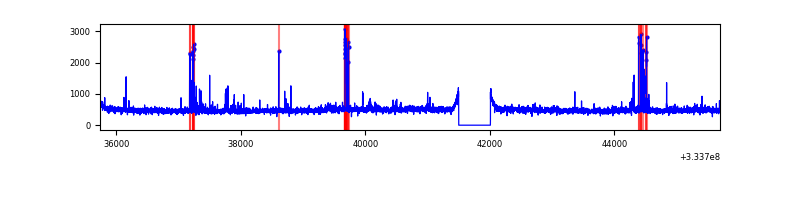 |
| D | 9963 | 9453 | 1546 | 1546 | 15.52% | 16.35% | 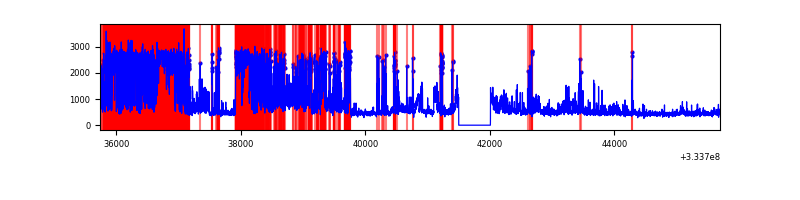 |
Top three noisy pixels from each quadrant. If the there are fewer than three noisy pixels in the level2.evt file, extra rows are filled as -1
| Pixel properties | Quadrant properties | ||||||
|---|---|---|---|---|---|---|---|
| Quadrant | DetID | PixID | Counts | Sigma | Mean | Median | Sigma |
| A | 0 | 13 | 3721810 | 17331.77 | 1061 | 1037 | 214.7 |
| A | 13 | 254 | 14023 | 60.49 | 1061 | 1037 | 214.7 |
| A | 3 | 137 | 10136 | 42.38 | 1061 | 1037 | 214.7 |
| B | 0 | 229 | 44792 | 202.19 | 1127 | 1101 | 216.1 |
| B | 0 | 190 | 35891 | 161.0 | 1127 | 1101 | 216.1 |
| B | 12 | 111 | 26629 | 118.14 | 1127 | 1101 | 216.1 |
| C | 3 | 233 | 206784 | 805.02 | 1083 | 1091 | 255.5 |
| C | 14 | 238 | 172905 | 672.43 | 1083 | 1091 | 255.5 |
| C | 13 | 250 | 78939 | 304.67 | 1083 | 1091 | 255.5 |
| D | 1 | 52 | 5323495 | 21838.7 | 1016 | 992 | 243.7 |
| D | 2 | 234 | 39853 | 159.45 | 1016 | 992 | 243.7 |
| D | 12 | 233 | 26834 | 106.03 | 1016 | 992 | 243.7 |
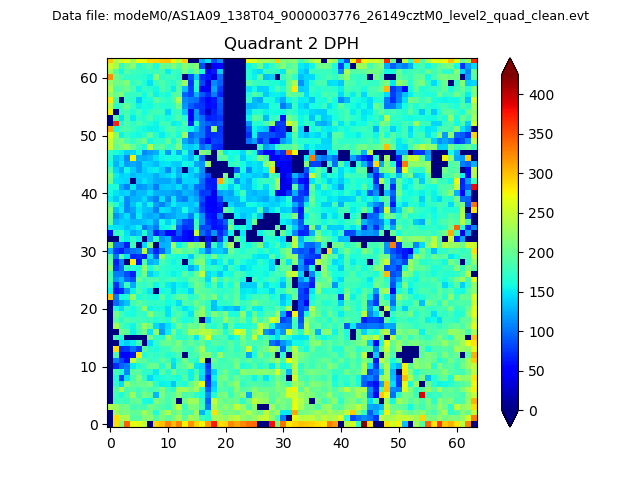
Histogram calculated using DETX and DETY for each event in the final _common_clean file
| Quadrant A | 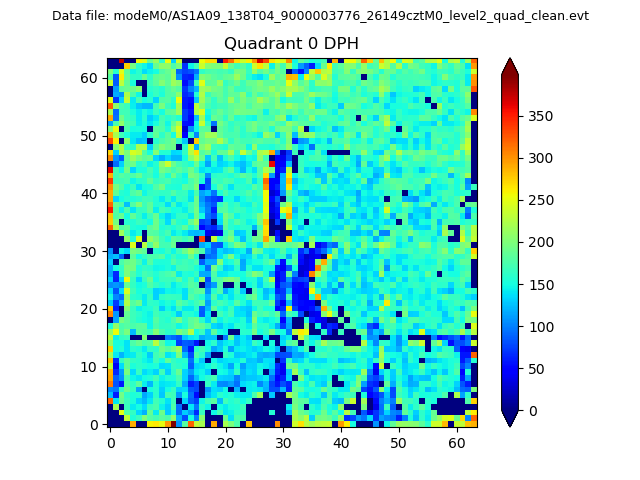 |
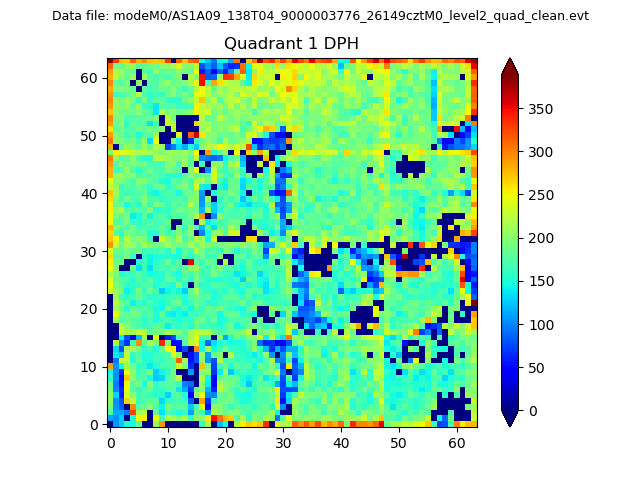 |
Quadrant B |
|---|---|---|---|
| Quadrant D | 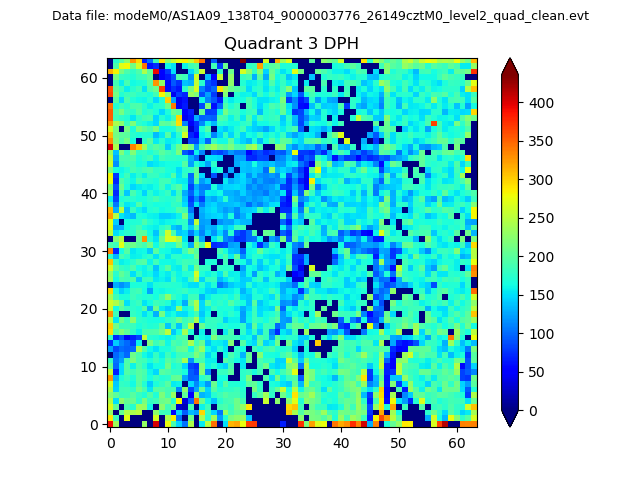 |
 |
Quadrant C |
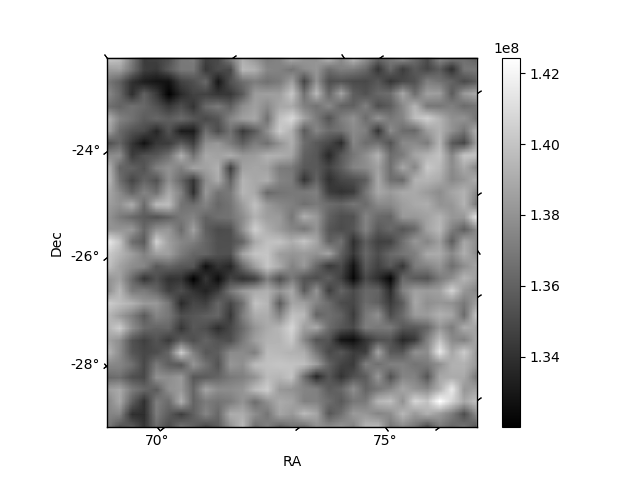
| Plot type | Count rate plots | Images |
|---|---|---|
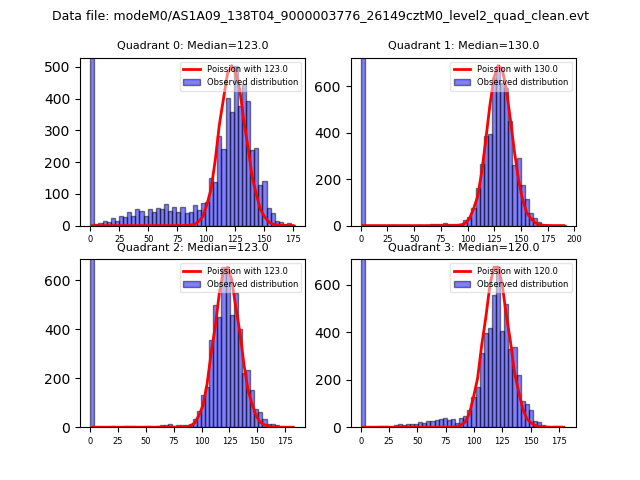
| Comparison with Poisson distribution Blue bars denote a histogram of data divided into 1 sec bins. Red curve is a Poisson curve with rate = median count rate of data. |
 |
 |
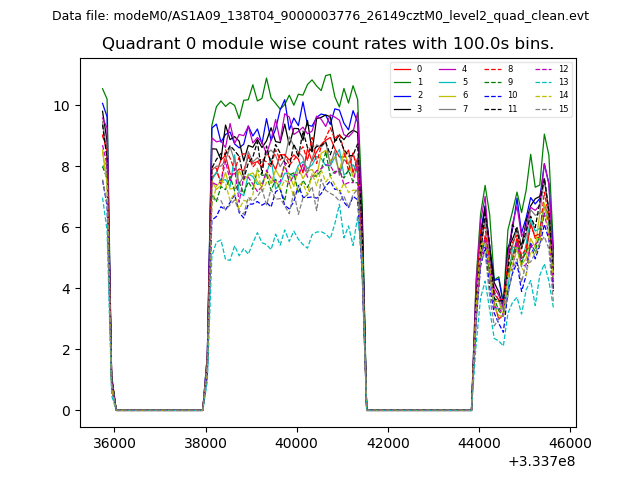
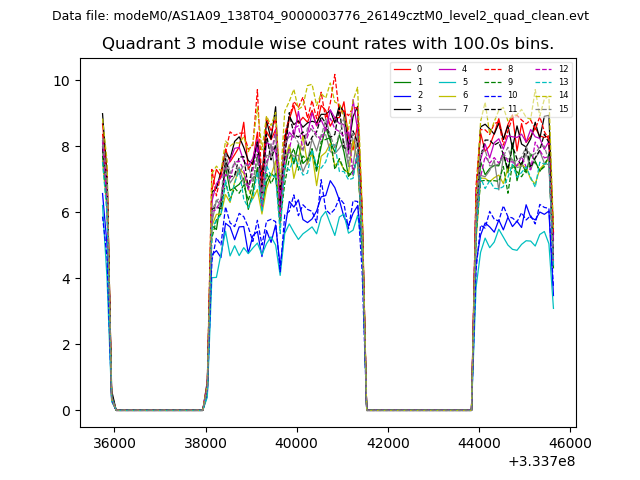
| Quadrant-wise count rates Data is divided into 100 sec bins |
 |
|
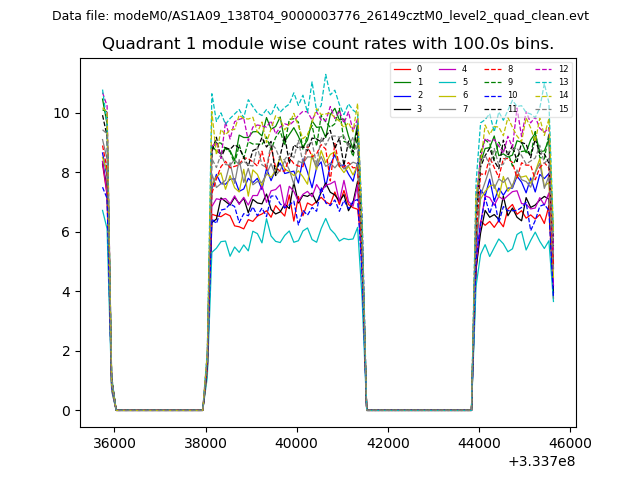
| Module-wise count rates for Quadrant A Data is divided into 100 sec bins |
 |
 |
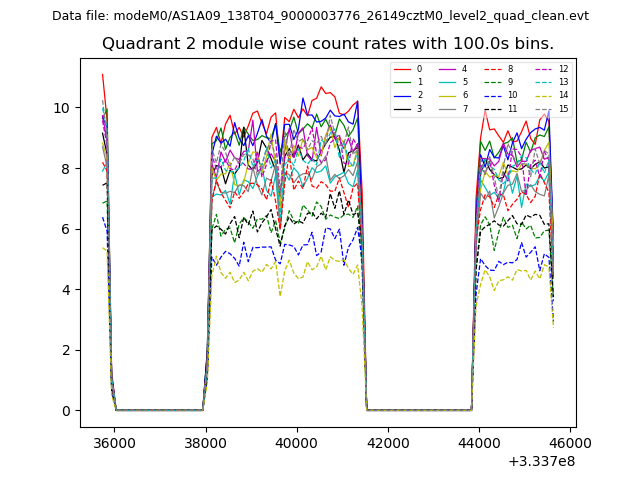
| Module-wise count rates for Quadrant B Data is divided into 100 sec bins |
 |
 |
| Module-wise count rates for Quadrant C Data is divided into 100 sec bins |
 |
 |
| Module-wise count rates for Quadrant D Data is divided into 100 sec bins |
 |
 |
| Parameter | Plot |
|---|---|
| CZT HV Monitor | 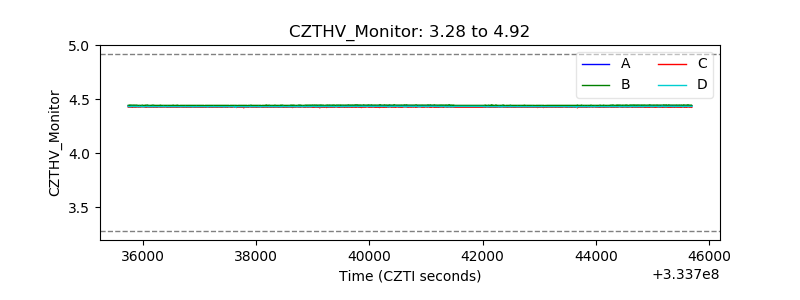 |
| D_VDD | 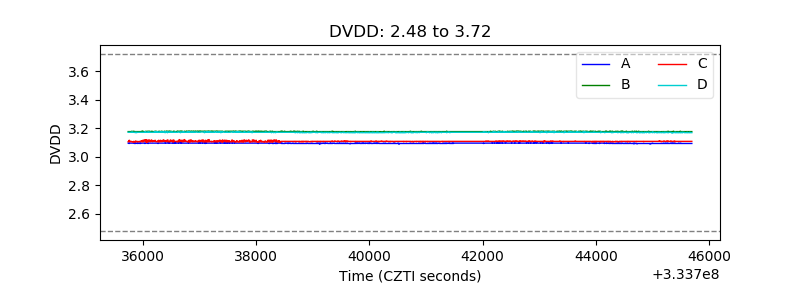 |
| Temperature 1 | 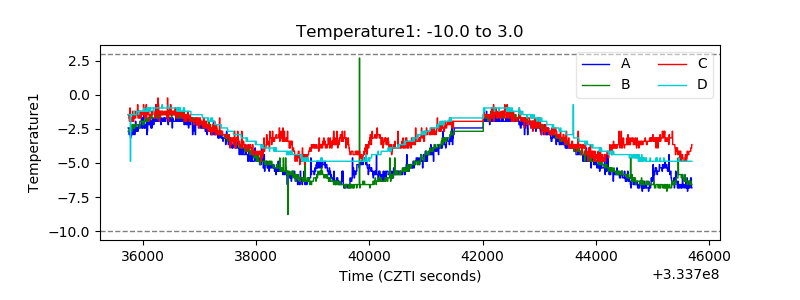 |
| Veto HV Monitor | 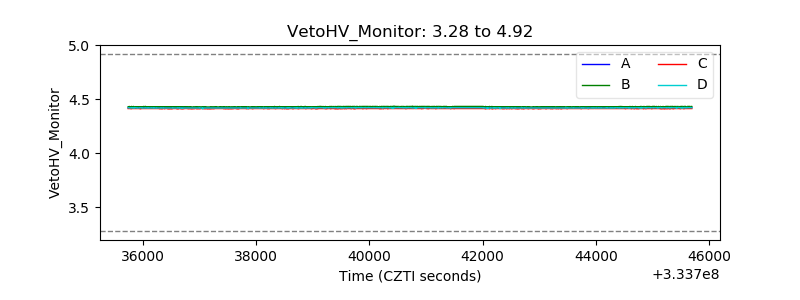 |
| Veto LLD | 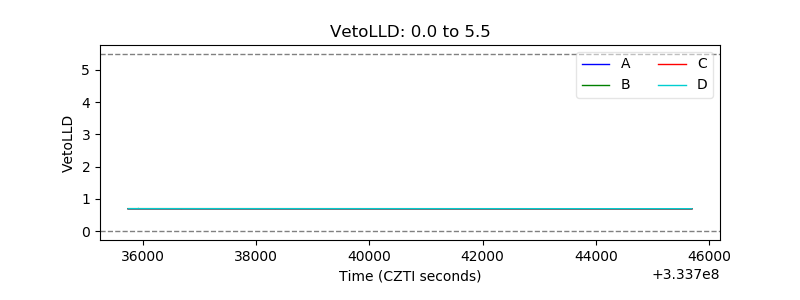 |
| Alpha Counter |  |
| _CPM_Rate |  |
| CZT Counter | 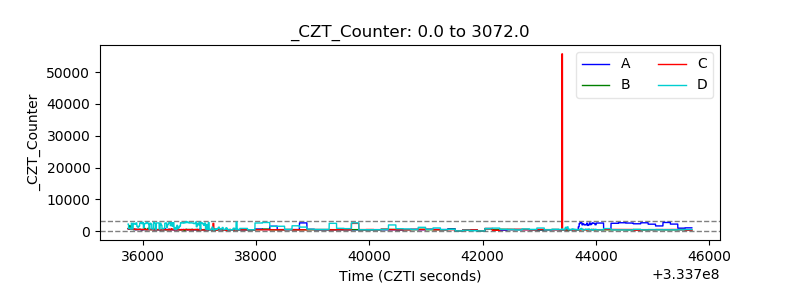 |
| +2.5 Volts monitor |  |
| +5 Volts monitor |  |
| _ROLL_ROT | 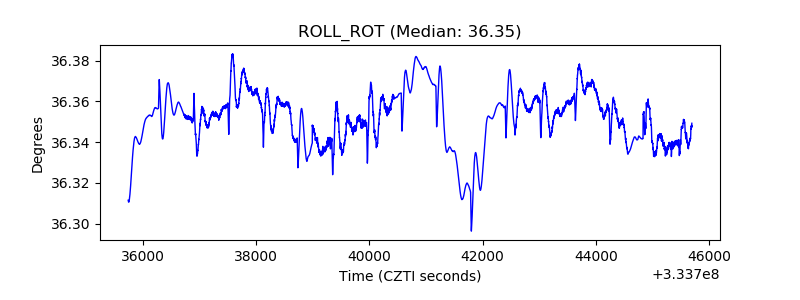 |
| _Roll_DEC | 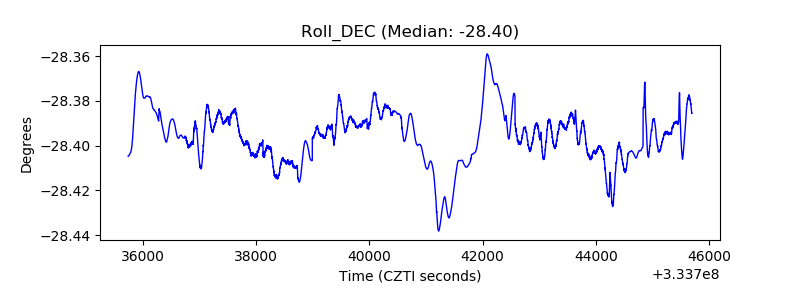 |
| _Roll_RA | 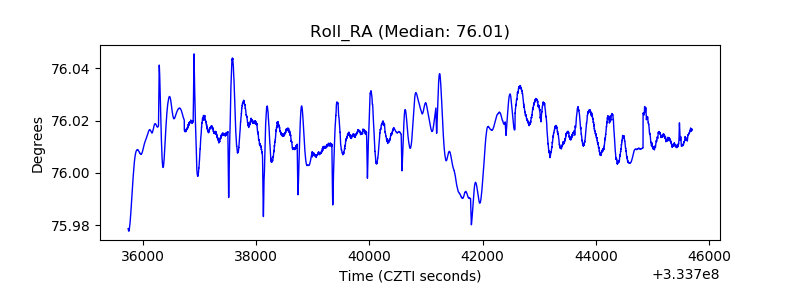 |
| Veto Counter | 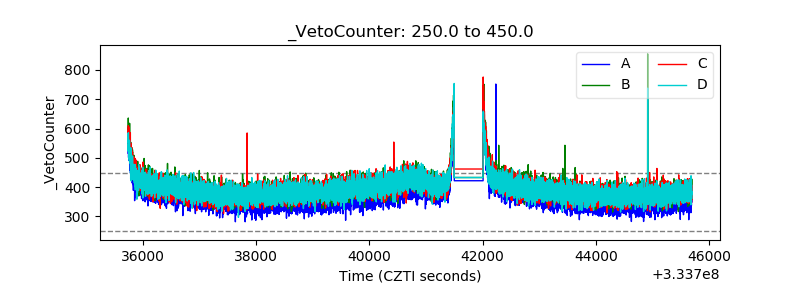 |