| Param | Original file | Final file |
|---|---|---|
| Filename | modeM0/AS1A09_138T04_9000003776_26150cztM0_level2.evt | modeM0/AS1A09_138T04_9000003776_26150cztM0_level2_quad_clean.evt |
| Size (bytes) | 752,878,080 | 125,729,280 |
| Size | 718.0 MB | 119.9 MB |
| Events in quadrant A | 7,801,300 | 786,990 |
| Events in quadrant B | 4,476,283 | 827,089 |
| Events in quadrant C | 4,524,309 | 782,950 |
| Events in quadrant D | 5,382,677 | 778,718 |
| Mode M9 | |||
|---|---|---|---|
| Quadrant | BADHDUFLAG | Total packets | Discarded packets |
| A | 0 | 16 | 0 |
| B | 0 | 16 | 0 |
| C | 0 | 16 | 0 |
| D | 0 | 16 | 0 |
| Mode M0 | |||
|---|---|---|---|
| Quadrant | BADHDUFLAG | Total packets | Discarded packets |
| A | 0 | 29181 | 0 |
| B | 0 | 18956 | 0 |
| C | 0 | 18837 | 0 |
| D | 0 | 22012 | 0 |
| Quadrant | Total seconds | Saturated seconds | Saturation percentage |
|---|---|---|---|
| A | 9108 | 1174 | 12.889767% |
| B | 9109 | 78 | 0.856296% |
| C | 9109 | 106 | 1.163684% |
| D | 9109 | 141 | 1.547920% |
Noise dominated data is calculated using 1-second bins in cleaned event files. If a bin has >2000 counts, and if more than 50% of those come from <1% of pixels, then it is considered to be noise-dominated and hence unusable.
| Quadrant | # 1 sec bins | Bins with >0 counts | Bins with >2000 counts | High rate bins dominated by noise | Noise dominated (total time) | Noise dominated (detector-on time) | Marked lightcurve |
|---|---|---|---|---|---|---|---|
| A | 10653 | 9108 | 862 | 862 | 8.09% | 9.46% | 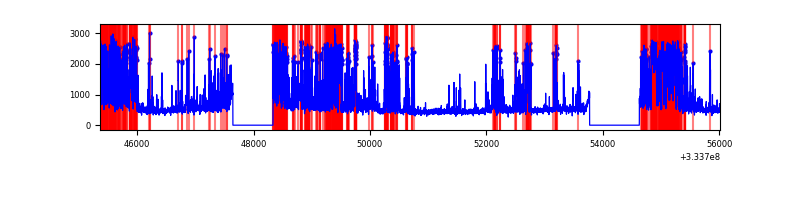 |
| B | 10654 | 9109 | 3 | 3 | 0.03% | 0.03% | 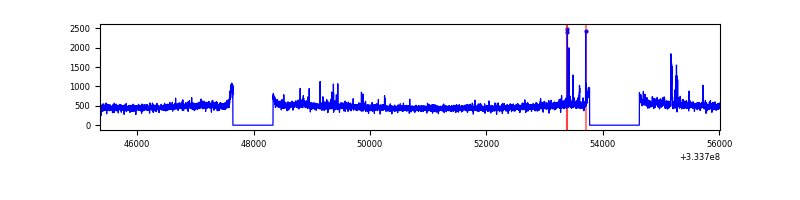 |
| C | 10654 | 9109 | 0 | 0 | 0.00% | 0.00% | 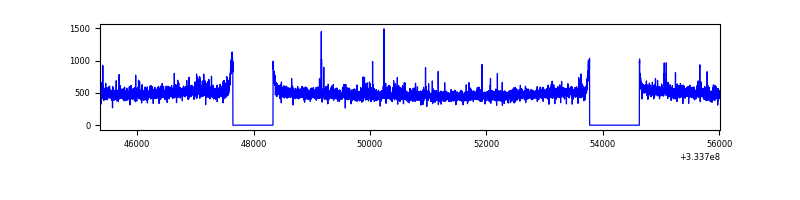 |
| D | 10654 | 9109 | 61 | 61 | 0.57% | 0.67% | 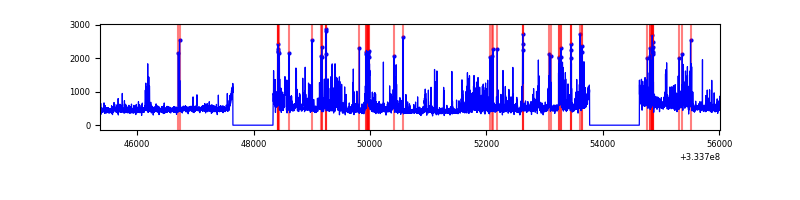 |
Top three noisy pixels from each quadrant. If the there are fewer than three noisy pixels in the level2.evt file, extra rows are filled as -1
| Pixel properties | Quadrant properties | ||||||
|---|---|---|---|---|---|---|---|
| Quadrant | DetID | PixID | Counts | Sigma | Mean | Median | Sigma |
| A | 0 | 13 | 3713202 | 17320.12 | 1060 | 1037 | 214.3 |
| A | 13 | 254 | 13353 | 57.46 | 1060 | 1037 | 214.3 |
| A | 3 | 137 | 9851 | 41.12 | 1060 | 1037 | 214.3 |
| B | 0 | 190 | 74154 | 337.92 | 1115 | 1085 | 216.2 |
| B | 12 | 111 | 26113 | 115.74 | 1115 | 1085 | 216.2 |
| B | 11 | 111 | 23230 | 102.41 | 1115 | 1085 | 216.2 |
| C | 14 | 238 | 172144 | 675.98 | 1077 | 1082 | 253.1 |
| C | 13 | 250 | 79626 | 310.38 | 1077 | 1082 | 253.1 |
| C | 3 | 233 | 46203 | 178.3 | 1077 | 1082 | 253.1 |
| D | 1 | 52 | 1157008 | 4420.57 | 1089 | 1062 | 261.5 |
| D | 8 | 195 | 56384 | 211.56 | 1089 | 1062 | 261.5 |
| D | 2 | 234 | 40170 | 149.56 | 1089 | 1062 | 261.5 |
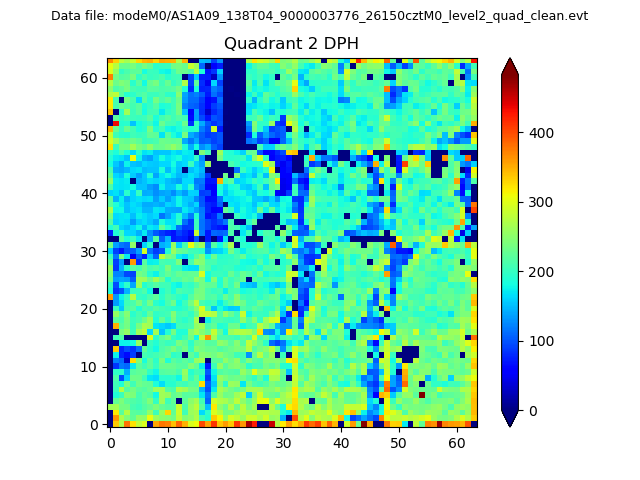
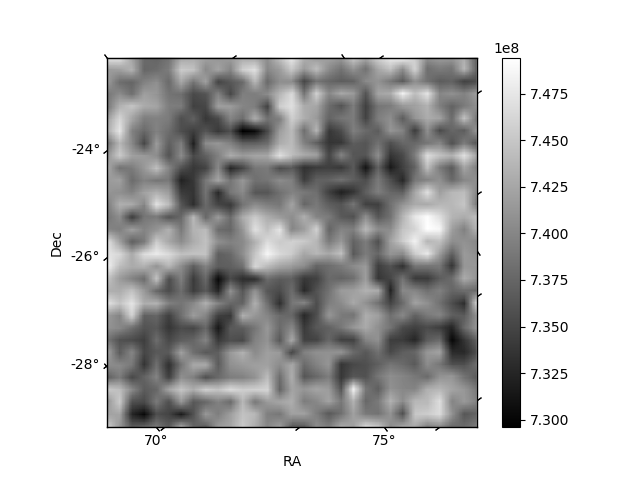
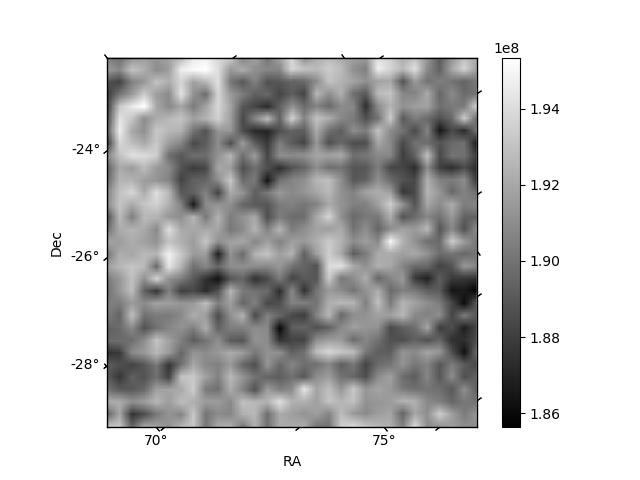
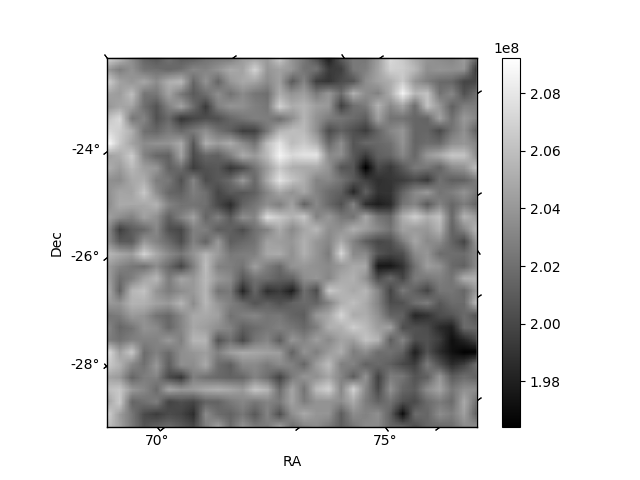
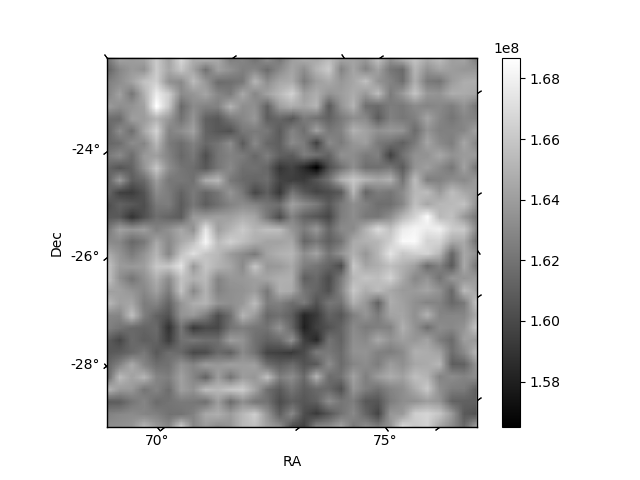
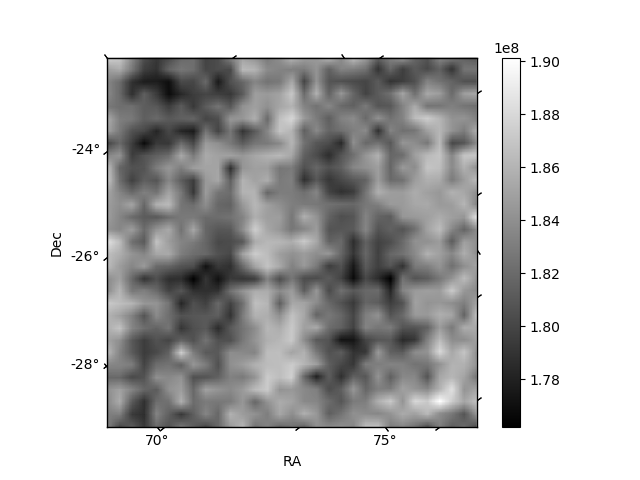
Histogram calculated using DETX and DETY for each event in the final _common_clean file
| Quadrant A | 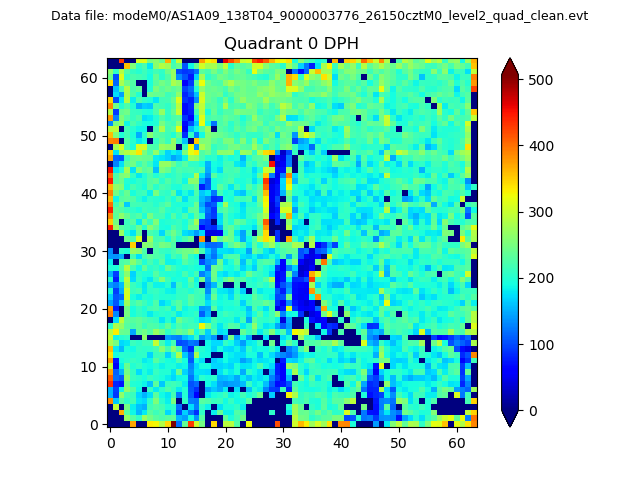 |
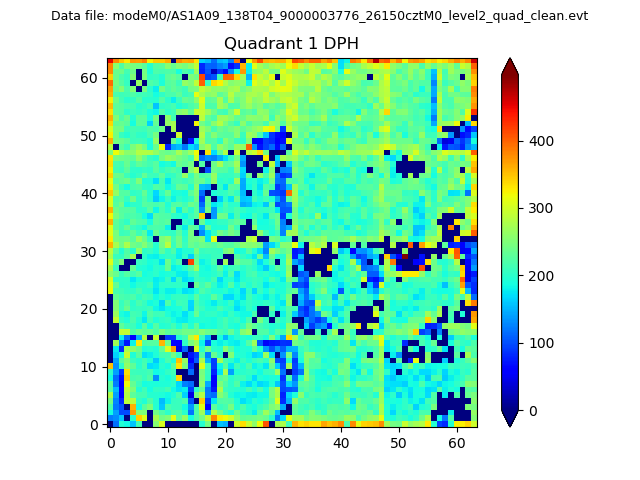 |
Quadrant B |
|---|---|---|---|
| Quadrant D | 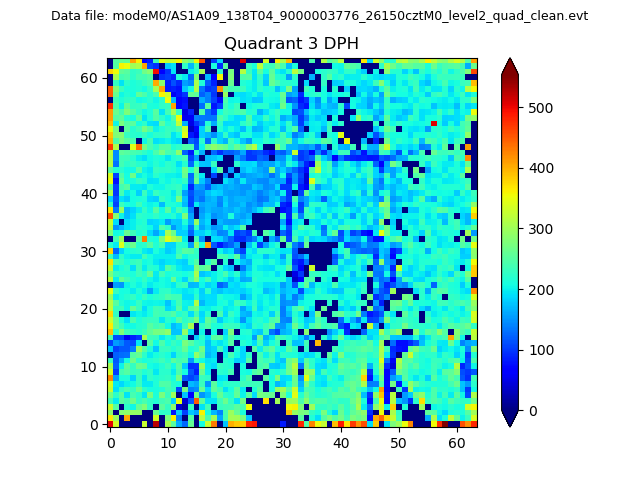 |
 |
Quadrant C |
| Plot type | Count rate plots | Images |
|---|---|---|
| Comparison with Poisson distribution Blue bars denote a histogram of data divided into 1 sec bins. Red curve is a Poisson curve with rate = median count rate of data. |
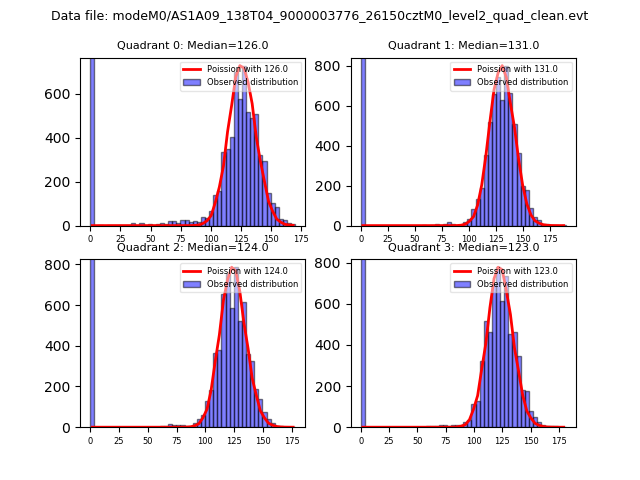 |
 |
| Quadrant-wise count rates Data is divided into 100 sec bins |
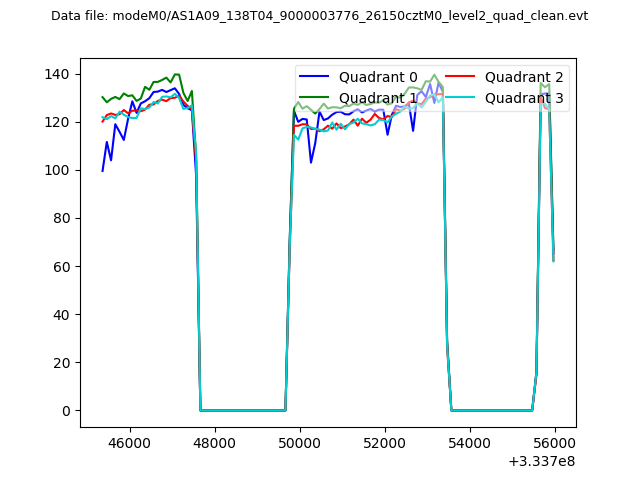 |
|
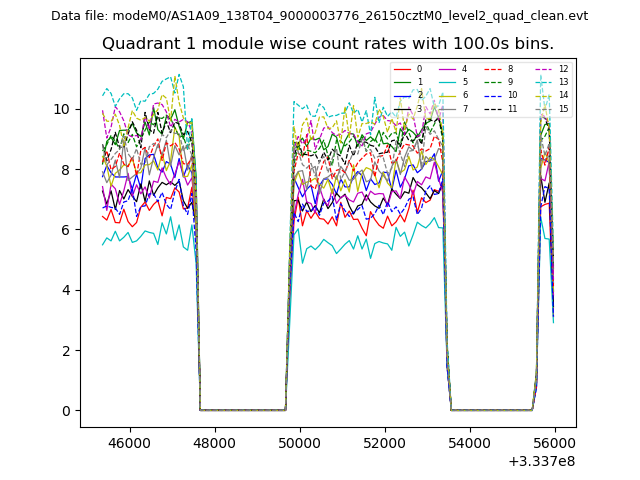
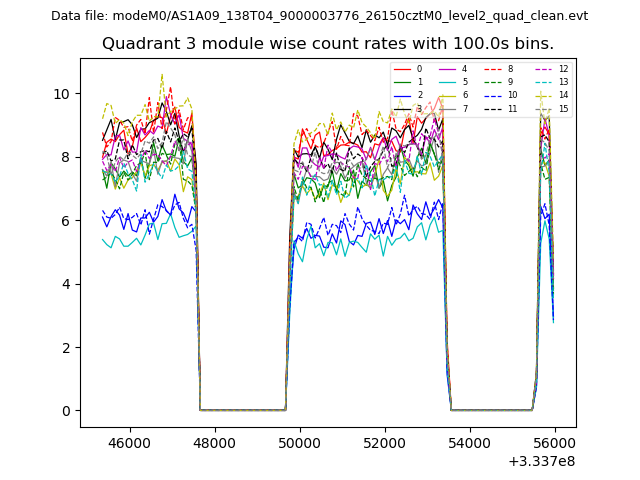
| Module-wise count rates for Quadrant A Data is divided into 100 sec bins |
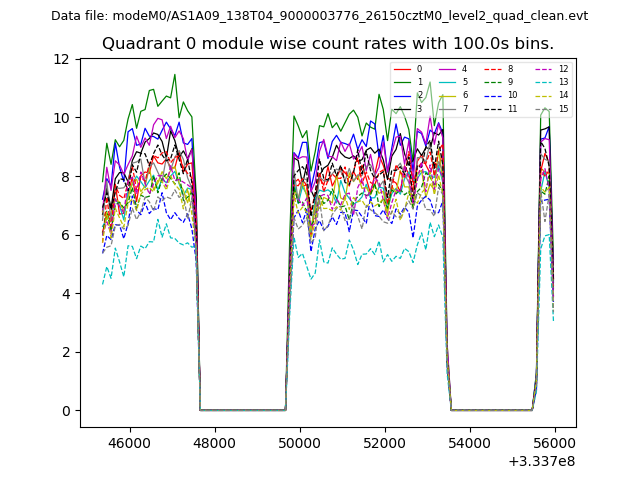 |
 |
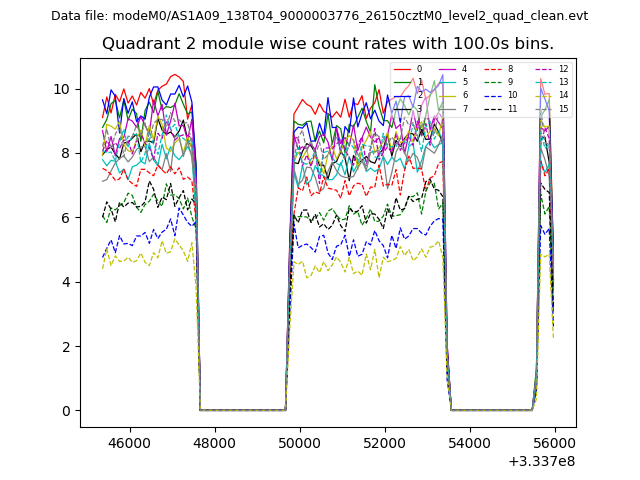
| Module-wise count rates for Quadrant B Data is divided into 100 sec bins |
 |
 |
| Module-wise count rates for Quadrant C Data is divided into 100 sec bins |
 |
 |
| Module-wise count rates for Quadrant D Data is divided into 100 sec bins |
 |
 |
| Parameter | Plot |
|---|---|
| CZT HV Monitor | 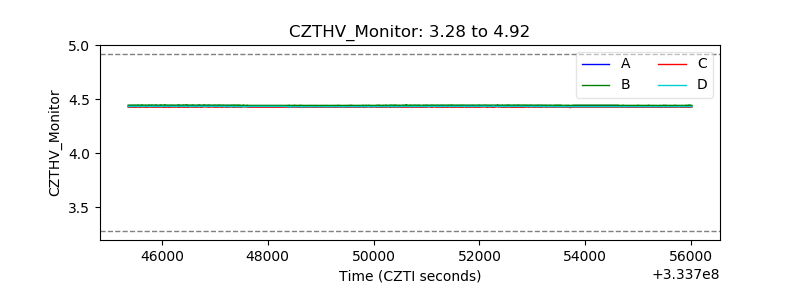 |
| D_VDD | 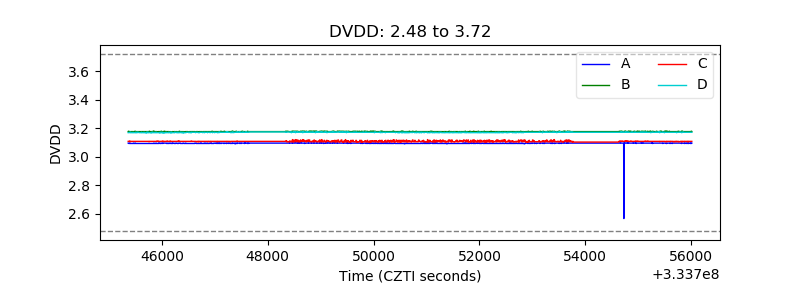 |
| Temperature 1 | 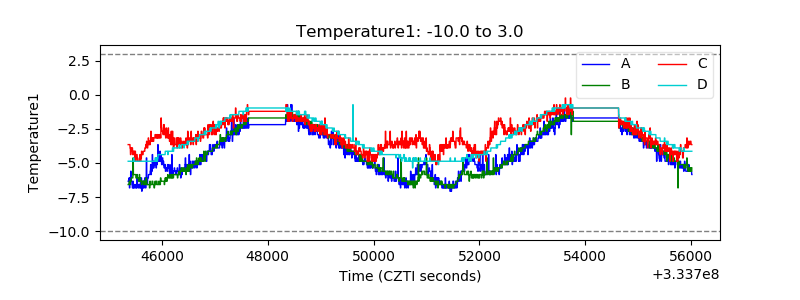 |
| Veto HV Monitor | 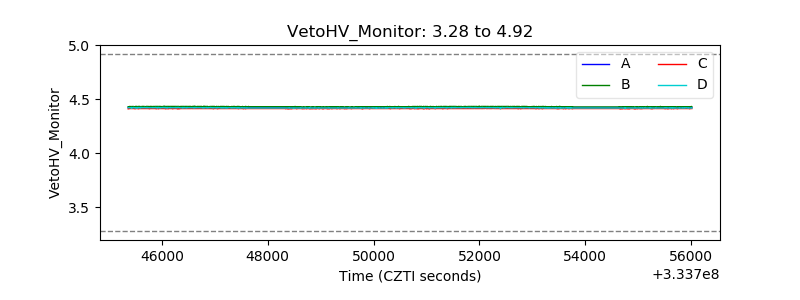 |
| Veto LLD | 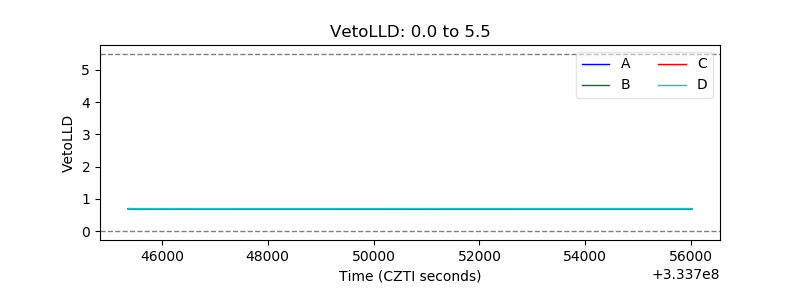 |
| Alpha Counter | 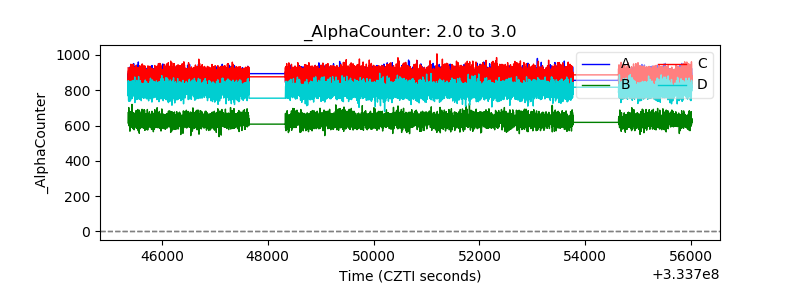 |
| _CPM_Rate | 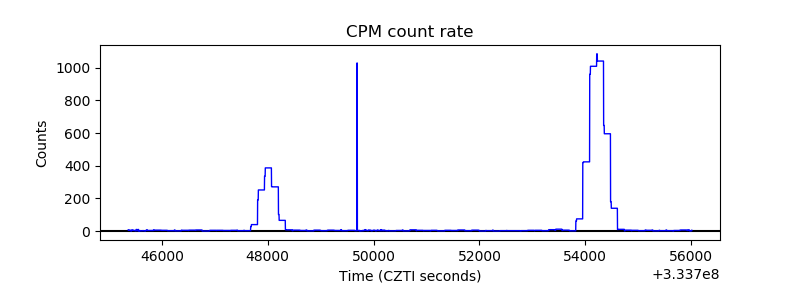 |
| CZT Counter | 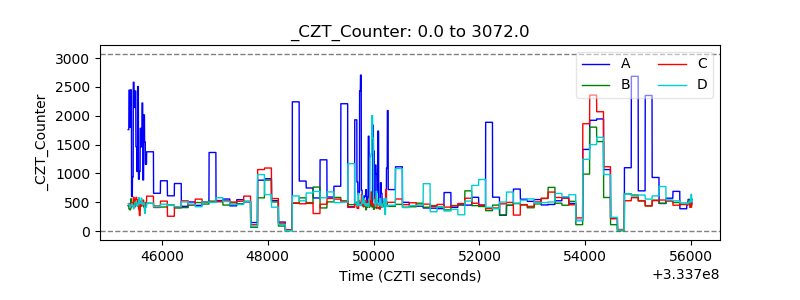 |
| +2.5 Volts monitor |  |
| +5 Volts monitor |  |
| _ROLL_ROT | 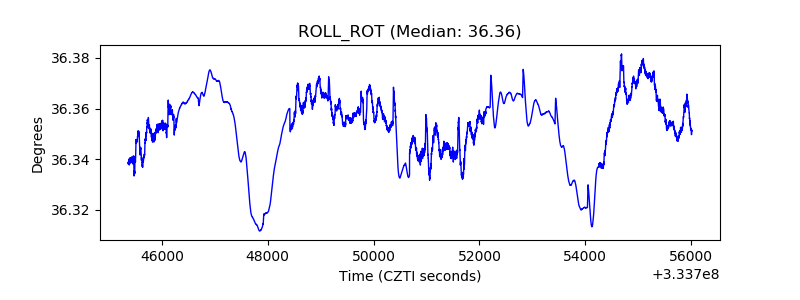 |
| _Roll_DEC | 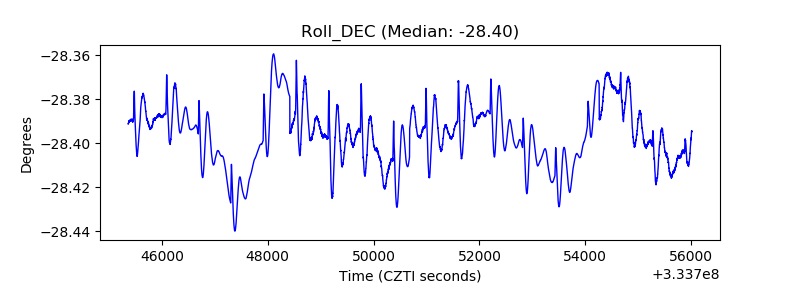 |
| _Roll_RA | 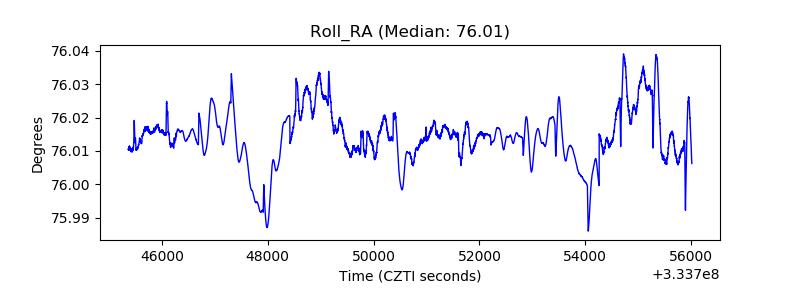 |
| Veto Counter | 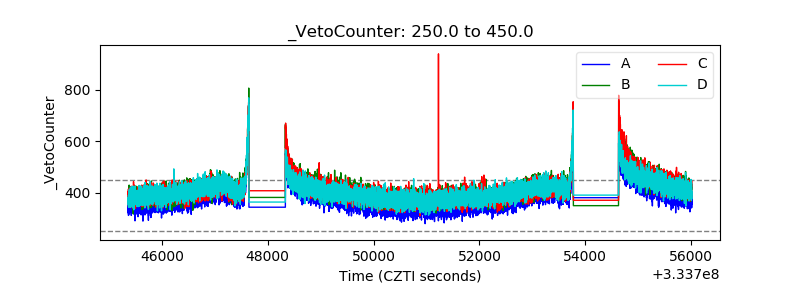 |