| Param | Original file | Final file |
|---|---|---|
| Filename | modeM0/AS1A09_138T04_9000003776_26151cztM0_level2.evt | modeM0/AS1A09_138T04_9000003776_26151cztM0_level2_quad_clean.evt |
| Size (bytes) | 543,695,040 | 92,554,560 |
| Size | 518.5 MB | 88.3 MB |
| Events in quadrant A | 5,060,091 | 580,653 |
| Events in quadrant B | 3,374,108 | 607,493 |
| Events in quadrant C | 3,443,073 | 575,339 |
| Events in quadrant D | 4,133,654 | 571,660 |
| Mode M9 | |||
|---|---|---|---|
| Quadrant | BADHDUFLAG | Total packets | Discarded packets |
| A | 0 | 12 | 0 |
| B | 0 | 13 | 0 |
| C | 0 | 13 | 0 |
| D | 0 | 13 | 0 |
| Mode M0 | |||
|---|---|---|---|
| Quadrant | BADHDUFLAG | Total packets | Discarded packets |
| A | 0 | 19485 | 0 |
| B | 0 | 14216 | 0 |
| C | 0 | 14272 | 0 |
| D | 0 | 16707 | 0 |
| Quadrant | Total seconds | Saturated seconds | Saturation percentage |
|---|---|---|---|
| A | 6710 | 629 | 9.374069% |
| B | 6710 | 64 | 0.953800% |
| C | 6710 | 97 | 1.445604% |
| D | 6710 | 115 | 1.713860% |
Noise dominated data is calculated using 1-second bins in cleaned event files. If a bin has >2000 counts, and if more than 50% of those come from <1% of pixels, then it is considered to be noise-dominated and hence unusable.
| Quadrant | # 1 sec bins | Bins with >0 counts | Bins with >2000 counts | High rate bins dominated by noise | Noise dominated (total time) | Noise dominated (detector-on time) | Marked lightcurve |
|---|---|---|---|---|---|---|---|
| A | 7720 | 6710 | 497 | 497 | 6.44% | 7.41% | 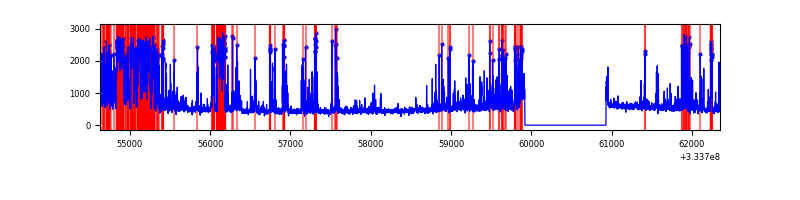 |
| B | 7720 | 6710 | 2 | 2 | 0.03% | 0.03% | 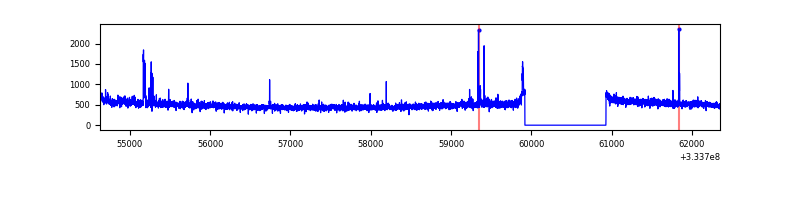 |
| C | 7720 | 6710 | 8 | 8 | 0.10% | 0.12% | 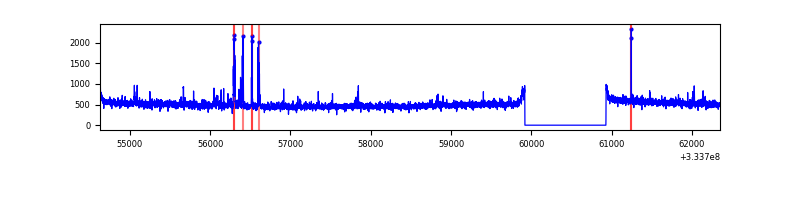 |
| D | 7720 | 6710 | 50 | 50 | 0.65% | 0.75% | 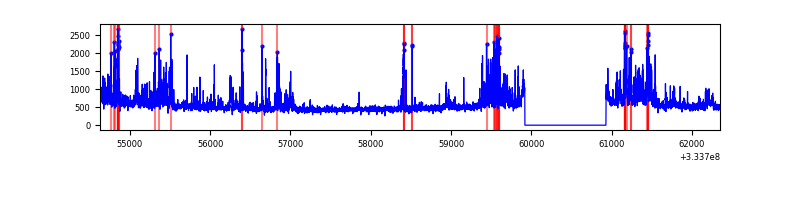 |
Top three noisy pixels from each quadrant. If the there are fewer than three noisy pixels in the level2.evt file, extra rows are filled as -1
| Pixel properties | Quadrant properties | ||||||
|---|---|---|---|---|---|---|---|
| Quadrant | DetID | PixID | Counts | Sigma | Mean | Median | Sigma |
| A | 0 | 13 | 1937259 | 11913.32 | 810 | 791 | 162.5 |
| A | 13 | 254 | 10721 | 61.09 | 810 | 791 | 162.5 |
| A | 3 | 137 | 7505 | 41.31 | 810 | 791 | 162.5 |
| B | 0 | 190 | 64212 | 395.28 | 840 | 819 | 160.4 |
| B | 12 | 111 | 19505 | 116.51 | 840 | 819 | 160.4 |
| B | 11 | 111 | 17448 | 103.69 | 840 | 819 | 160.4 |
| C | 14 | 238 | 130718 | 684.74 | 813 | 816 | 189.7 |
| C | 3 | 233 | 122220 | 639.95 | 813 | 816 | 189.7 |
| C | 2 | 16 | 12683 | 62.55 | 813 | 816 | 189.7 |
| D | 1 | 52 | 810808 | 4121.49 | 819 | 802 | 196.5 |
| D | 8 | 195 | 133202 | 673.68 | 819 | 802 | 196.5 |
| D | 10 | 103 | 29302 | 145.01 | 819 | 802 | 196.5 |
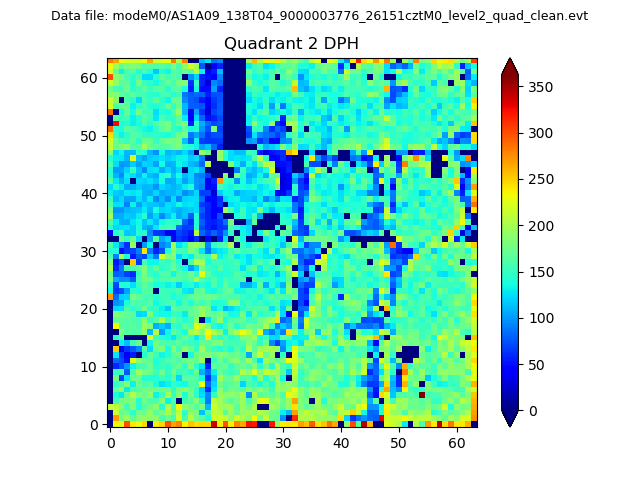
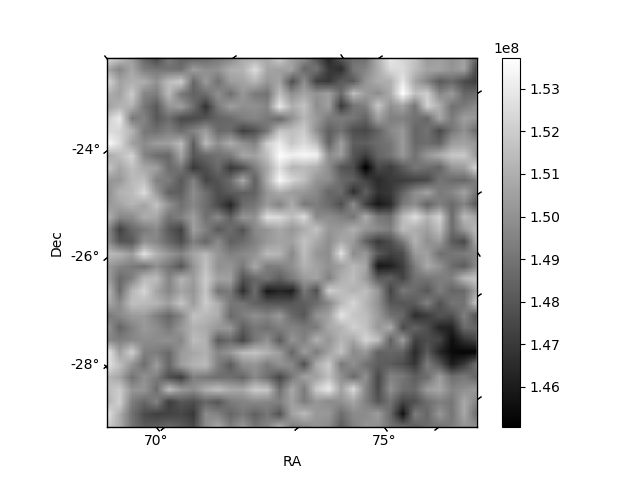
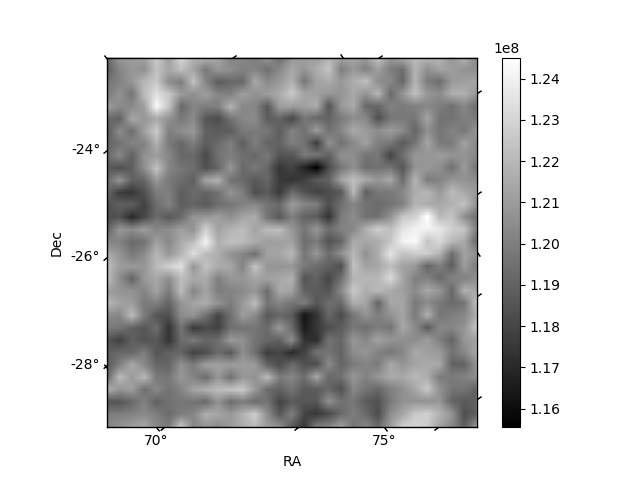
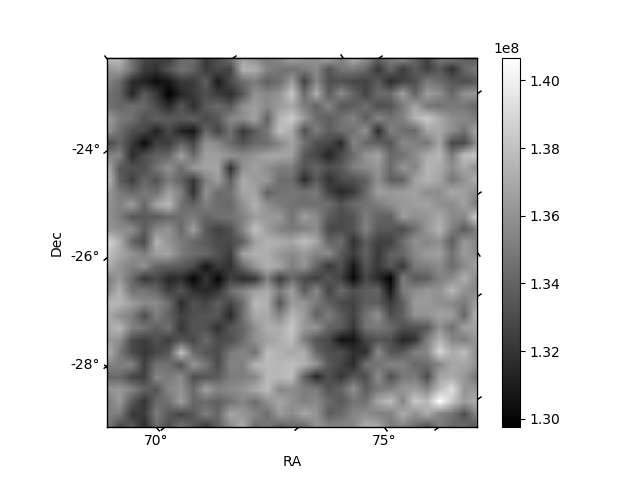
Histogram calculated using DETX and DETY for each event in the final _common_clean file
| Quadrant A | 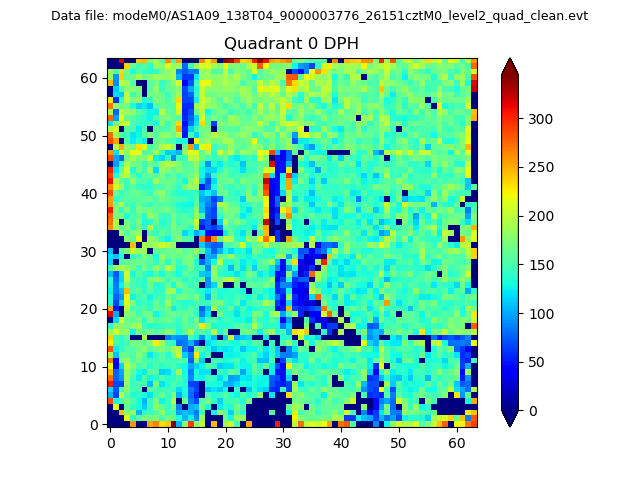 |
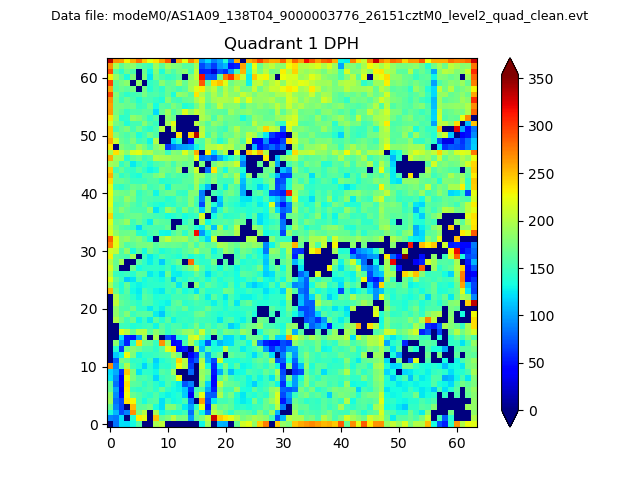 |
Quadrant B |
|---|---|---|---|
| Quadrant D | 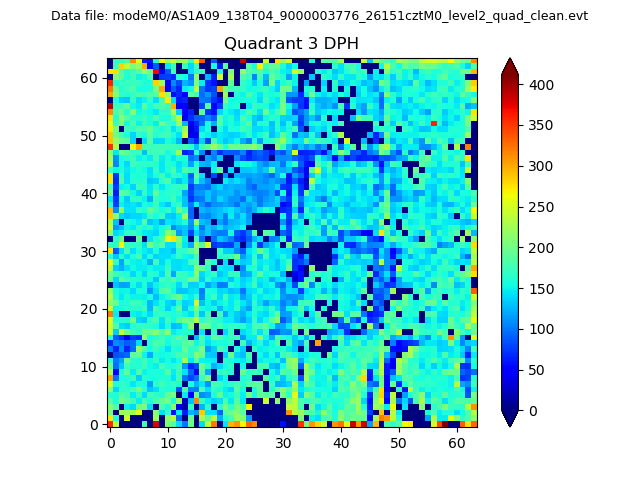 |
 |
Quadrant C |
| Plot type | Count rate plots | Images |
|---|---|---|
| Comparison with Poisson distribution Blue bars denote a histogram of data divided into 1 sec bins. Red curve is a Poisson curve with rate = median count rate of data. |
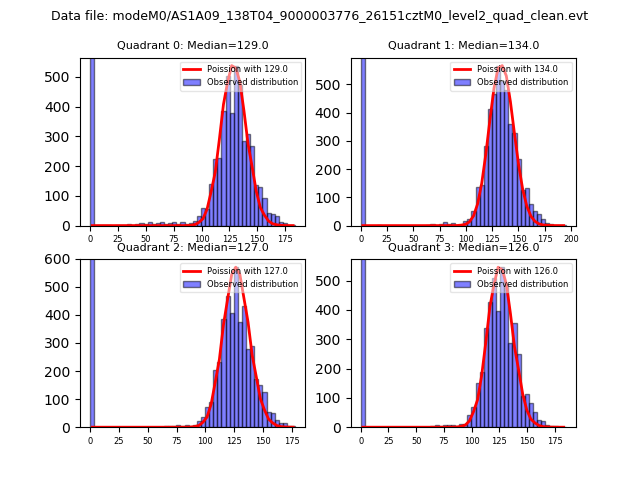 |
 |
| Quadrant-wise count rates Data is divided into 100 sec bins |
 |
|
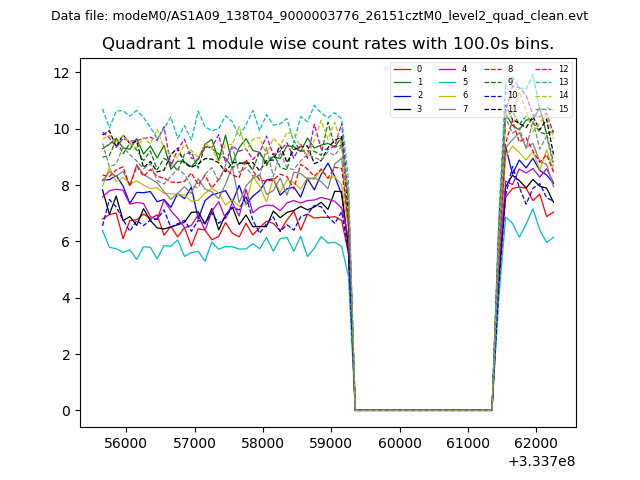
| Module-wise count rates for Quadrant A Data is divided into 100 sec bins |
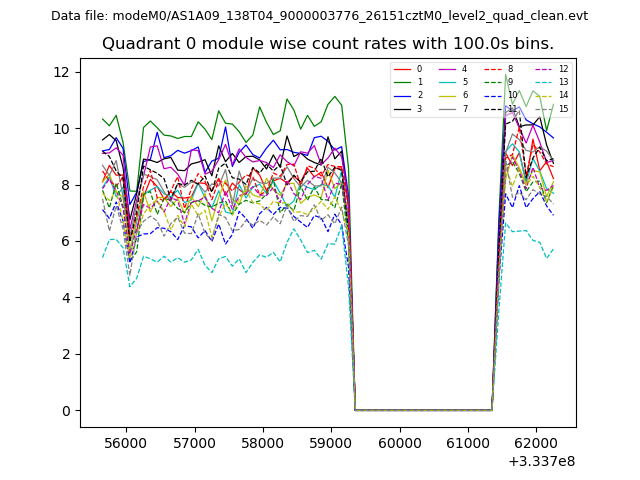 |
 |
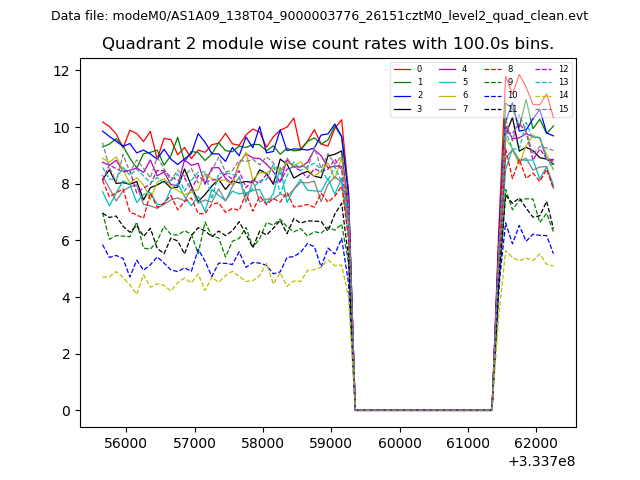
| Module-wise count rates for Quadrant B Data is divided into 100 sec bins |
 |
 |
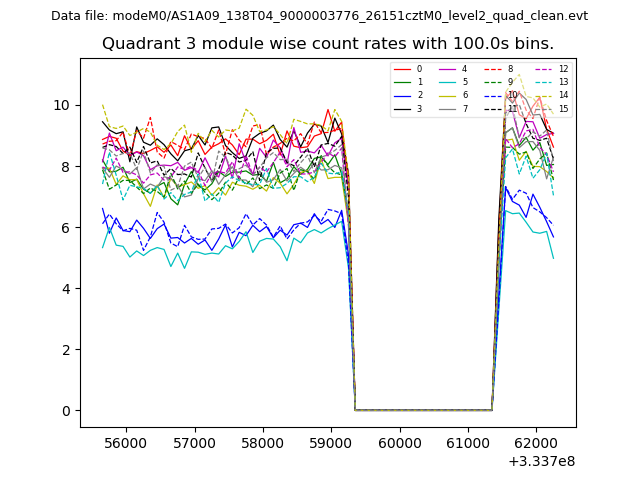
| Module-wise count rates for Quadrant C Data is divided into 100 sec bins |
 |
 |
| Module-wise count rates for Quadrant D Data is divided into 100 sec bins |
 |
 |
| Parameter | Plot |
|---|---|
| CZT HV Monitor | 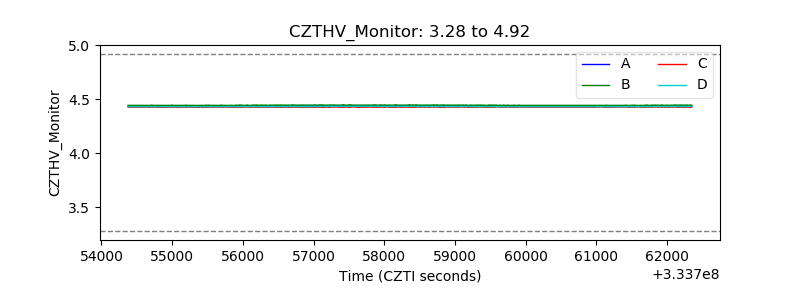 |
| D_VDD | 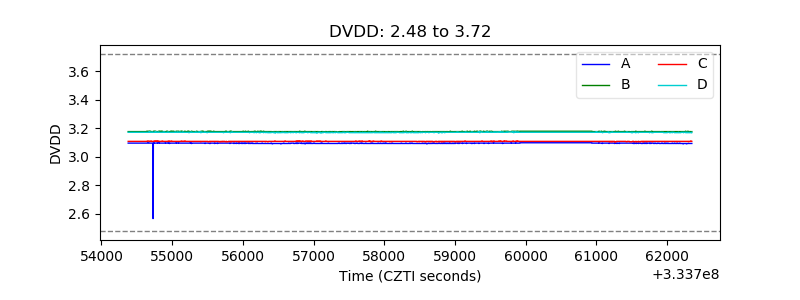 |
| Temperature 1 | 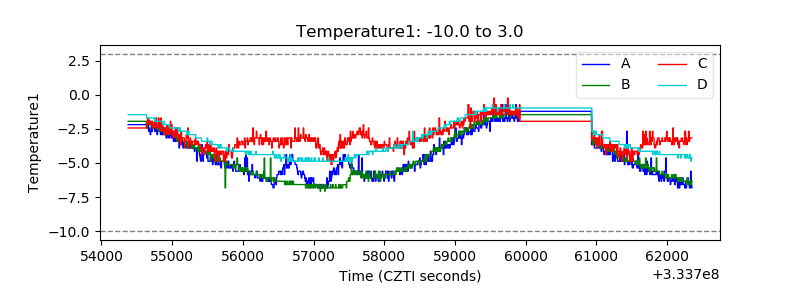 |
| Veto HV Monitor | 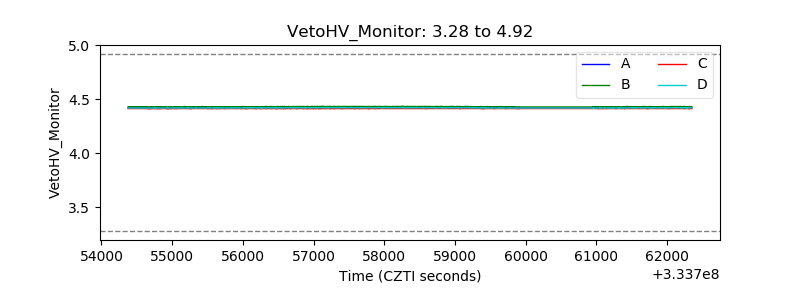 |
| Veto LLD |  |
| Alpha Counter | 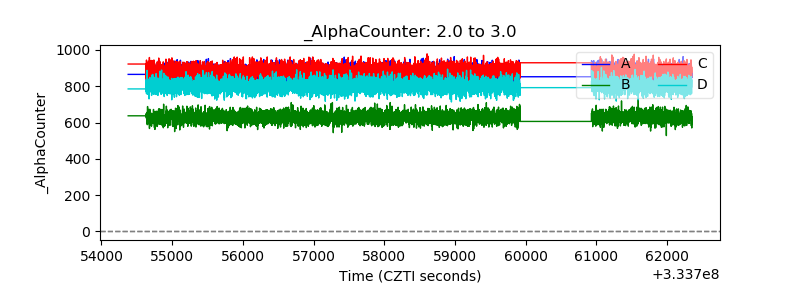 |
| _CPM_Rate | 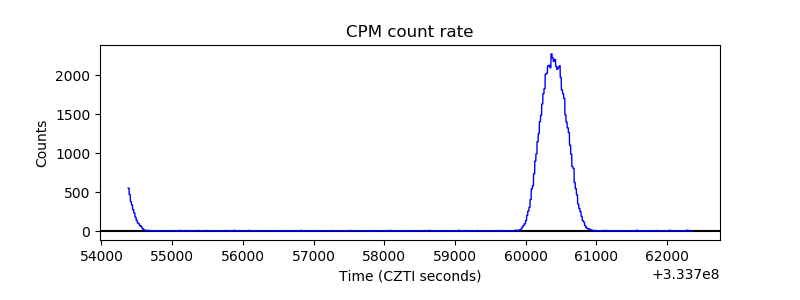 |
| CZT Counter | 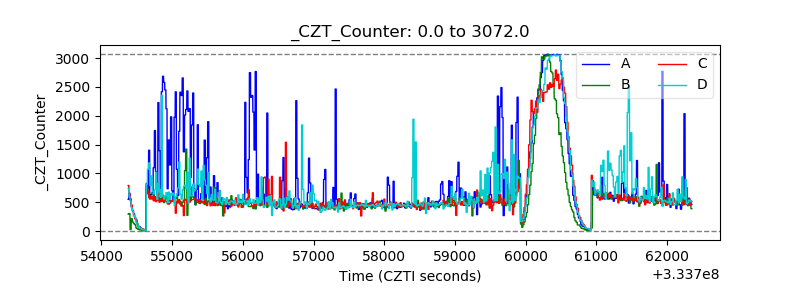 |
| +2.5 Volts monitor |  |
| +5 Volts monitor |  |
| _ROLL_ROT | 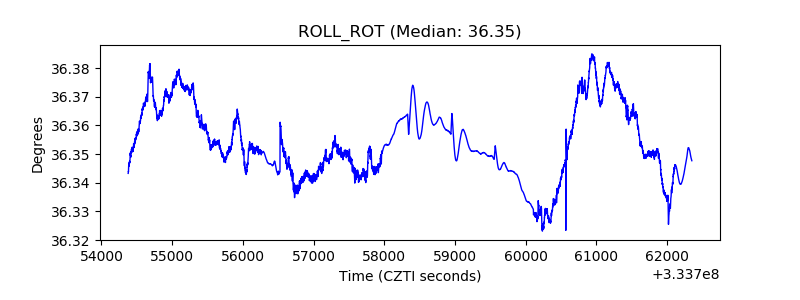 |
| _Roll_DEC | 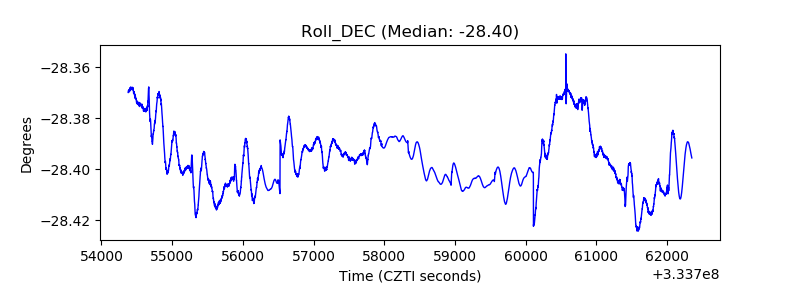 |
| _Roll_RA | 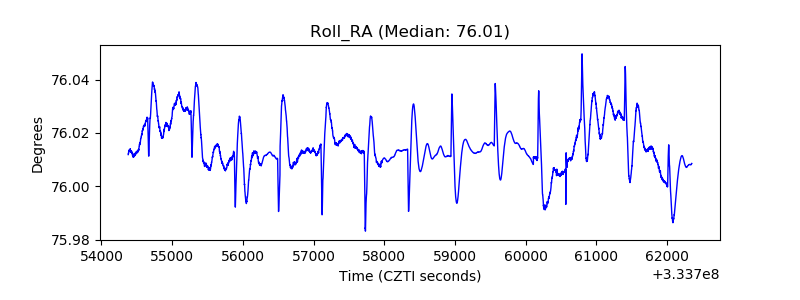 |
| Veto Counter | 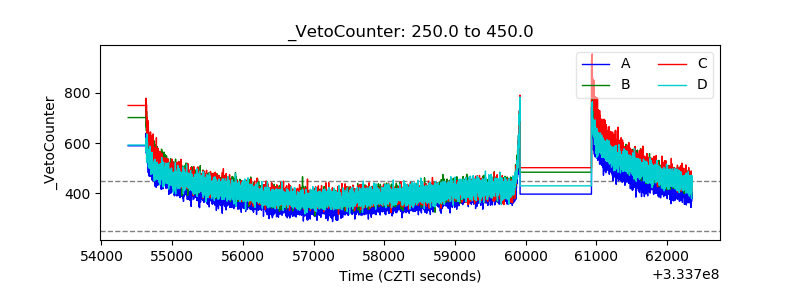 |