| Param | Original file | Final file |
|---|---|---|
| Filename | modeM0/AS1A09_138T04_9000003776_26153cztM0_level2.evt | modeM0/AS1A09_138T04_9000003776_26153cztM0_level2_quad_clean.evt |
| Size (bytes) | 486,120,960 | 106,176,960 |
| Size | 463.6 MB | 101.3 MB |
| Events in quadrant A | 3,519,130 | 688,654 |
| Events in quadrant B | 3,350,691 | 715,218 |
| Events in quadrant C | 3,502,014 | 683,900 |
| Events in quadrant D | 3,911,117 | 676,491 |
| Mode M9 | |||
|---|---|---|---|
| Quadrant | BADHDUFLAG | Total packets | Discarded packets |
| A | 0 | 19 | 0 |
| B | 0 | 20 | 0 |
| C | 0 | 20 | 0 |
| D | 0 | 20 | 0 |
| Mode M0 | |||
|---|---|---|---|
| Quadrant | BADHDUFLAG | Total packets | Discarded packets |
| A | 0 | 14685 | 0 |
| B | 0 | 14054 | 0 |
| C | 0 | 14483 | 0 |
| D | 0 | 15776 | 0 |
| Quadrant | Total seconds | Saturated seconds | Saturation percentage |
|---|---|---|---|
| A | 6476 | 87 | 1.343422% |
| B | 6476 | 40 | 0.617665% |
| C | 6476 | 117 | 1.806671% |
| D | 6476 | 70 | 1.080914% |
Noise dominated data is calculated using 1-second bins in cleaned event files. If a bin has >2000 counts, and if more than 50% of those come from <1% of pixels, then it is considered to be noise-dominated and hence unusable.
| Quadrant | # 1 sec bins | Bins with >0 counts | Bins with >2000 counts | High rate bins dominated by noise | Noise dominated (total time) | Noise dominated (detector-on time) | Marked lightcurve |
|---|---|---|---|---|---|---|---|
| A | 7641 | 6478 | 55 | 55 | 0.72% | 0.85% | 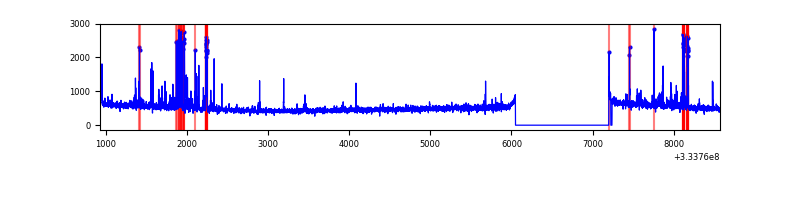 |
| B | 7641 | 6477 | 2 | 2 | 0.03% | 0.03% | 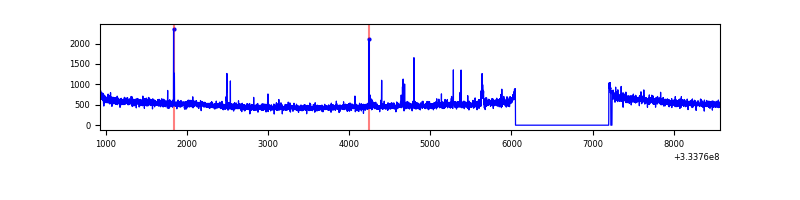 |
| C | 7641 | 6476 | 3 | 3 | 0.04% | 0.05% | 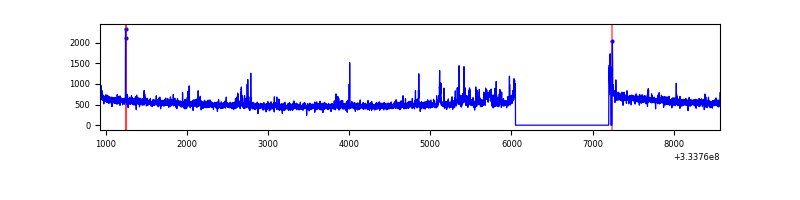 |
| D | 7641 | 6478 | 21 | 21 | 0.27% | 0.32% | 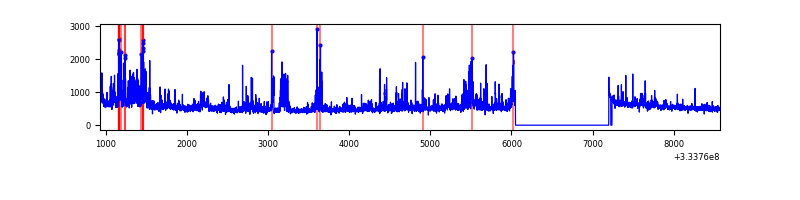 |
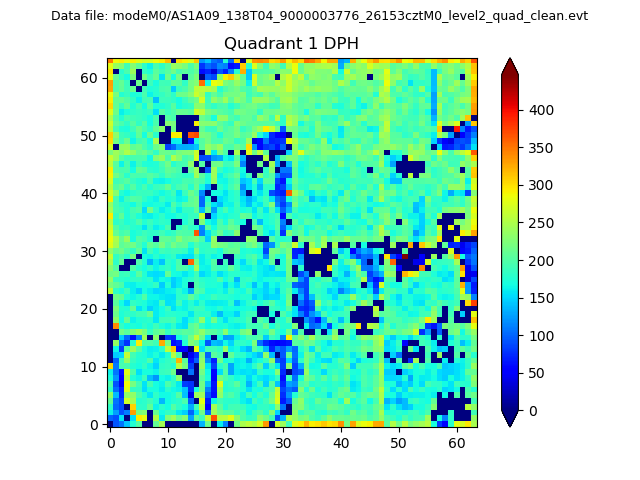
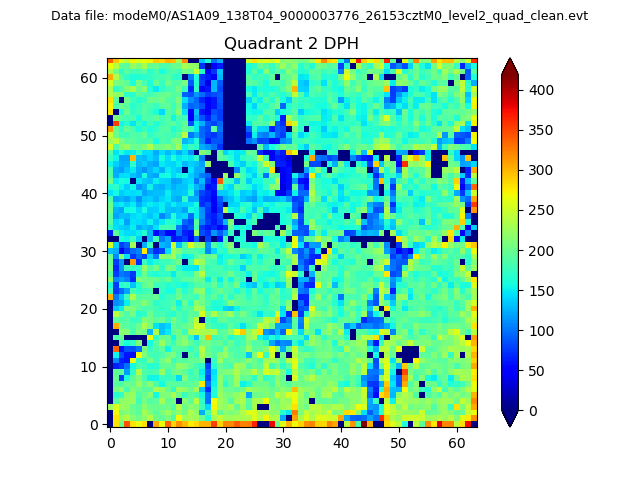
Top three noisy pixels from each quadrant. If the there are fewer than three noisy pixels in the level2.evt file, extra rows are filled as -1
| Pixel properties | Quadrant properties | ||||||
|---|---|---|---|---|---|---|---|
| Quadrant | DetID | PixID | Counts | Sigma | Mean | Median | Sigma |
| A | 0 | 13 | 300870 | 1808.01 | 834 | 819 | 166.0 |
| A | 13 | 254 | 10356 | 57.47 | 834 | 819 | 166.0 |
| A | 3 | 137 | 7426 | 39.81 | 834 | 819 | 166.0 |
| B | 0 | 230 | 27860 | 170.07 | 839 | 820 | 159.0 |
| B | 12 | 111 | 18798 | 113.07 | 839 | 820 | 159.0 |
| B | 11 | 111 | 16977 | 101.62 | 839 | 820 | 159.0 |
| C | 3 | 233 | 161273 | 836.51 | 820 | 828 | 191.8 |
| C | 14 | 238 | 133639 | 692.43 | 820 | 828 | 191.8 |
| C | 2 | 16 | 14265 | 70.06 | 820 | 828 | 191.8 |
| D | 1 | 52 | 621966 | 3172.76 | 825 | 806 | 195.8 |
| D | 8 | 195 | 90999 | 460.69 | 825 | 806 | 195.8 |
| D | 12 | 233 | 47925 | 240.67 | 825 | 806 | 195.8 |
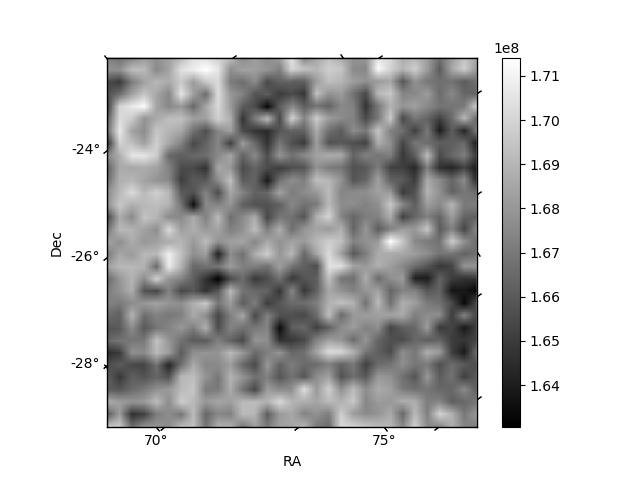
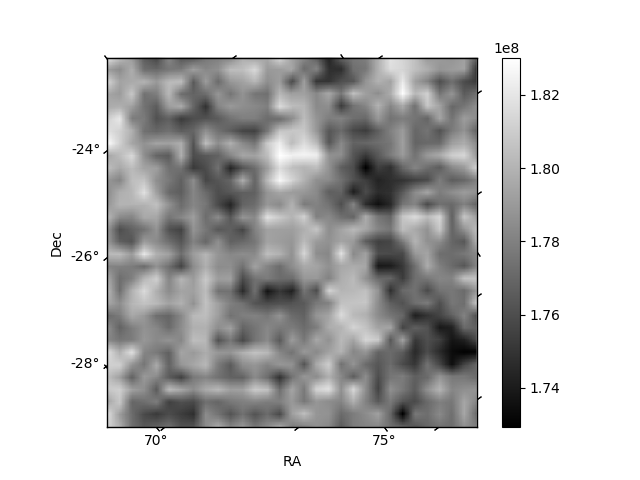
Histogram calculated using DETX and DETY for each event in the final _common_clean file
| Quadrant A | 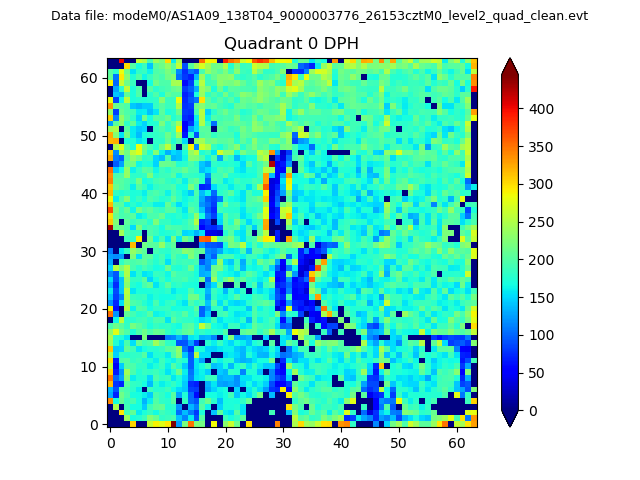 |
 |
Quadrant B |
|---|---|---|---|
| Quadrant D | 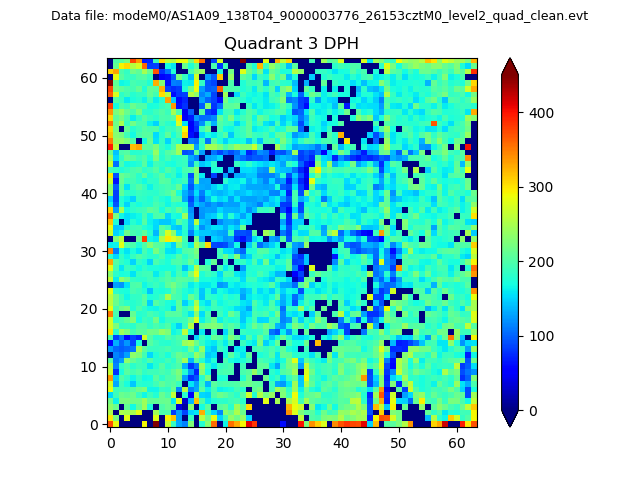 |
 |
Quadrant C |
| Plot type | Count rate plots | Images |
|---|---|---|
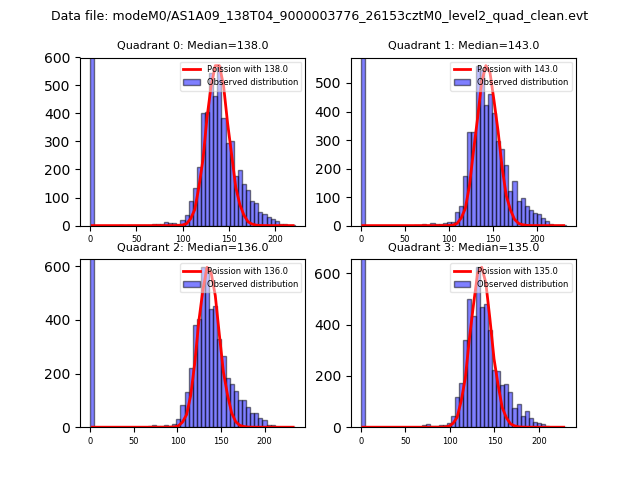
| Comparison with Poisson distribution Blue bars denote a histogram of data divided into 1 sec bins. Red curve is a Poisson curve with rate = median count rate of data. |
 |
 |
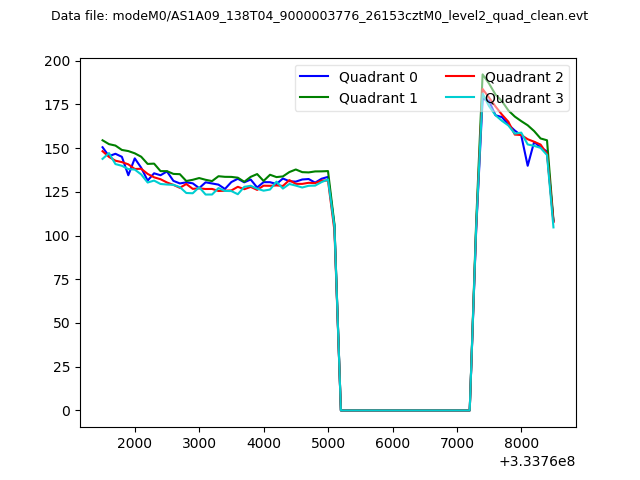
| Quadrant-wise count rates Data is divided into 100 sec bins |
 |
|
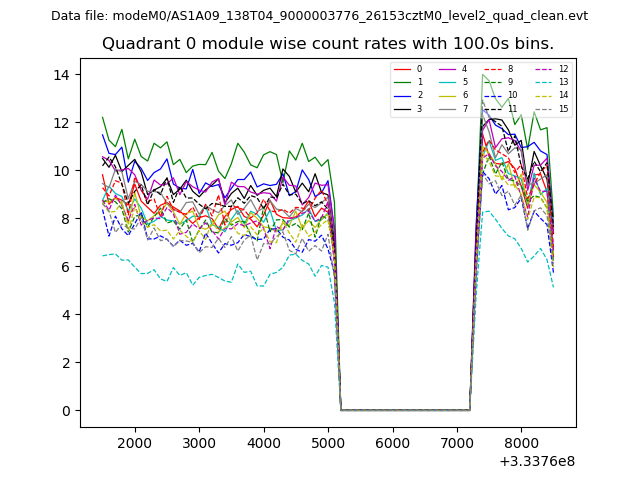
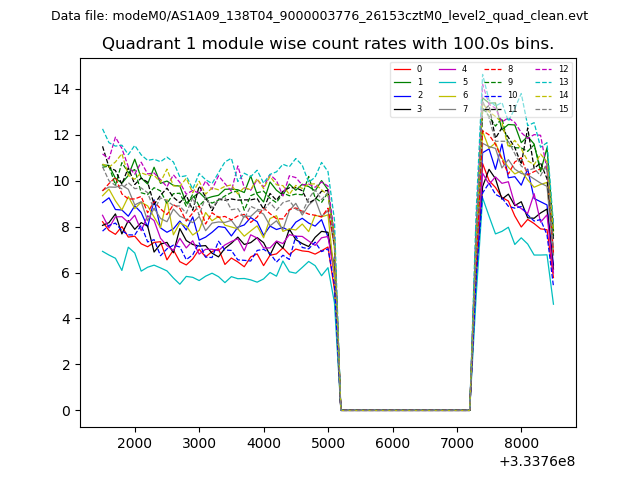
| Module-wise count rates for Quadrant A Data is divided into 100 sec bins |
 |
 |
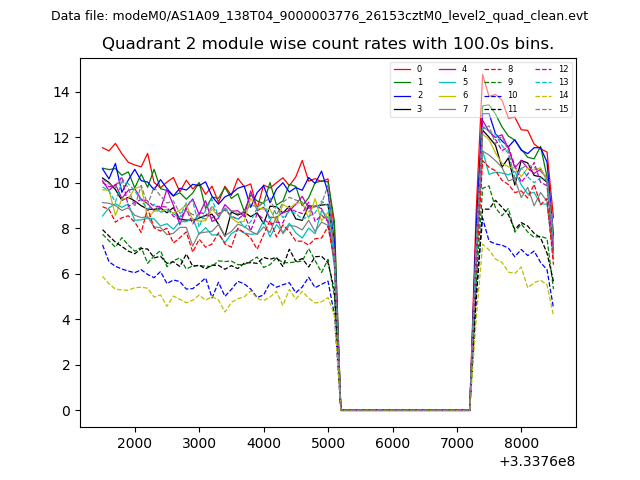
| Module-wise count rates for Quadrant B Data is divided into 100 sec bins |
 |
 |
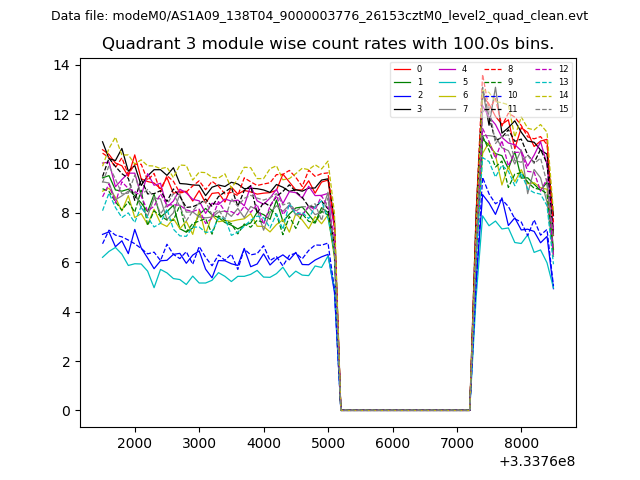
| Module-wise count rates for Quadrant C Data is divided into 100 sec bins |
 |
 |
| Module-wise count rates for Quadrant D Data is divided into 100 sec bins |
 |
 |
| Parameter | Plot |
|---|---|
| CZT HV Monitor | 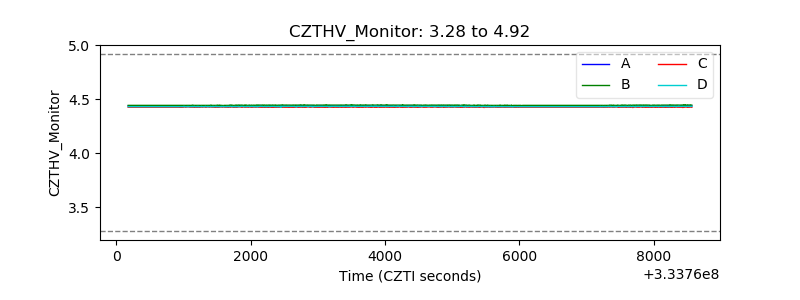 |
| D_VDD | 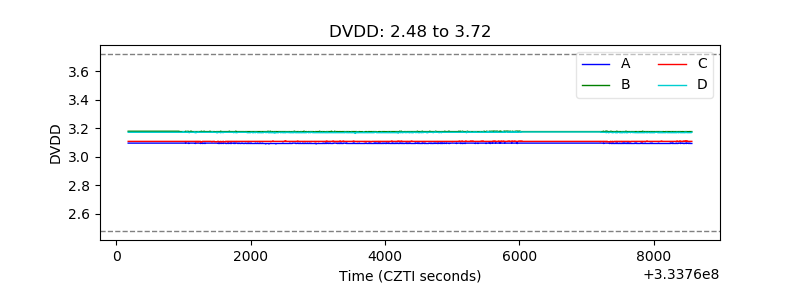 |
| Temperature 1 | 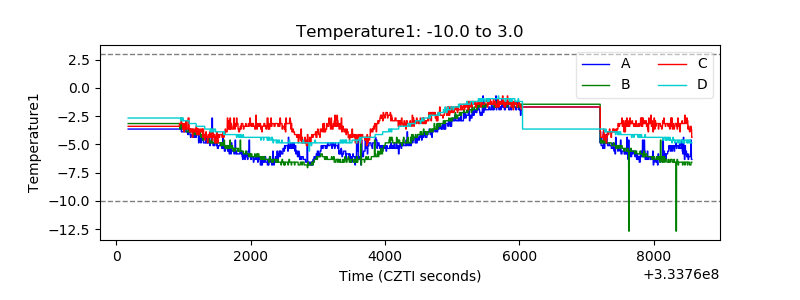 |
| Veto HV Monitor | 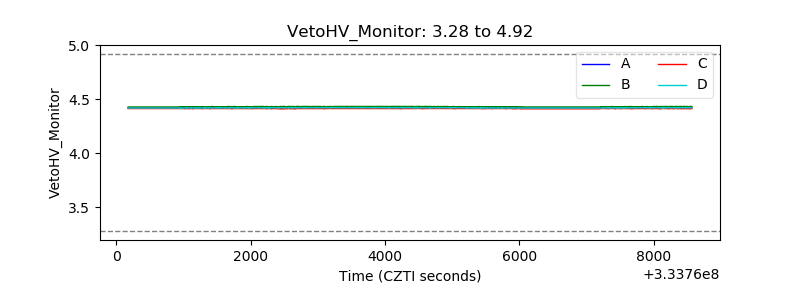 |
| Veto LLD | 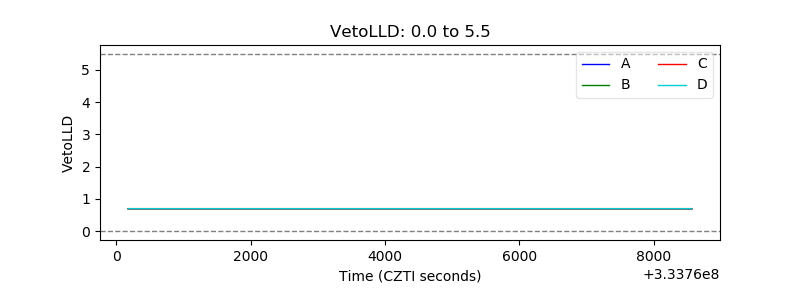 |
| Alpha Counter | 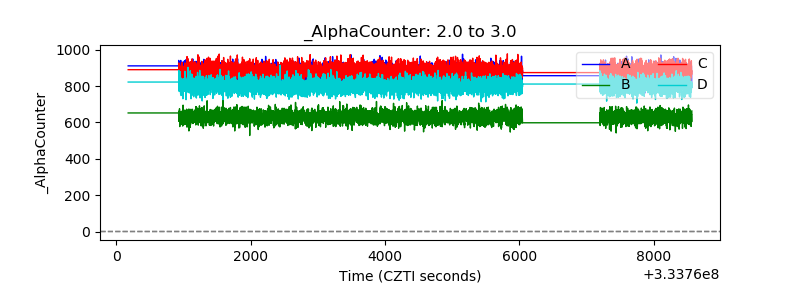 |
| _CPM_Rate | 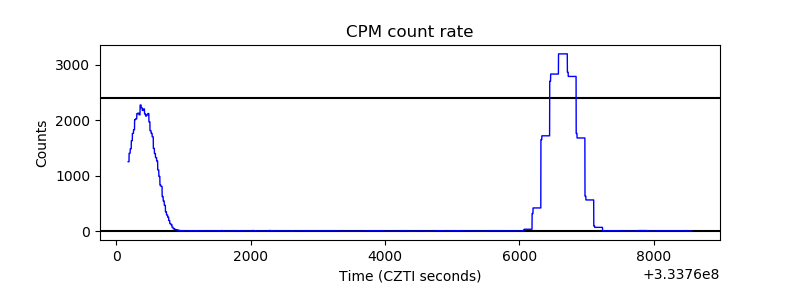 |
| CZT Counter | 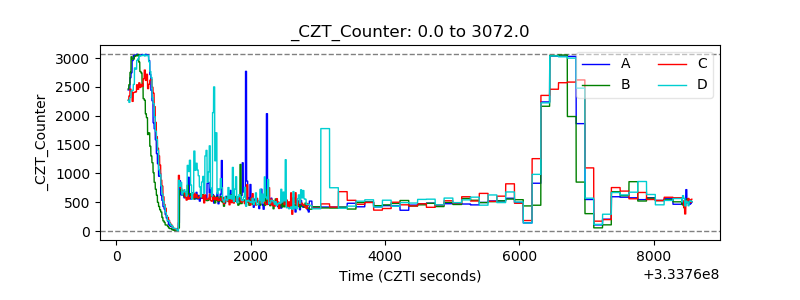 |
| +2.5 Volts monitor |  |
| +5 Volts monitor |  |
| _ROLL_ROT | 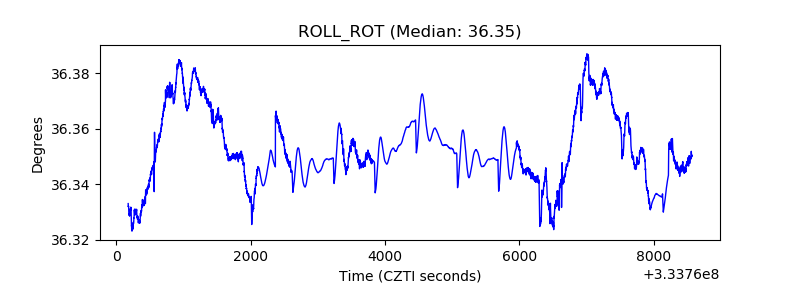 |
| _Roll_DEC |  |
| _Roll_RA | 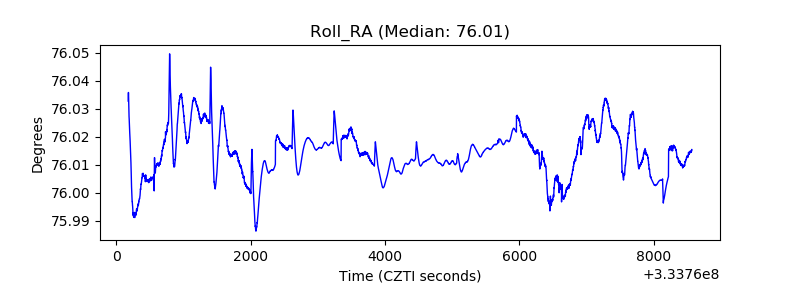 |
| Veto Counter | 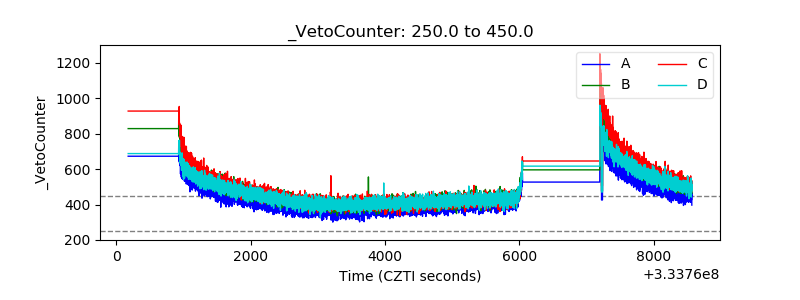 |