| Param | Original file | Final file |
|---|---|---|
| Filename | modeM0/AS1A09_138T04_9000003776_26154cztM0_level2.evt | modeM0/AS1A09_138T04_9000003776_26154cztM0_level2_quad_clean.evt |
| Size (bytes) | 508,760,640 | 115,352,640 |
| Size | 485.2 MB | 110.0 MB |
| Events in quadrant A | 4,037,203 | 750,389 |
| Events in quadrant B | 3,321,673 | 793,609 |
| Events in quadrant C | 3,524,879 | 763,844 |
| Events in quadrant D | 4,100,305 | 749,564 |
| Mode M9 | |||
|---|---|---|---|
| Quadrant | BADHDUFLAG | Total packets | Discarded packets |
| A | 0 | 15 | 0 |
| B | 0 | 16 | 0 |
| C | 0 | 16 | 0 |
| D | 0 | 16 | 0 |
| Mode M0 | |||
|---|---|---|---|
| Quadrant | BADHDUFLAG | Total packets | Discarded packets |
| A | 0 | 16113 | 0 |
| B | 0 | 13812 | 0 |
| C | 0 | 14514 | 0 |
| D | 0 | 16317 | 0 |
| Quadrant | Total seconds | Saturated seconds | Saturation percentage |
|---|---|---|---|
| A | 6255 | 180 | 2.877698% |
| B | 6254 | 42 | 0.671570% |
| C | 6254 | 118 | 1.886792% |
| D | 6254 | 204 | 3.261912% |
Noise dominated data is calculated using 1-second bins in cleaned event files. If a bin has >2000 counts, and if more than 50% of those come from <1% of pixels, then it is considered to be noise-dominated and hence unusable.
| Quadrant | # 1 sec bins | Bins with >0 counts | Bins with >2000 counts | High rate bins dominated by noise | Noise dominated (total time) | Noise dominated (detector-on time) | Marked lightcurve |
|---|---|---|---|---|---|---|---|
| A | 7550 | 6256 | 146 | 146 | 1.93% | 2.33% | 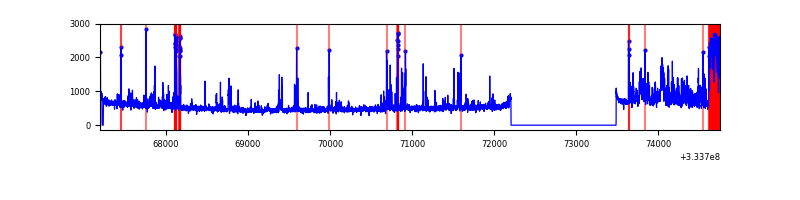 |
| B | 7549 | 6255 | 0 | 0 | 0.00% | 0.00% | 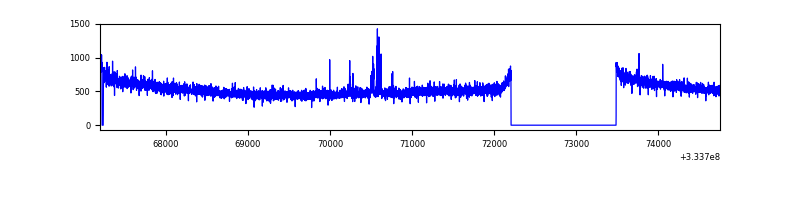 |
| C | 7549 | 6254 | 5 | 5 | 0.07% | 0.08% | 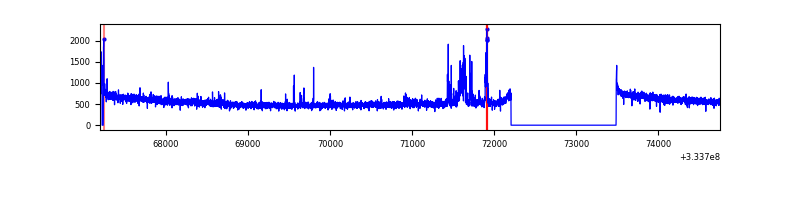 |
| D | 7549 | 6255 | 152 | 152 | 2.01% | 2.43% | 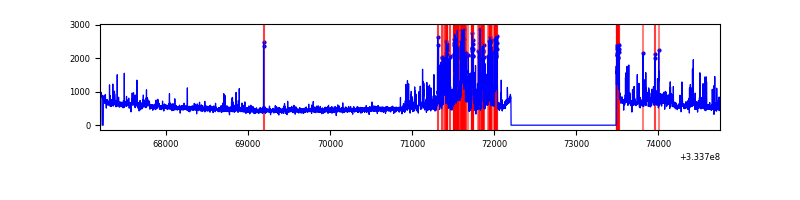 |
Top three noisy pixels from each quadrant. If the there are fewer than three noisy pixels in the level2.evt file, extra rows are filled as -1
| Pixel properties | Quadrant properties | ||||||
|---|---|---|---|---|---|---|---|
| Quadrant | DetID | PixID | Counts | Sigma | Mean | Median | Sigma |
| A | 0 | 13 | 833622 | 5077.1 | 830 | 816 | 164.0 |
| A | 13 | 254 | 9563 | 53.32 | 830 | 816 | 164.0 |
| A | 0 | 226 | 7125 | 38.46 | 830 | 816 | 164.0 |
| B | 0 | 230 | 27288 | 167.04 | 841 | 821 | 158.4 |
| B | 12 | 111 | 18218 | 109.8 | 841 | 821 | 158.4 |
| B | 11 | 111 | 16485 | 98.86 | 841 | 821 | 158.4 |
| C | 3 | 233 | 161904 | 839.28 | 826 | 833 | 191.9 |
| C | 14 | 238 | 131567 | 681.21 | 826 | 833 | 191.9 |
| C | 2 | 16 | 10731 | 51.57 | 826 | 833 | 191.9 |
| D | 1 | 52 | 802066 | 4133.24 | 825 | 809 | 193.9 |
| D | 12 | 233 | 146913 | 753.67 | 825 | 809 | 193.9 |
| D | 8 | 195 | 30453 | 152.92 | 825 | 809 | 193.9 |
Histogram calculated using DETX and DETY for each event in the final _common_clean file
| Quadrant A | 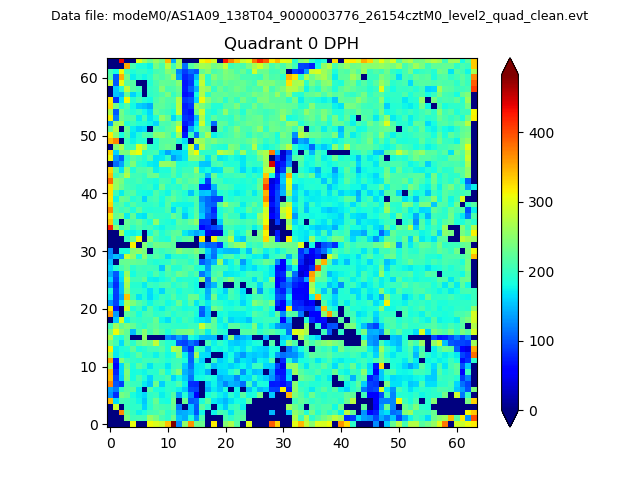 |
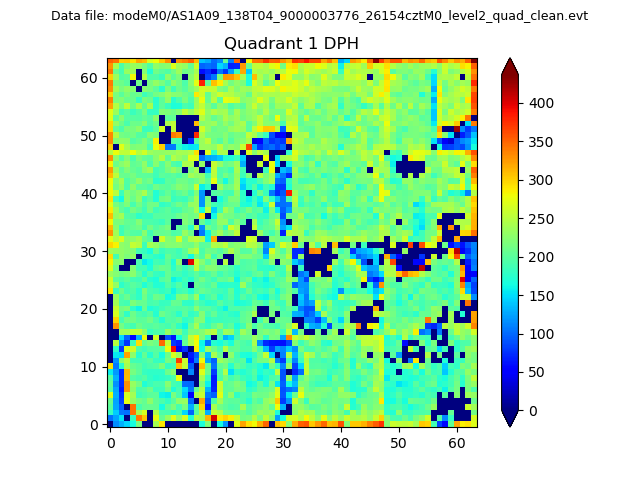 |
Quadrant B |
|---|---|---|---|
| Quadrant D | 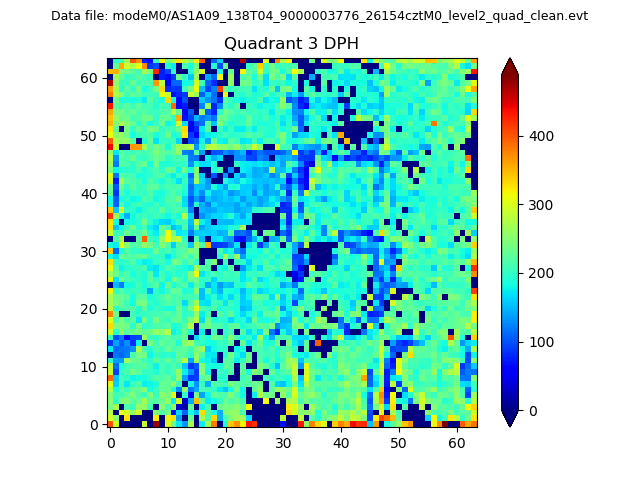 |
 |
Quadrant C |
| Plot type | Count rate plots | Images |
|---|---|---|
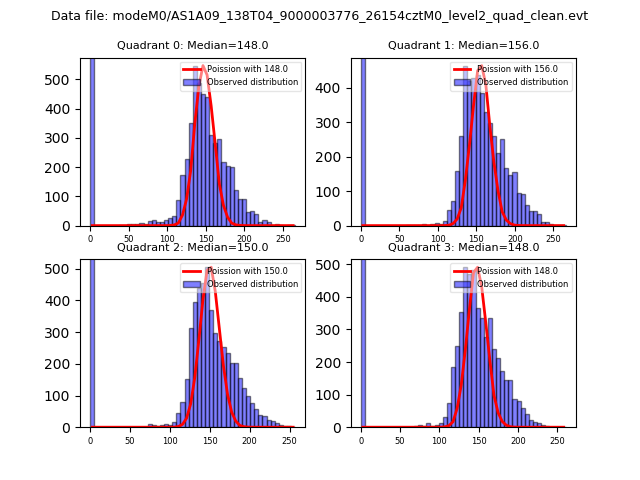
| Comparison with Poisson distribution Blue bars denote a histogram of data divided into 1 sec bins. Red curve is a Poisson curve with rate = median count rate of data. |
 |
 |
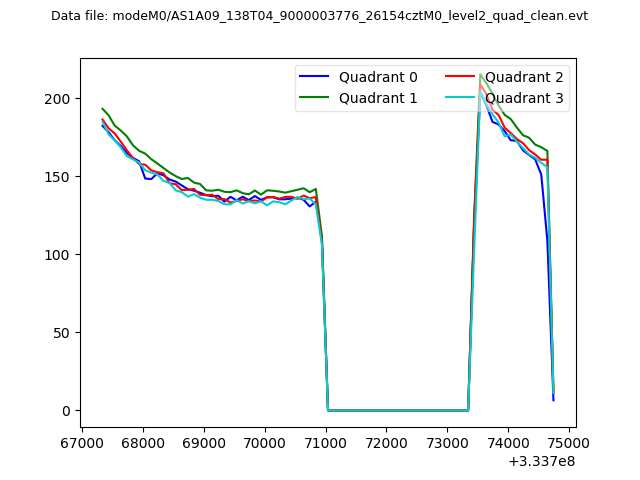
| Quadrant-wise count rates Data is divided into 100 sec bins |
 |
|
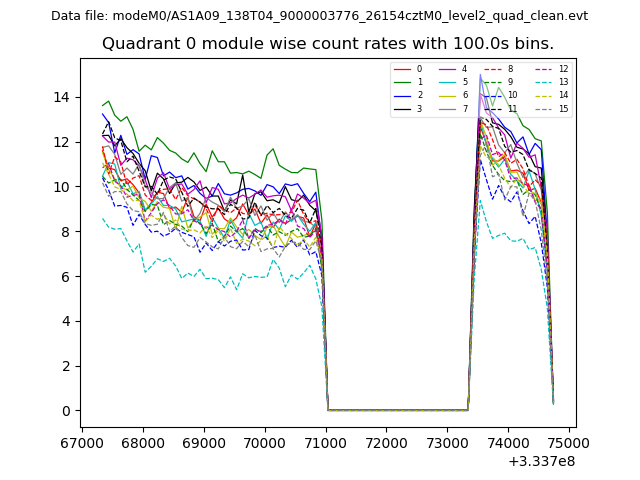
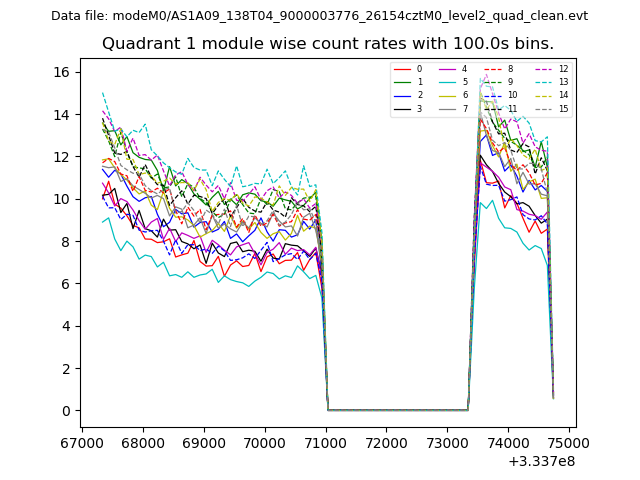
| Module-wise count rates for Quadrant A Data is divided into 100 sec bins |
 |
 |
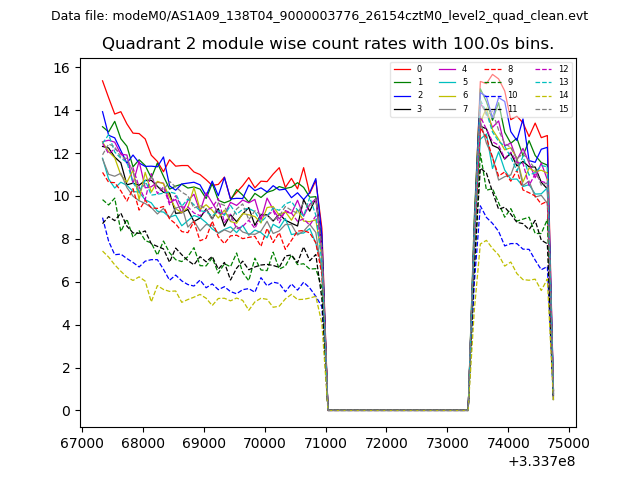
| Module-wise count rates for Quadrant B Data is divided into 100 sec bins |
 |
 |
| Module-wise count rates for Quadrant C Data is divided into 100 sec bins |
 |
 |
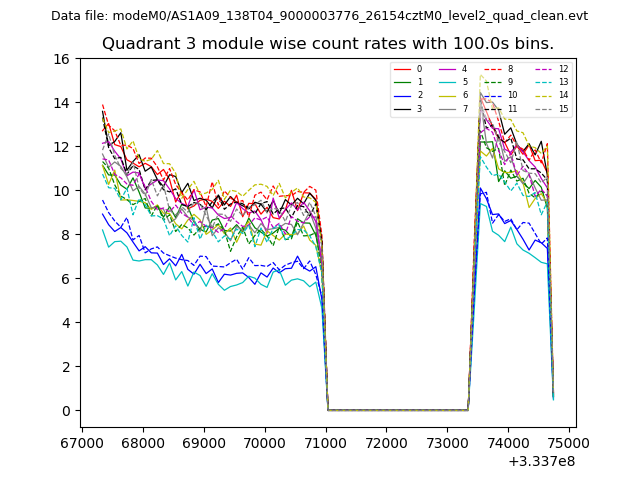
| Module-wise count rates for Quadrant D Data is divided into 100 sec bins |
 |
 |
| Parameter | Plot |
|---|---|
| CZT HV Monitor | 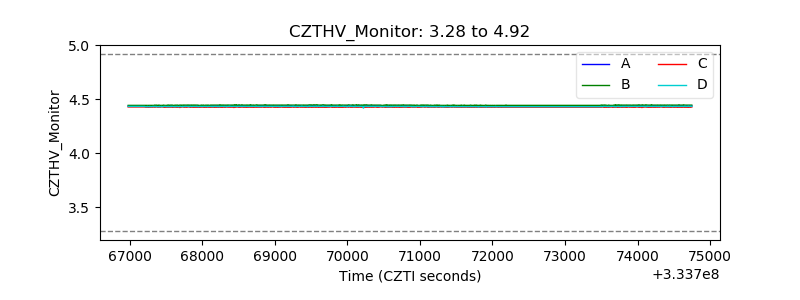 |
| D_VDD | 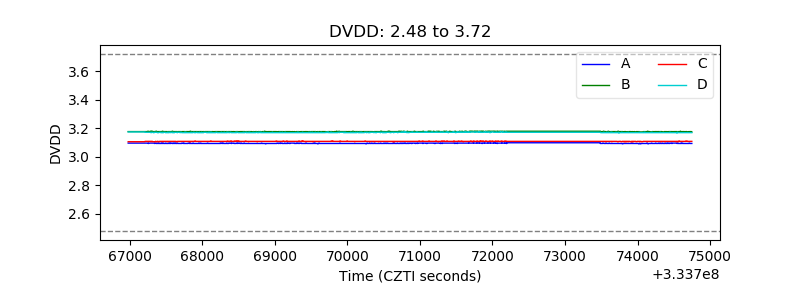 |
| Temperature 1 | 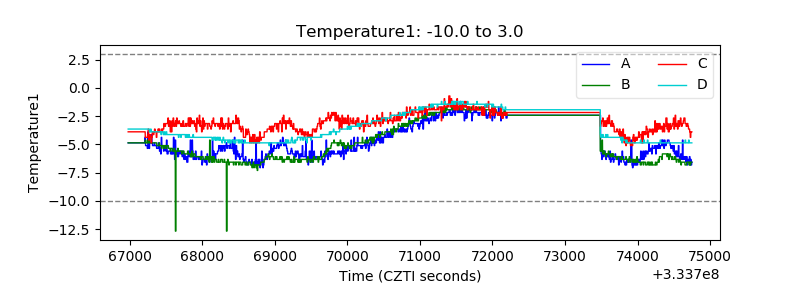 |
| Veto HV Monitor | 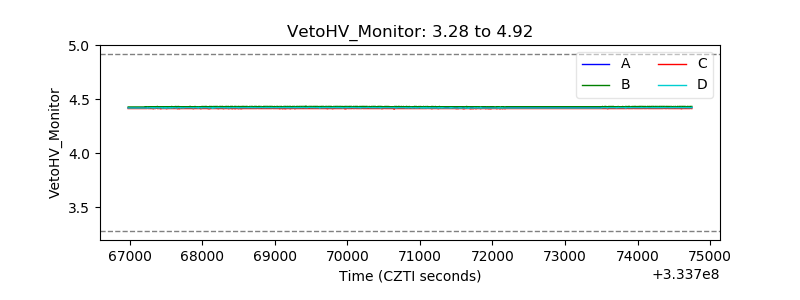 |
| Veto LLD | 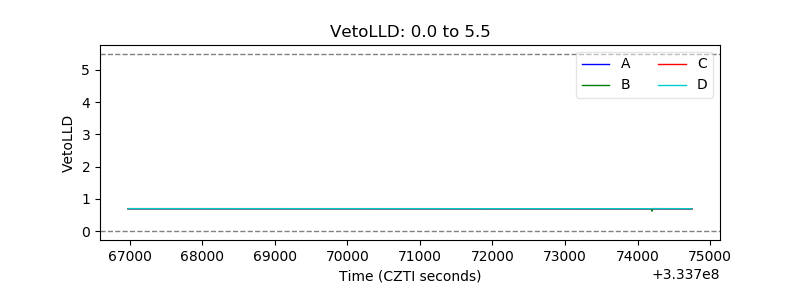 |
| Alpha Counter | 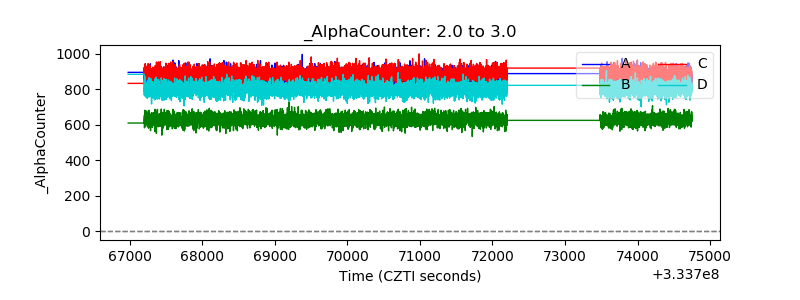 |
| _CPM_Rate | 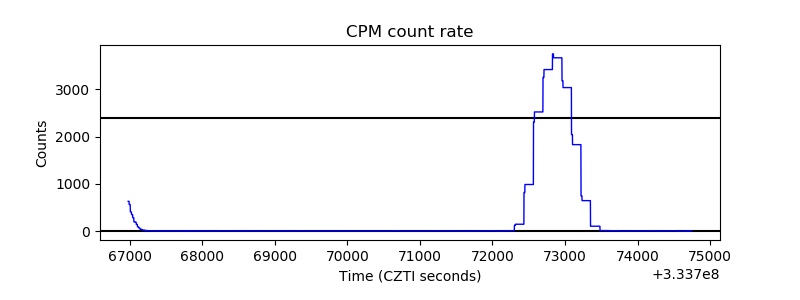 |
| CZT Counter | 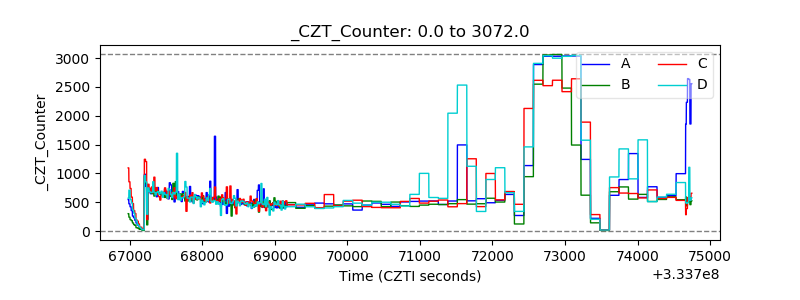 |
| +2.5 Volts monitor | 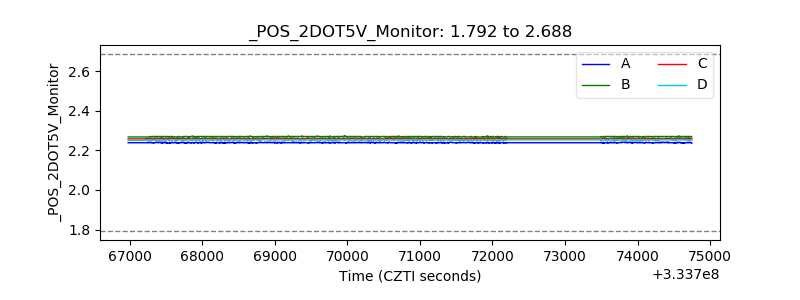 |
| +5 Volts monitor | 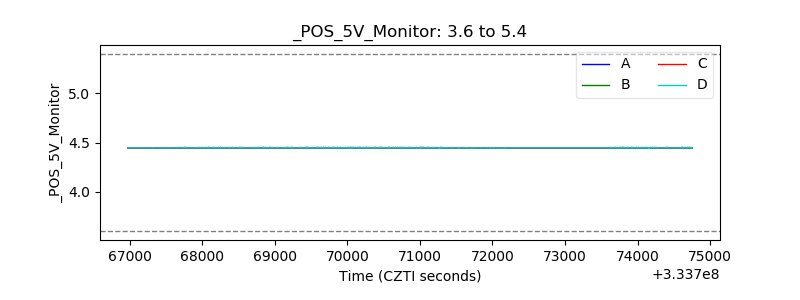 |
| _ROLL_ROT | 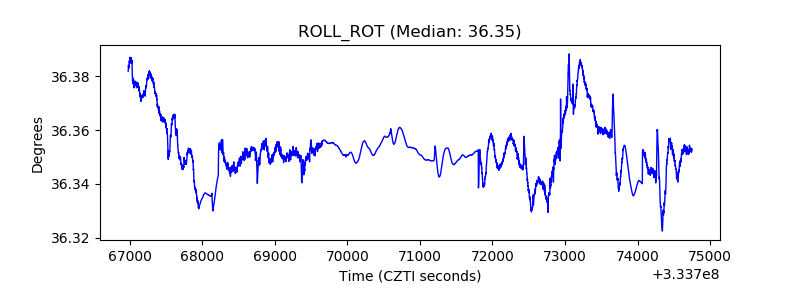 |
| _Roll_DEC | 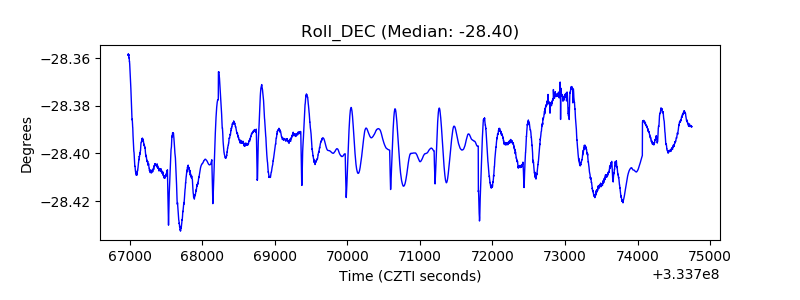 |
| _Roll_RA | 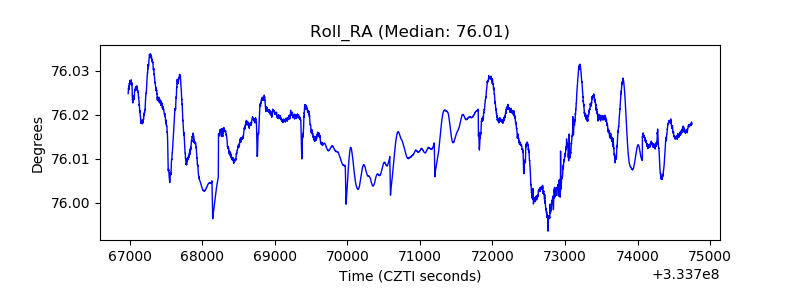 |
| Veto Counter | 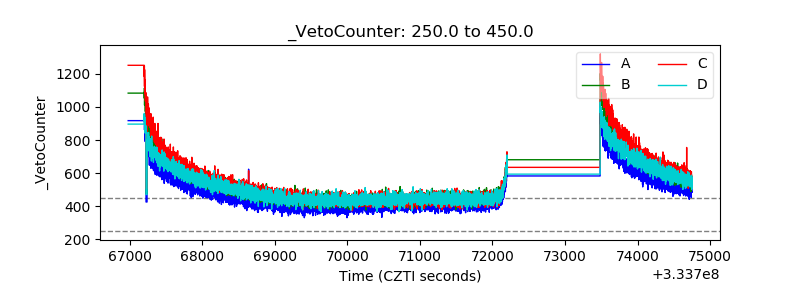 |