| Param | Original file | Final file |
|---|---|---|
| Filename | modeM0/AS1A09_138T04_9000003776_26155cztM0_level2.evt | modeM0/AS1A09_138T04_9000003776_26155cztM0_level2_quad_clean.evt |
| Size (bytes) | 617,270,400 | 114,053,760 |
| Size | 588.7 MB | 108.8 MB |
| Events in quadrant A | 7,412,444 | 710,645 |
| Events in quadrant B | 3,340,211 | 794,703 |
| Events in quadrant C | 3,483,520 | 768,582 |
| Events in quadrant D | 4,043,037 | 751,717 |
| Mode M9 | |||
|---|---|---|---|
| Quadrant | BADHDUFLAG | Total packets | Discarded packets |
| A | 0 | 16 | 0 |
| B | 0 | 17 | 0 |
| C | 0 | 17 | 0 |
| D | 0 | 17 | 0 |
| Mode M0 | |||
|---|---|---|---|
| Quadrant | BADHDUFLAG | Total packets | Discarded packets |
| A | 0 | 26193 | 0 |
| B | 0 | 13721 | 0 |
| C | 0 | 14227 | 0 |
| D | 0 | 16073 | 0 |
| Quadrant | Total seconds | Saturated seconds | Saturation percentage |
|---|---|---|---|
| A | 6139 | 1195 | 19.465711% |
| B | 6139 | 39 | 0.635283% |
| C | 6139 | 80 | 1.303144% |
| D | 6139 | 78 | 1.270565% |
Noise dominated data is calculated using 1-second bins in cleaned event files. If a bin has >2000 counts, and if more than 50% of those come from <1% of pixels, then it is considered to be noise-dominated and hence unusable.
| Quadrant | # 1 sec bins | Bins with >0 counts | Bins with >2000 counts | High rate bins dominated by noise | Noise dominated (total time) | Noise dominated (detector-on time) | Marked lightcurve |
|---|---|---|---|---|---|---|---|
| A | 7504 | 6140 | 1176 | 1176 | 15.67% | 19.15% | 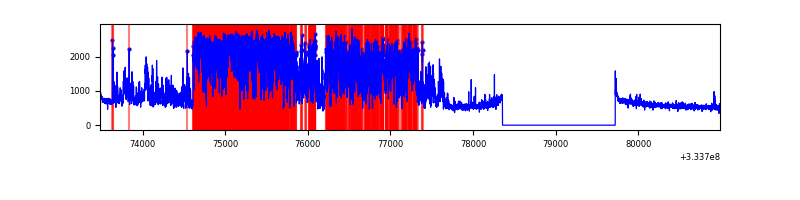 |
| B | 7504 | 6139 | 2 | 2 | 0.03% | 0.03% | 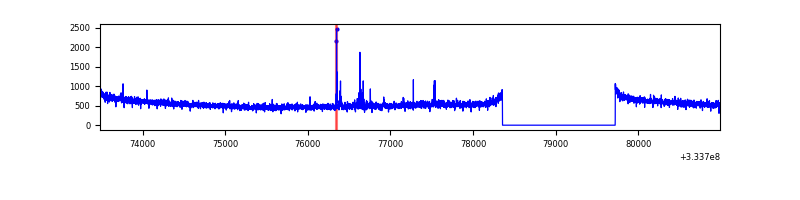 |
| C | 7504 | 6139 | 0 | 0 | 0.00% | 0.00% | 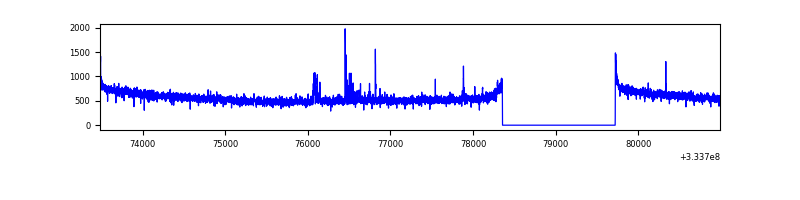 |
| D | 7504 | 6139 | 45 | 45 | 0.60% | 0.73% | 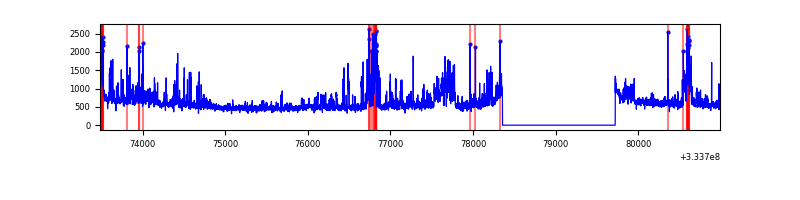 |
Top three noisy pixels from each quadrant. If the there are fewer than three noisy pixels in the level2.evt file, extra rows are filled as -1
| Pixel properties | Quadrant properties | ||||||
|---|---|---|---|---|---|---|---|
| Quadrant | DetID | PixID | Counts | Sigma | Mean | Median | Sigma |
| A | 0 | 13 | 4293650 | 26926.0 | 810 | 797 | 159.4 |
| A | 13 | 254 | 8808 | 50.25 | 810 | 797 | 159.4 |
| A | 0 | 226 | 6918 | 38.39 | 810 | 797 | 159.4 |
| B | 0 | 230 | 20441 | 125.59 | 846 | 825 | 156.2 |
| B | 12 | 111 | 18113 | 110.69 | 846 | 825 | 156.2 |
| B | 11 | 111 | 16222 | 98.58 | 846 | 825 | 156.2 |
| C | 14 | 238 | 134289 | 688.75 | 838 | 848 | 193.7 |
| C | 3 | 233 | 52781 | 268.05 | 838 | 848 | 193.7 |
| C | 2 | 16 | 29078 | 145.71 | 838 | 848 | 193.7 |
| D | 1 | 52 | 605465 | 3069.19 | 840 | 823 | 197.0 |
| D | 12 | 233 | 252081 | 1275.4 | 840 | 823 | 197.0 |
| D | 2 | 234 | 22873 | 111.93 | 840 | 823 | 197.0 |
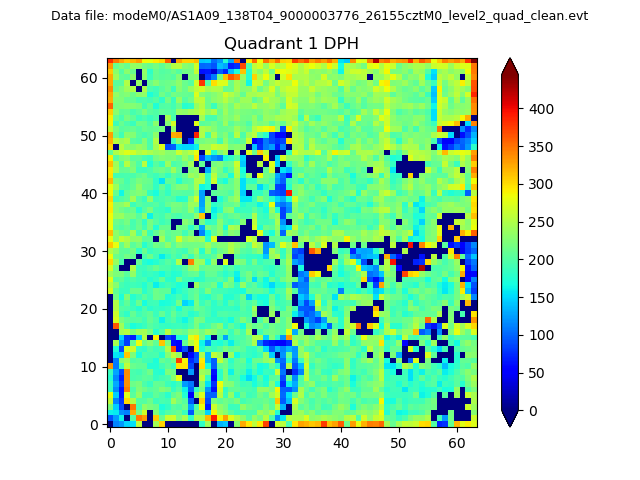
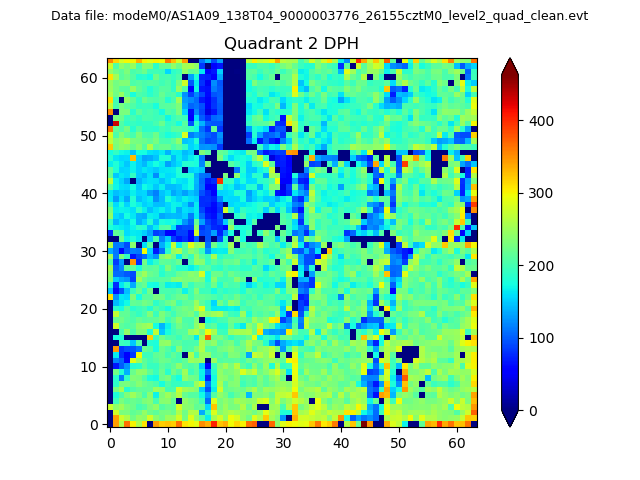
Histogram calculated using DETX and DETY for each event in the final _common_clean file
| Quadrant A | 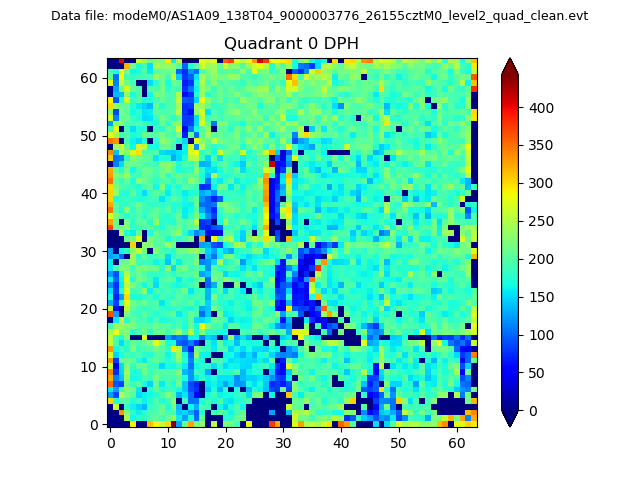 |
 |
Quadrant B |
|---|---|---|---|
| Quadrant D | 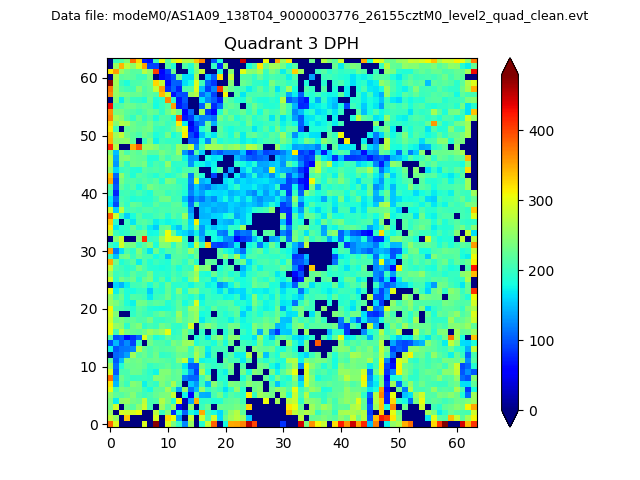 |
 |
Quadrant C |
| Plot type | Count rate plots | Images |
|---|---|---|
| Comparison with Poisson distribution Blue bars denote a histogram of data divided into 1 sec bins. Red curve is a Poisson curve with rate = median count rate of data. |
 |
 |
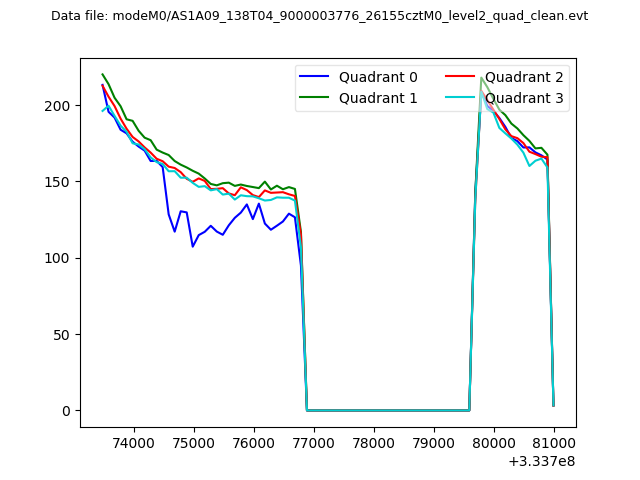
| Quadrant-wise count rates Data is divided into 100 sec bins |
 |
|
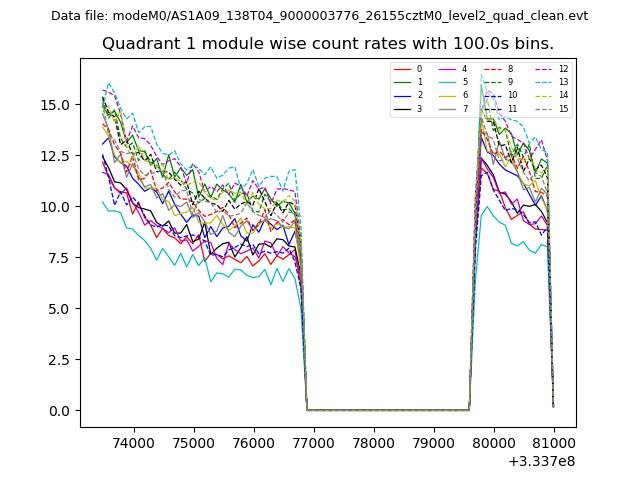
| Module-wise count rates for Quadrant A Data is divided into 100 sec bins |
 |
 |
| Module-wise count rates for Quadrant B Data is divided into 100 sec bins |
 |
 |
| Module-wise count rates for Quadrant C Data is divided into 100 sec bins |
 |
 |
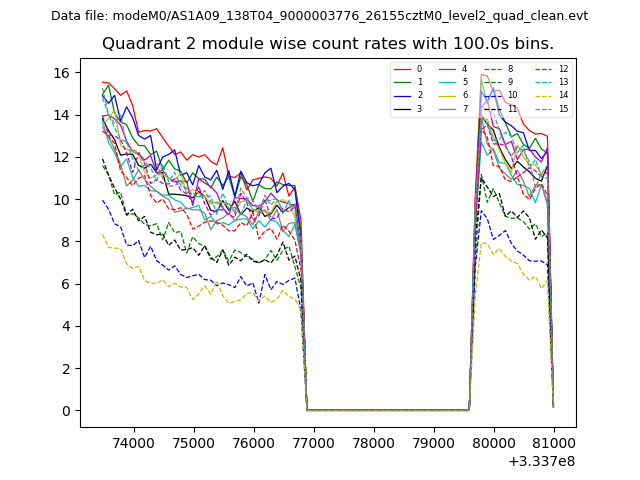
| Module-wise count rates for Quadrant D Data is divided into 100 sec bins |
 |
 |
| Parameter | Plot |
|---|---|
| CZT HV Monitor | 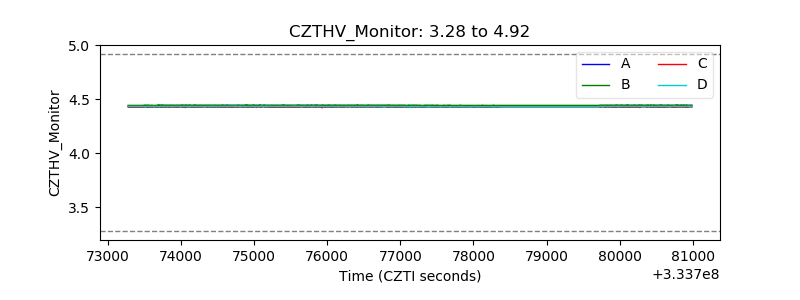 |
| D_VDD | 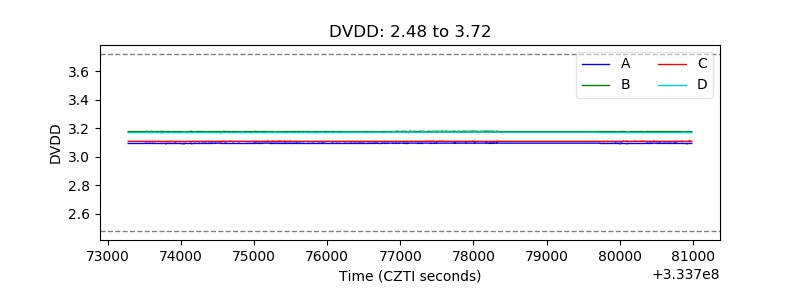 |
| Temperature 1 | 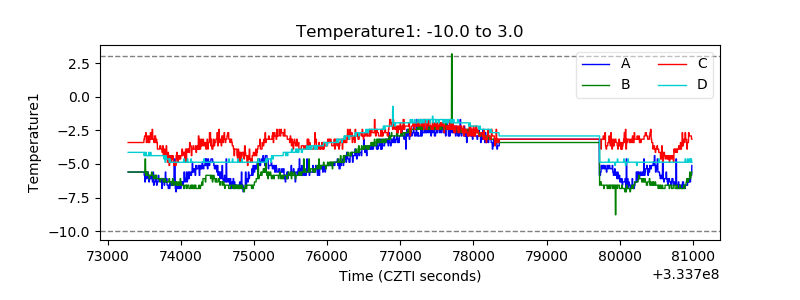 |
| Veto HV Monitor | 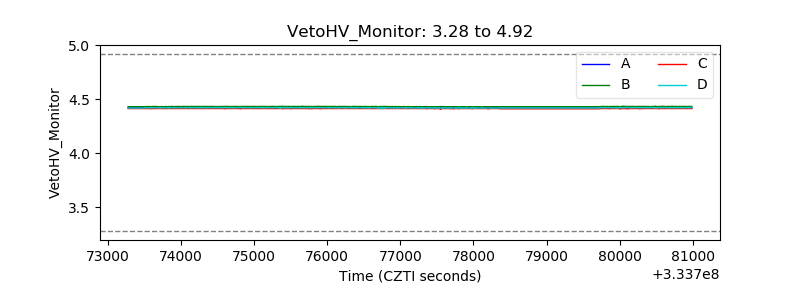 |
| Veto LLD | 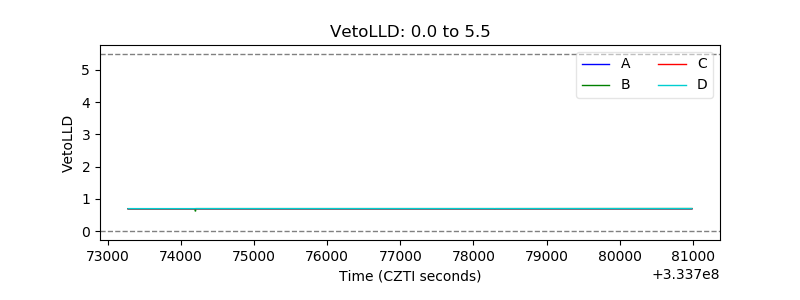 |
| Alpha Counter | 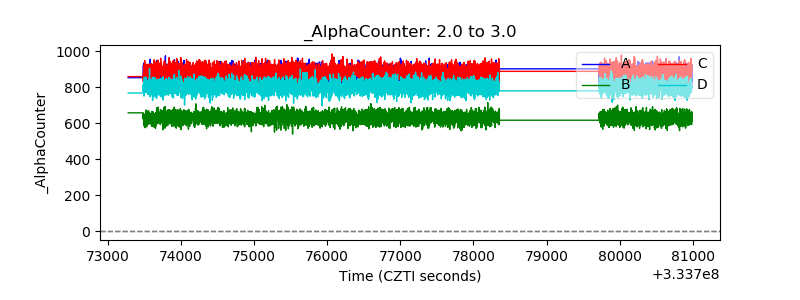 |
| _CPM_Rate | 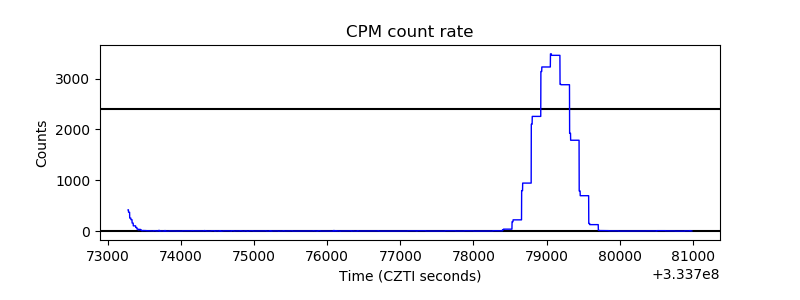 |
| CZT Counter |  |
| +2.5 Volts monitor |  |
| +5 Volts monitor | 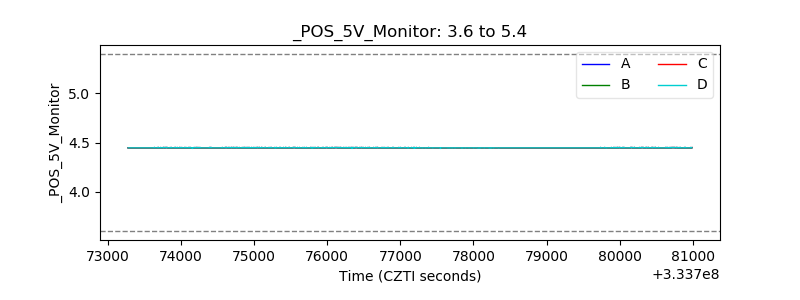 |
| _ROLL_ROT | 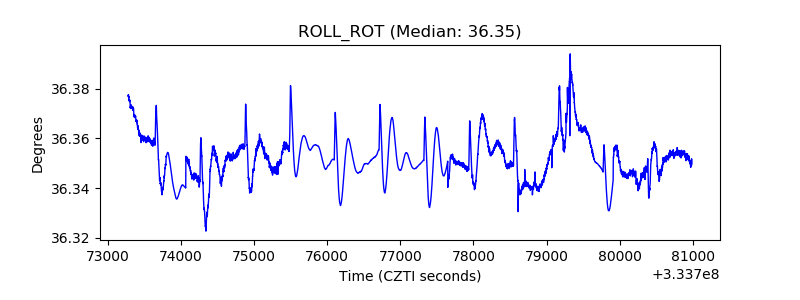 |
| _Roll_DEC |  |
| _Roll_RA |  |
| Veto Counter |  |