| Param | Original file | Final file |
|---|---|---|
| Filename | modeM0/AS1A09_138T04_9000003776_26156cztM0_level2.evt | modeM0/AS1A09_138T04_9000003776_26156cztM0_level2_quad_clean.evt |
| Size (bytes) | 436,204,800 | 95,653,440 |
| Size | 416.0 MB | 91.2 MB |
| Events in quadrant A | 3,032,750 | 622,648 |
| Events in quadrant B | 3,018,646 | 645,617 |
| Events in quadrant C | 3,261,048 | 619,335 |
| Events in quadrant D | 3,511,683 | 611,633 |
| Mode M9 | |||
|---|---|---|---|
| Quadrant | BADHDUFLAG | Total packets | Discarded packets |
| A | 0 | 14 | 0 |
| B | 0 | 14 | 0 |
| C | 0 | 14 | 0 |
| D | 0 | 14 | 0 |
| Mode M0 | |||
|---|---|---|---|
| Quadrant | BADHDUFLAG | Total packets | Discarded packets |
| A | 0 | 12285 | 0 |
| B | 0 | 12270 | 0 |
| C | 0 | 13157 | 0 |
| D | 0 | 13885 | 0 |
| Quadrant | Total seconds | Saturated seconds | Saturation percentage |
|---|---|---|---|
| A | 5685 | 26 | 0.457344% |
| B | 5686 | 43 | 0.756243% |
| C | 5686 | 130 | 2.286317% |
| D | 5686 | 84 | 1.477313% |
Noise dominated data is calculated using 1-second bins in cleaned event files. If a bin has >2000 counts, and if more than 50% of those come from <1% of pixels, then it is considered to be noise-dominated and hence unusable.
| Quadrant | # 1 sec bins | Bins with >0 counts | Bins with >2000 counts | High rate bins dominated by noise | Noise dominated (total time) | Noise dominated (detector-on time) | Marked lightcurve |
|---|---|---|---|---|---|---|---|
| A | 7080 | 5686 | 1 | 1 | 0.01% | 0.02% | 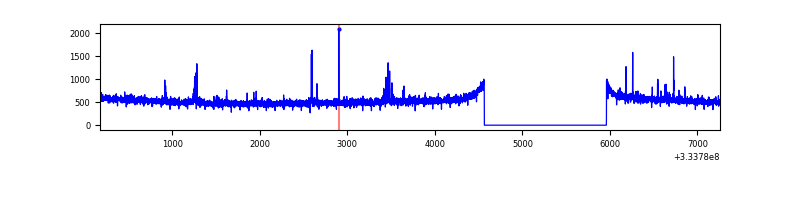 |
| B | 7081 | 5687 | 0 | 0 | 0.00% | 0.00% | 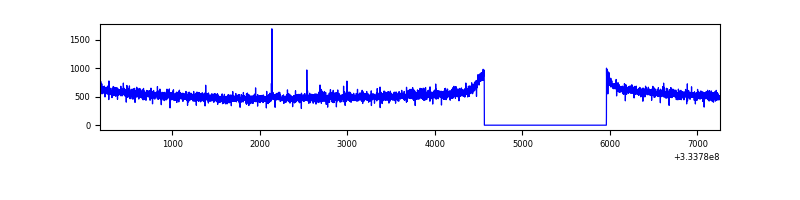 |
| C | 7081 | 5687 | 26 | 26 | 0.37% | 0.46% | 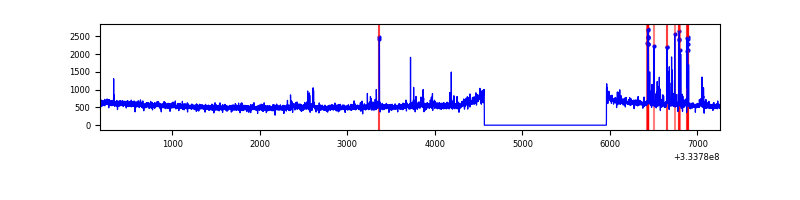 |
| D | 7081 | 5686 | 68 | 68 | 0.96% | 1.20% | 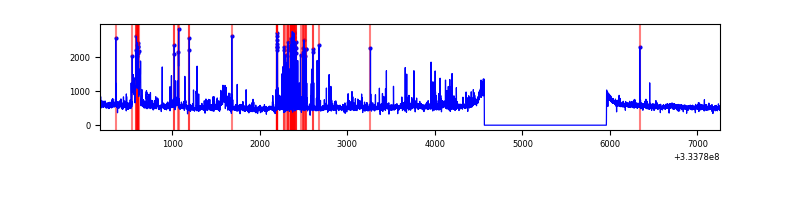 |
Top three noisy pixels from each quadrant. If the there are fewer than three noisy pixels in the level2.evt file, extra rows are filled as -1
| Pixel properties | Quadrant properties | ||||||
|---|---|---|---|---|---|---|---|
| Quadrant | DetID | PixID | Counts | Sigma | Mean | Median | Sigma |
| A | 0 | 13 | 60340 | 393.51 | 771 | 757 | 151.4 |
| A | 13 | 254 | 8545 | 51.43 | 771 | 757 | 151.4 |
| A | 0 | 226 | 6630 | 38.79 | 771 | 757 | 151.4 |
| B | 12 | 111 | 16390 | 108.81 | 769 | 751 | 143.7 |
| B | 11 | 111 | 14959 | 98.85 | 769 | 751 | 143.7 |
| B | 14 | 111 | 13726 | 90.27 | 769 | 751 | 143.7 |
| C | 2 | 16 | 161004 | 906.58 | 757 | 766 | 176.8 |
| C | 14 | 238 | 122735 | 690.06 | 757 | 766 | 176.8 |
| C | 3 | 233 | 16797 | 90.7 | 757 | 766 | 176.8 |
| D | 1 | 52 | 580041 | 3195.37 | 768 | 752 | 181.3 |
| D | 10 | 103 | 23250 | 124.1 | 768 | 752 | 181.3 |
| D | 2 | 234 | 22298 | 118.85 | 768 | 752 | 181.3 |
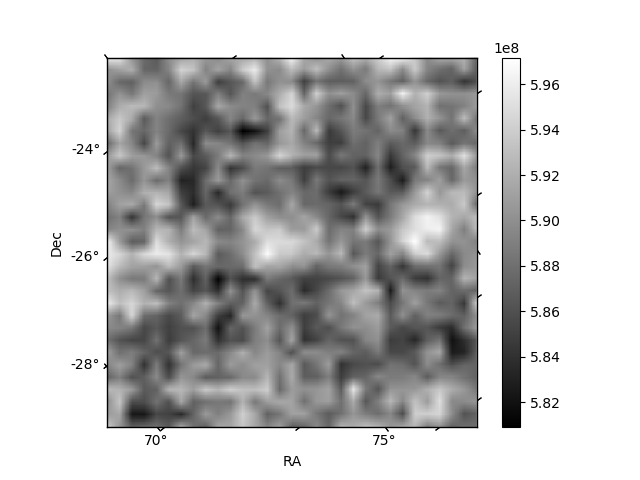
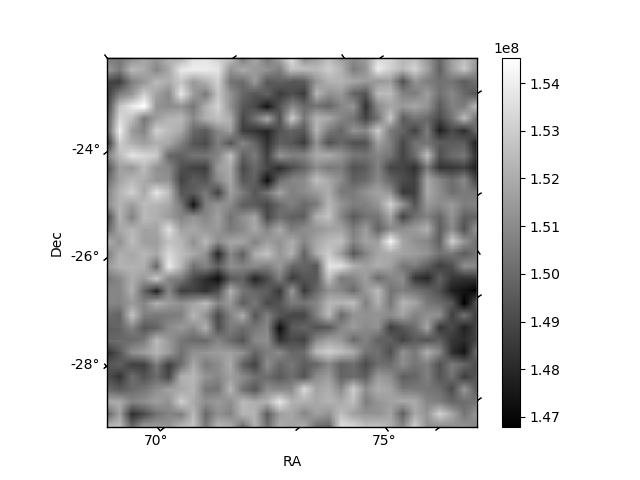
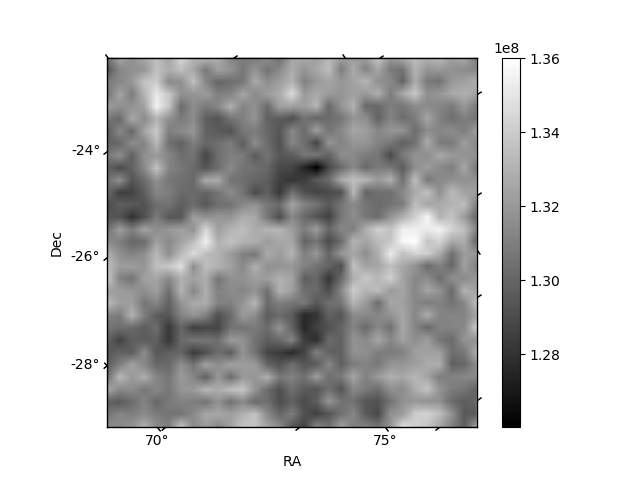
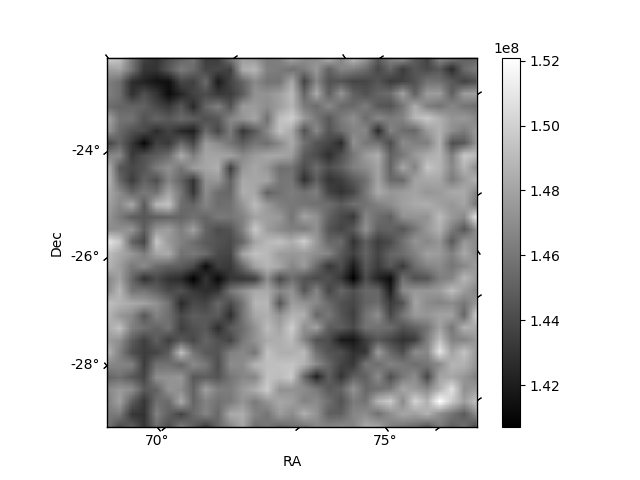
Histogram calculated using DETX and DETY for each event in the final _common_clean file
| Quadrant A | 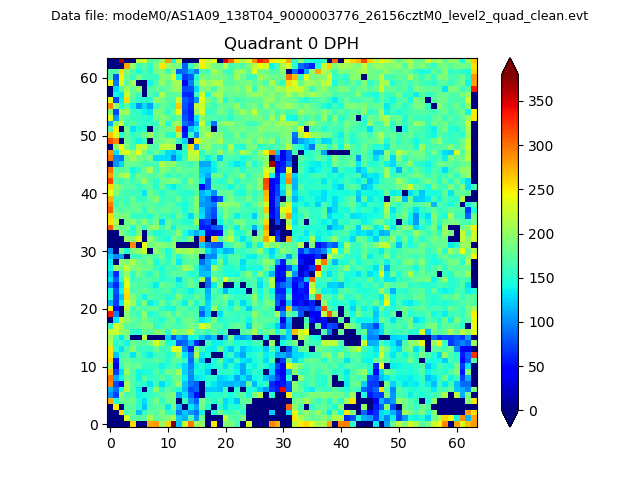 |
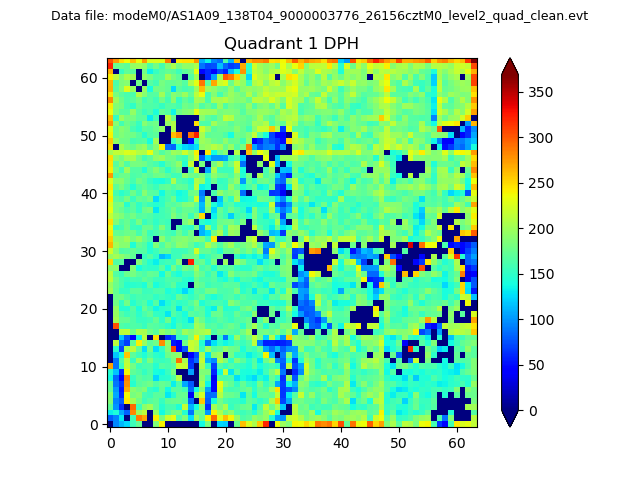 |
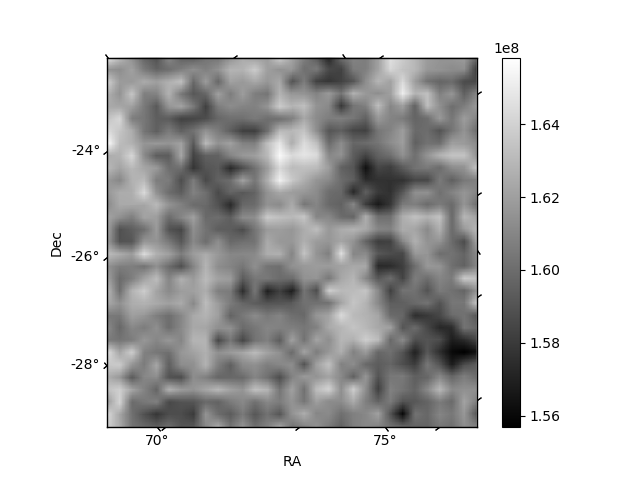
Quadrant B |
|---|---|---|---|
| Quadrant D | 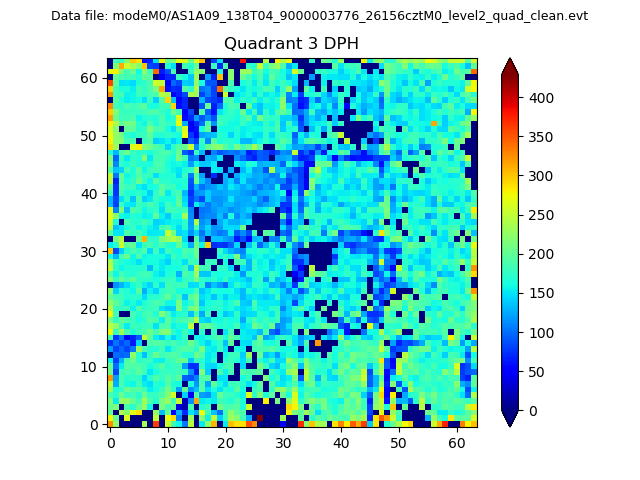 |
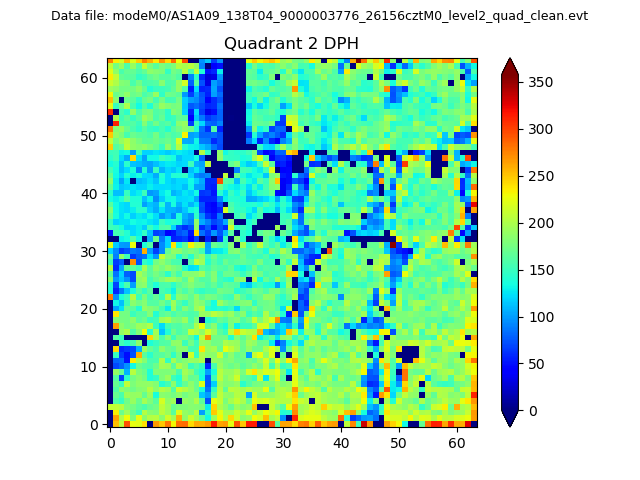 |
Quadrant C |
| Plot type | Count rate plots | Images |
|---|---|---|
| Comparison with Poisson distribution Blue bars denote a histogram of data divided into 1 sec bins. Red curve is a Poisson curve with rate = median count rate of data. |
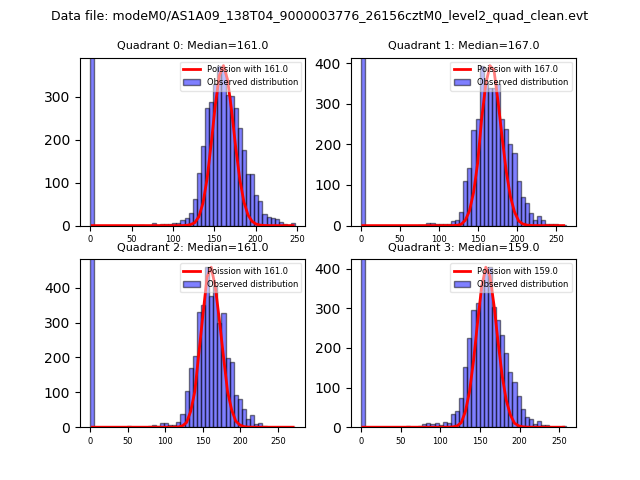 |
 |
| Quadrant-wise count rates Data is divided into 100 sec bins |
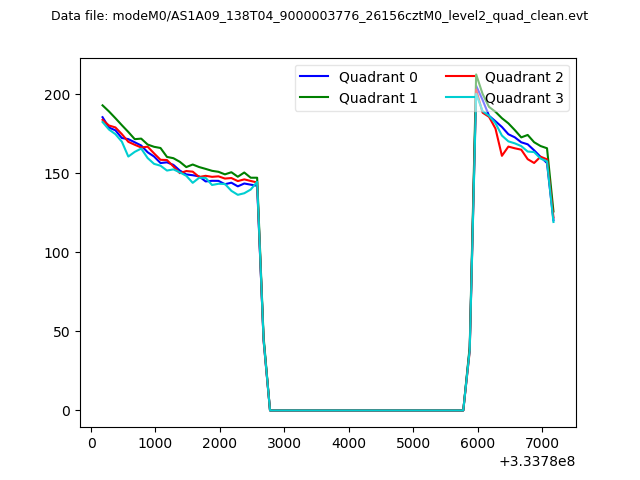 |
|
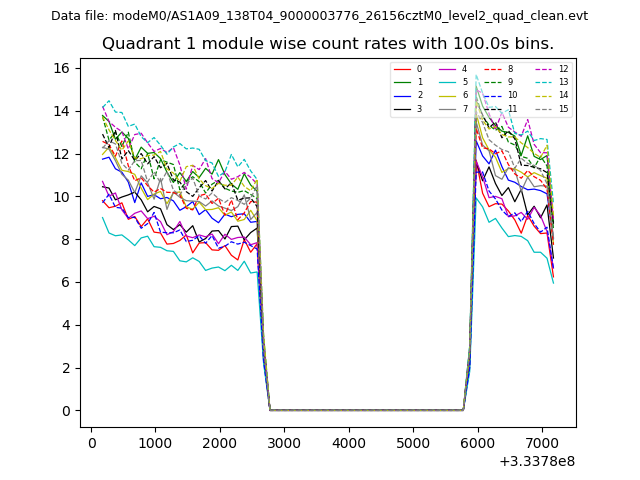
| Module-wise count rates for Quadrant A Data is divided into 100 sec bins |
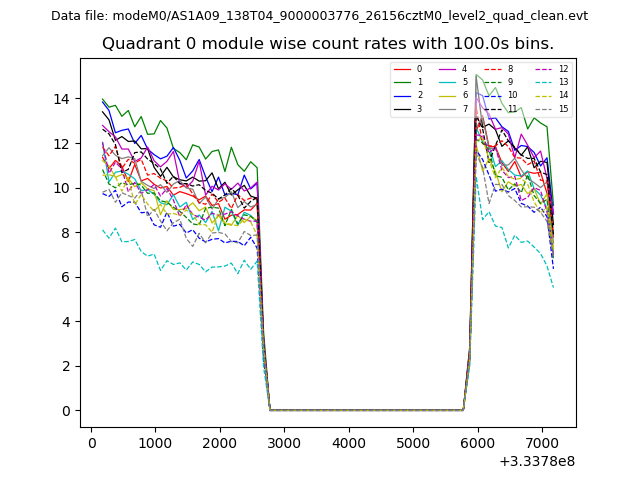 |
 |
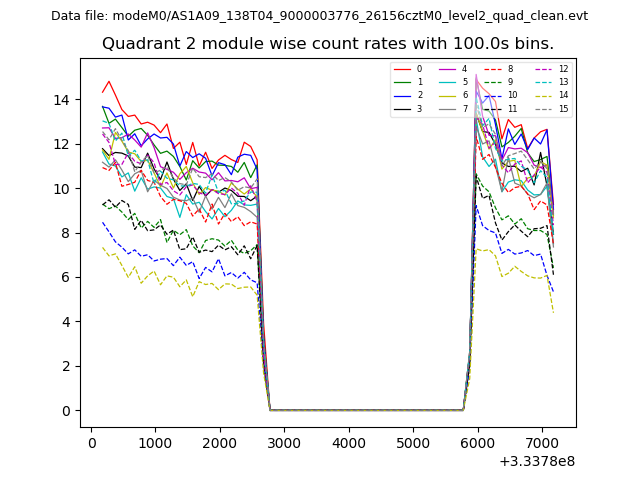
| Module-wise count rates for Quadrant B Data is divided into 100 sec bins |
 |
 |
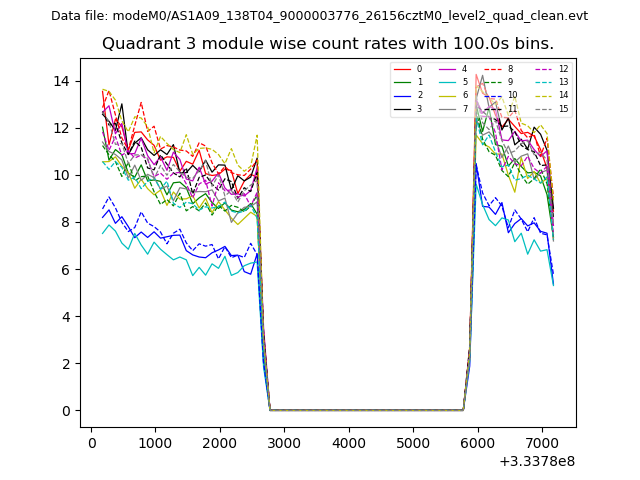
| Module-wise count rates for Quadrant C Data is divided into 100 sec bins |
 |
 |
| Module-wise count rates for Quadrant D Data is divided into 100 sec bins |
 |
 |
| Parameter | Plot |
|---|---|
| CZT HV Monitor | 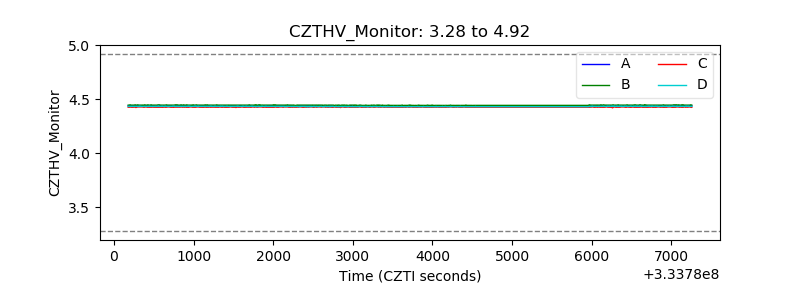 |
| D_VDD | 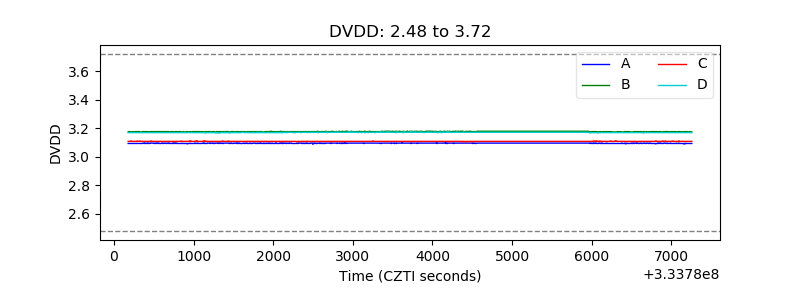 |
| Temperature 1 | 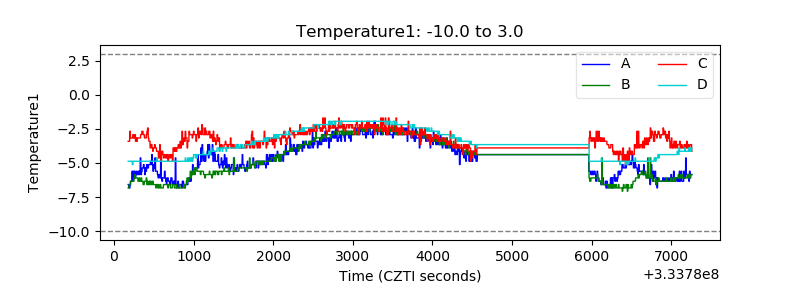 |
| Veto HV Monitor | 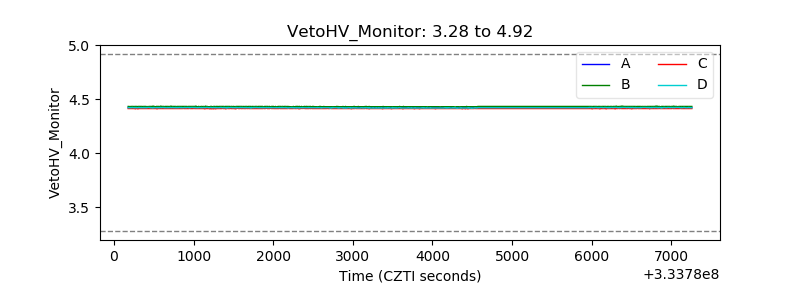 |
| Veto LLD | 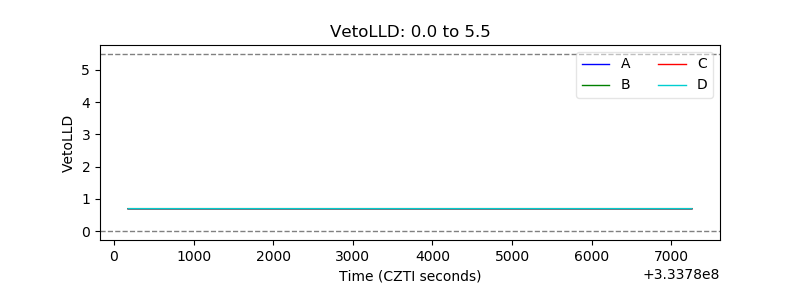 |
| Alpha Counter | 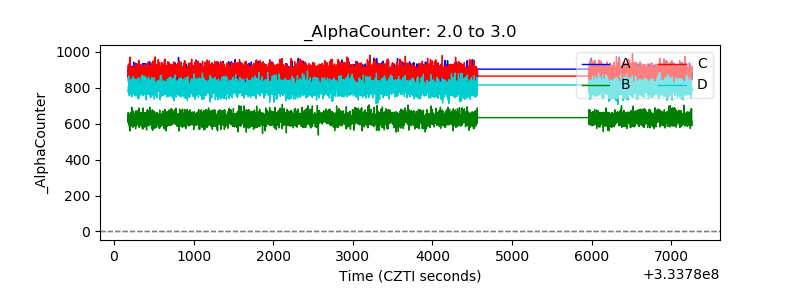 |
| _CPM_Rate | 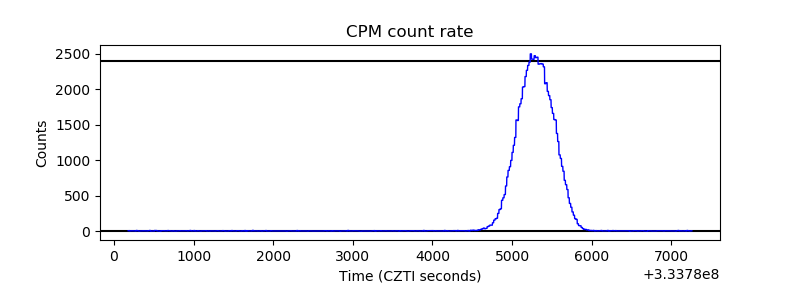 |
| CZT Counter | 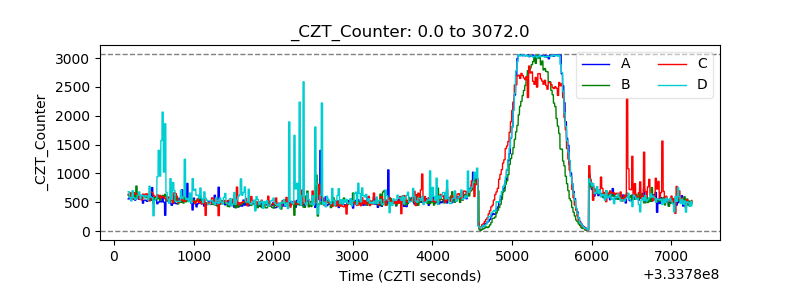 |
| +2.5 Volts monitor | 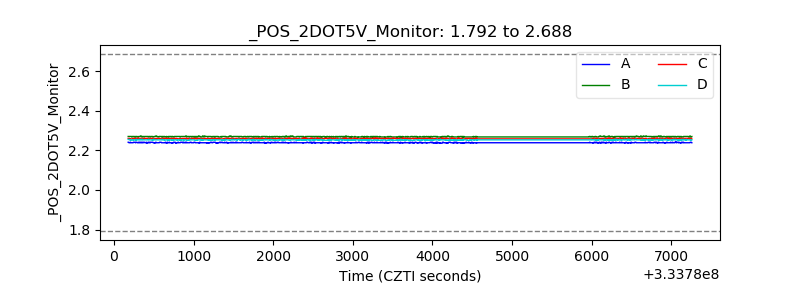 |
| +5 Volts monitor | 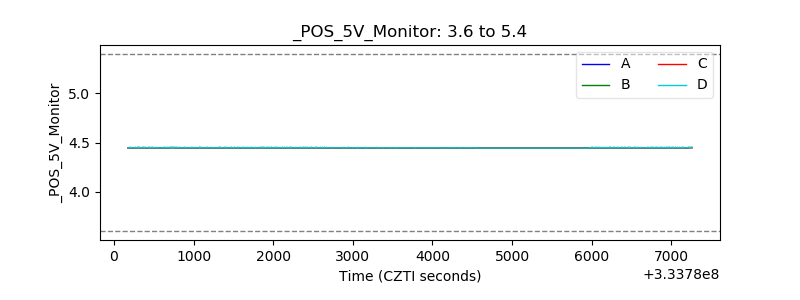 |
| _ROLL_ROT | 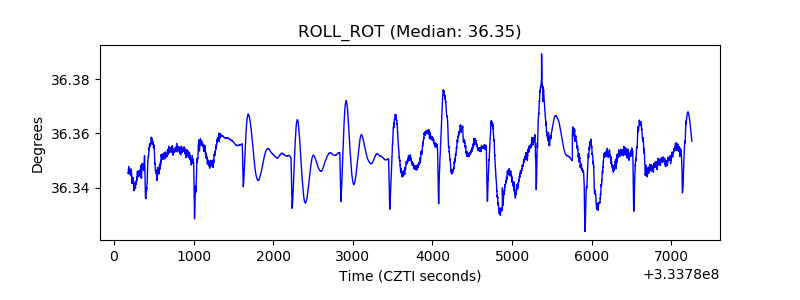 |
| _Roll_DEC | 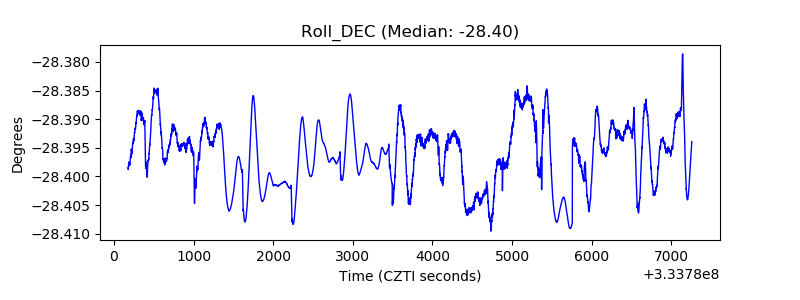 |
| _Roll_RA | 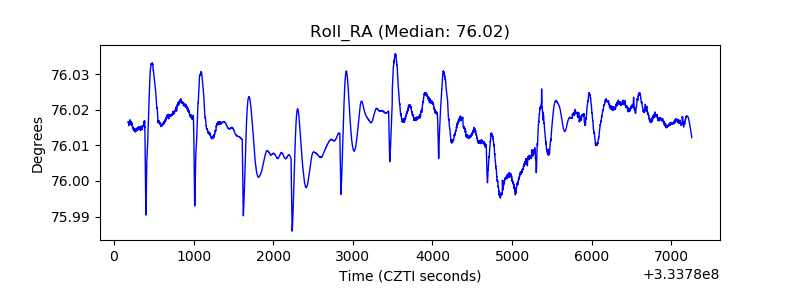 |
| Veto Counter | 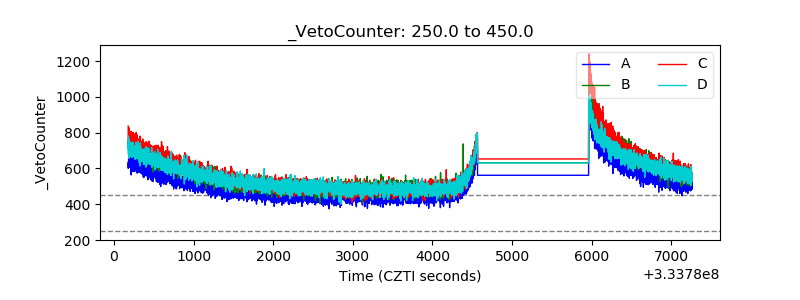 |