| Param | Original file | Final file |
|---|---|---|
| Filename | modeM0/AS1A09_138T04_9000003776_26157cztM0_level2.evt | modeM0/AS1A09_138T04_9000003776_26157cztM0_level2_quad_clean.evt |
| Size (bytes) | 502,989,120 | 98,138,880 |
| Size | 479.7 MB | 93.6 MB |
| Events in quadrant A | 3,357,505 | 639,898 |
| Events in quadrant B | 3,267,654 | 656,922 |
| Events in quadrant C | 4,104,120 | 613,704 |
| Events in quadrant D | 4,076,180 | 621,696 |
| Mode M9 | |||
|---|---|---|---|
| Quadrant | BADHDUFLAG | Total packets | Discarded packets |
| A | 0 | 13 | 0 |
| B | 0 | 13 | 0 |
| C | 0 | 13 | 0 |
| D | 0 | 13 | 0 |
| Mode M0 | |||
|---|---|---|---|
| Quadrant | BADHDUFLAG | Total packets | Discarded packets |
| A | 0 | 13611 | 0 |
| B | 0 | 13308 | 0 |
| C | 0 | 16013 | 0 |
| D | 0 | 16009 | 0 |
| Quadrant | Total seconds | Saturated seconds | Saturation percentage |
|---|---|---|---|
| A | 6300 | 76 | 1.206349% |
| B | 6301 | 86 | 1.364863% |
| C | 6301 | 374 | 5.935566% |
| D | 6301 | 160 | 2.539279% |
Noise dominated data is calculated using 1-second bins in cleaned event files. If a bin has >2000 counts, and if more than 50% of those come from <1% of pixels, then it is considered to be noise-dominated and hence unusable.
| Quadrant | # 1 sec bins | Bins with >0 counts | Bins with >2000 counts | High rate bins dominated by noise | Noise dominated (total time) | Noise dominated (detector-on time) | Marked lightcurve |
|---|---|---|---|---|---|---|---|
| A | 7610 | 6300 | 8 | 8 | 0.11% | 0.13% | 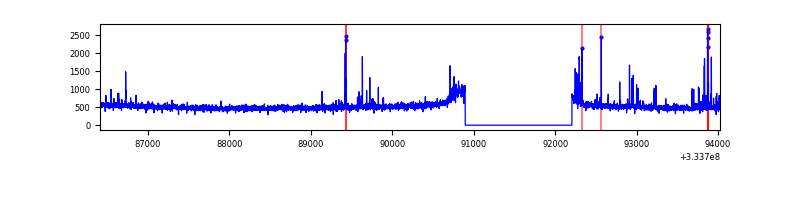 |
| B | 7611 | 6301 | 3 | 3 | 0.04% | 0.05% | 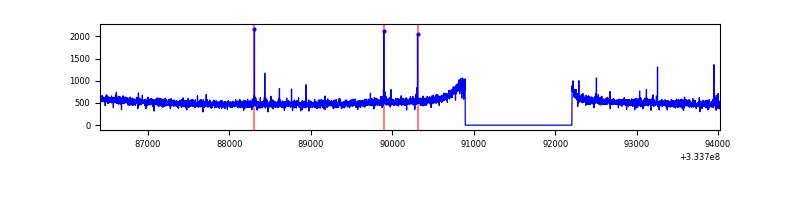 |
| C | 7611 | 6301 | 207 | 207 | 2.72% | 3.29% | 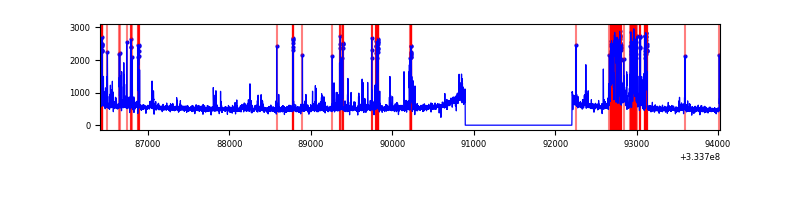 |
| D | 7611 | 6301 | 97 | 97 | 1.27% | 1.54% | 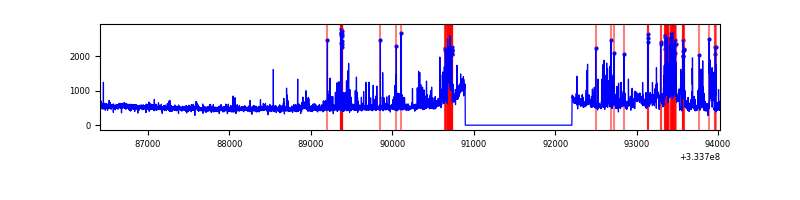 |
Top three noisy pixels from each quadrant. If the there are fewer than three noisy pixels in the level2.evt file, extra rows are filled as -1
| Pixel properties | Quadrant properties | ||||||
|---|---|---|---|---|---|---|---|
| Quadrant | DetID | PixID | Counts | Sigma | Mean | Median | Sigma |
| A | 0 | 13 | 132648 | 792.24 | 837 | 820 | 166.4 |
| A | 13 | 254 | 9150 | 50.06 | 837 | 820 | 166.4 |
| A | 3 | 137 | 7158 | 38.09 | 837 | 820 | 166.4 |
| B | 12 | 111 | 18315 | 111.19 | 828 | 807 | 157.5 |
| B | 11 | 111 | 16748 | 101.23 | 828 | 807 | 157.5 |
| B | 14 | 111 | 15201 | 91.41 | 828 | 807 | 157.5 |
| C | 2 | 16 | 818704 | 4388.22 | 799 | 805 | 186.4 |
| C | 14 | 238 | 129809 | 692.14 | 799 | 805 | 186.4 |
| C | 3 | 233 | 43327 | 228.14 | 799 | 805 | 186.4 |
| D | 1 | 52 | 649356 | 3309.73 | 827 | 809 | 196.0 |
| D | 12 | 233 | 257124 | 1308.05 | 827 | 809 | 196.0 |
| D | 13 | 104 | 44267 | 221.78 | 827 | 809 | 196.0 |
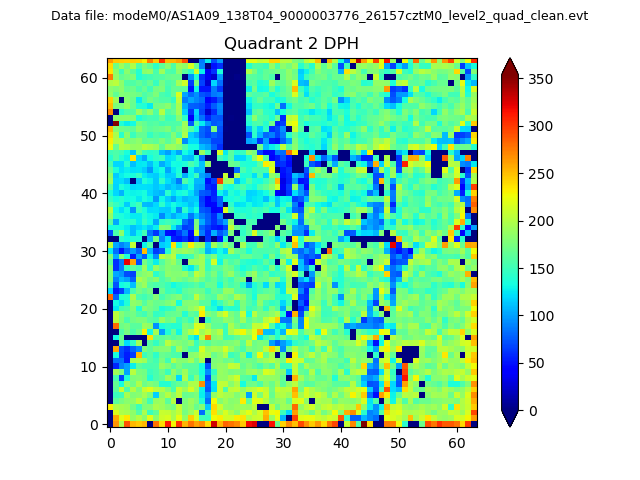
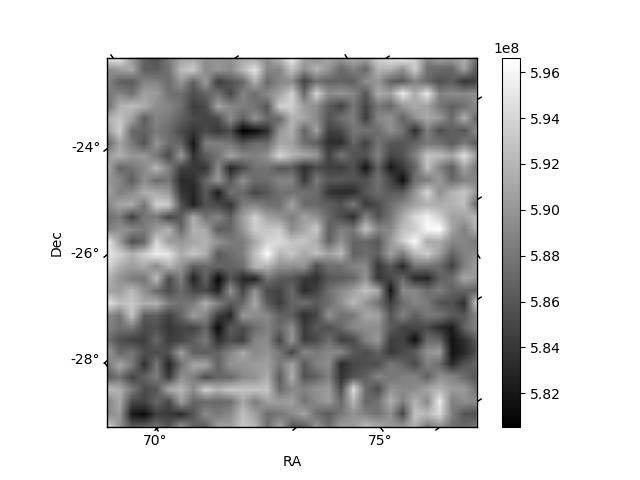
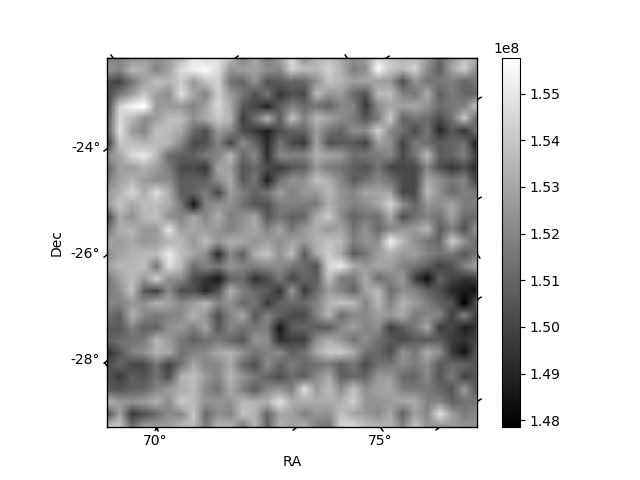
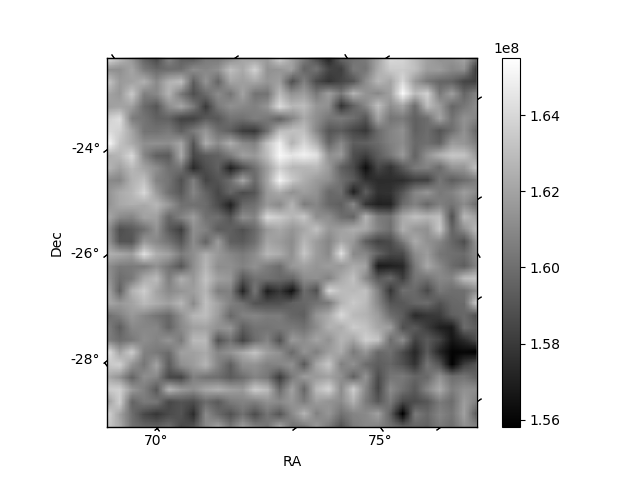
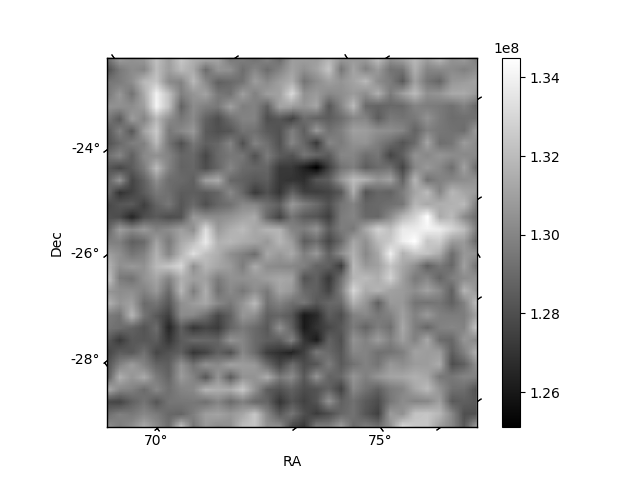
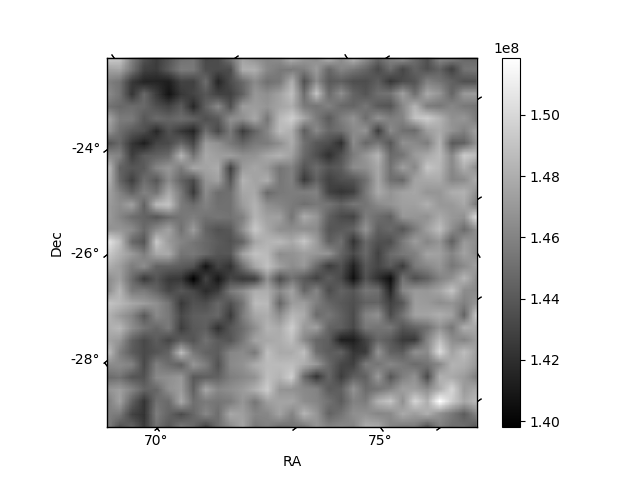
Histogram calculated using DETX and DETY for each event in the final _common_clean file
| Quadrant A | 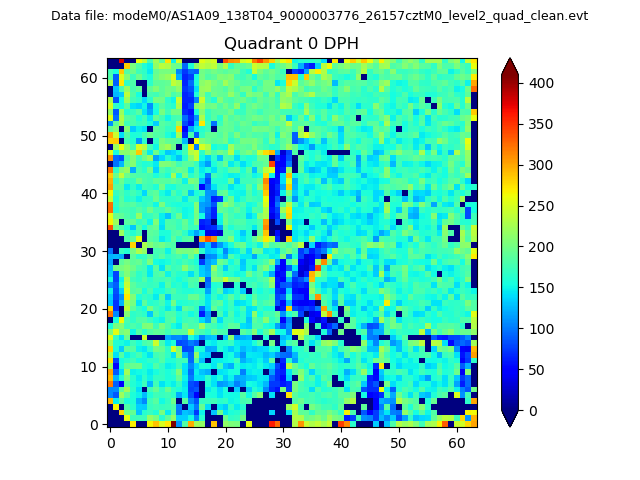 |
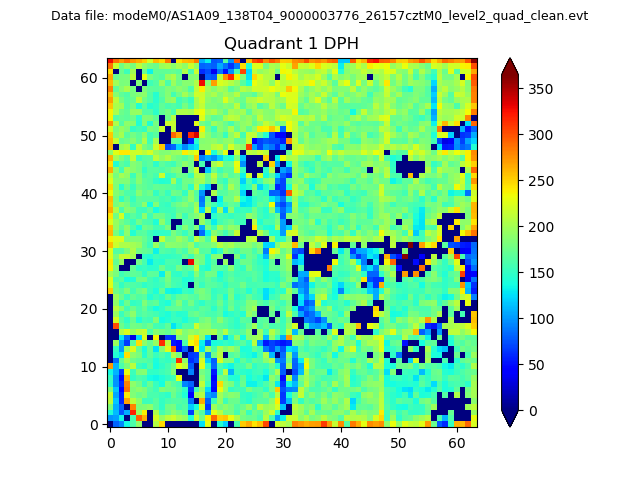 |
Quadrant B |
|---|---|---|---|
| Quadrant D | 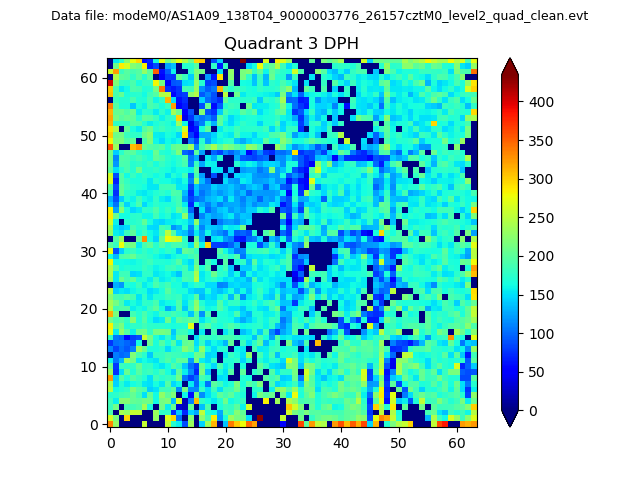 |
 |
Quadrant C |
| Plot type | Count rate plots | Images |
|---|---|---|
| Comparison with Poisson distribution Blue bars denote a histogram of data divided into 1 sec bins. Red curve is a Poisson curve with rate = median count rate of data. |
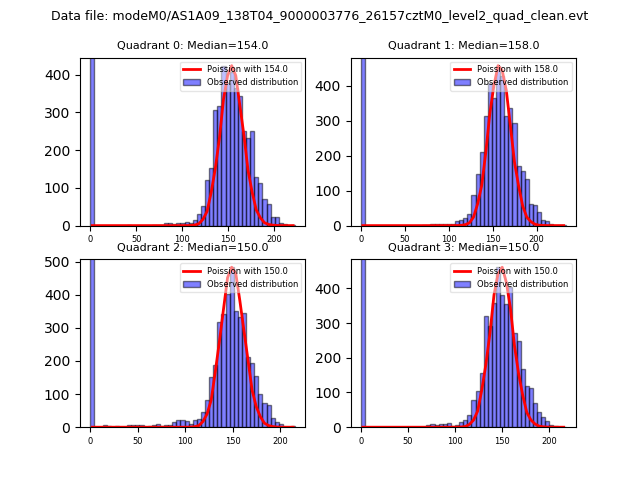 |
 |
| Quadrant-wise count rates Data is divided into 100 sec bins |
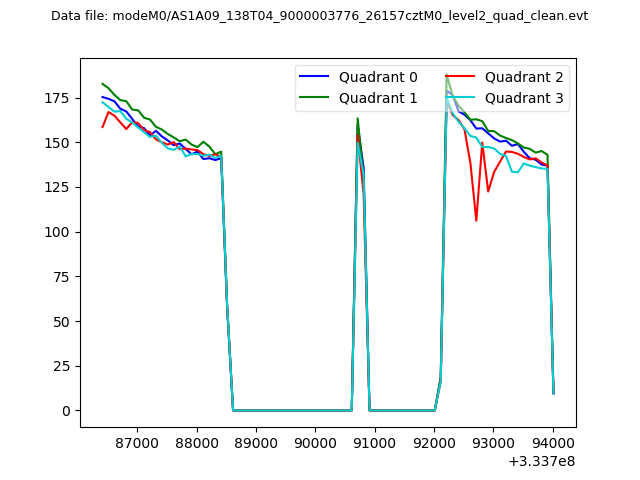 |
|
| Module-wise count rates for Quadrant A Data is divided into 100 sec bins |
 |
 |
| Module-wise count rates for Quadrant B Data is divided into 100 sec bins |
 |
 |
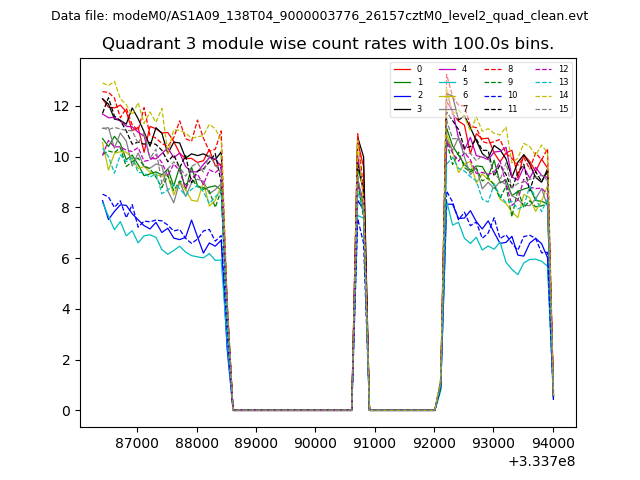
| Module-wise count rates for Quadrant C Data is divided into 100 sec bins |
 |
 |
| Module-wise count rates for Quadrant D Data is divided into 100 sec bins |
 |
 |
| Parameter | Plot |
|---|---|
| CZT HV Monitor |  |
| D_VDD | 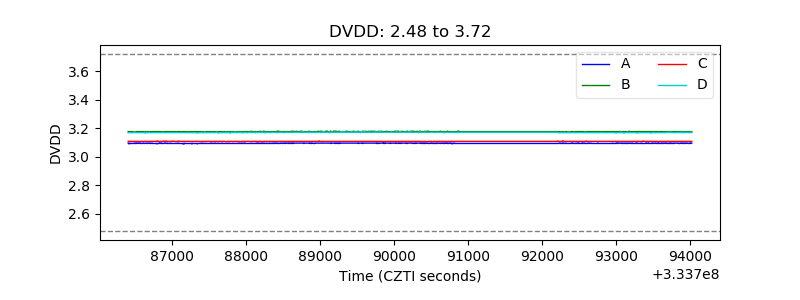 |
| Temperature 1 | 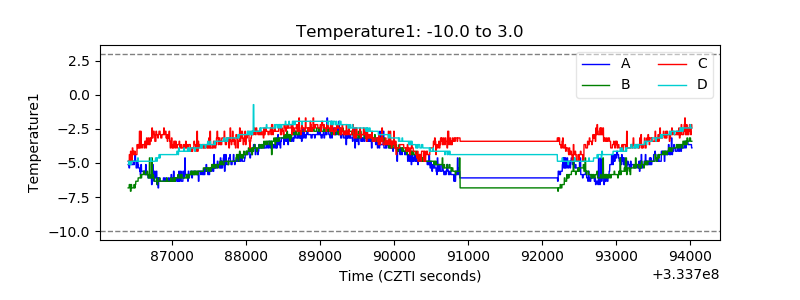 |
| Veto HV Monitor |  |
| Veto LLD |  |
| Alpha Counter | 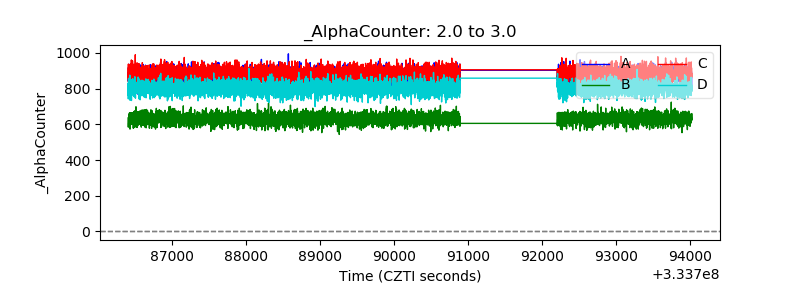 |
| _CPM_Rate | 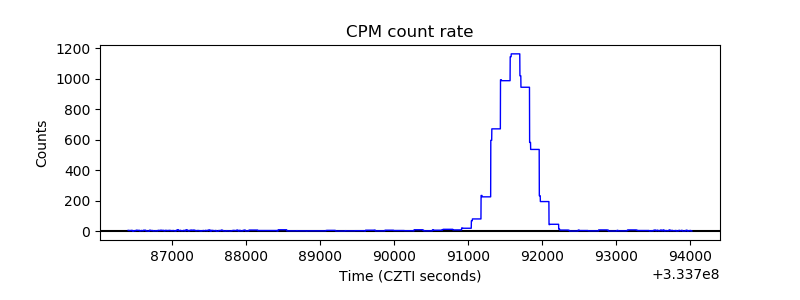 |
| CZT Counter | 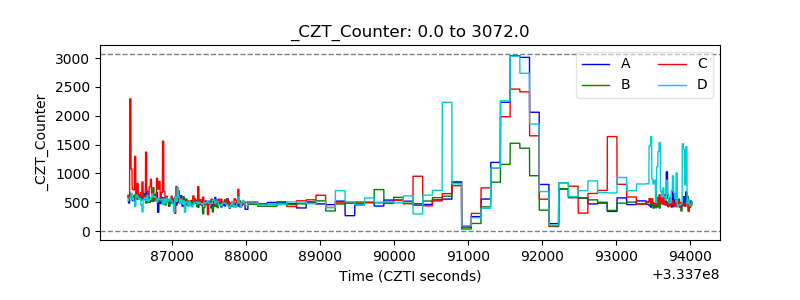 |
| +2.5 Volts monitor | 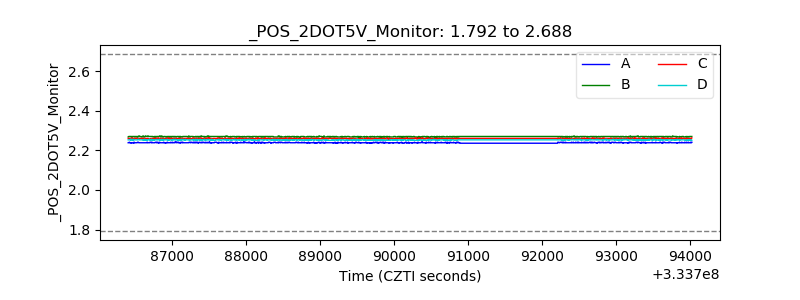 |
| +5 Volts monitor |  |
| _ROLL_ROT |  |
| _Roll_DEC | 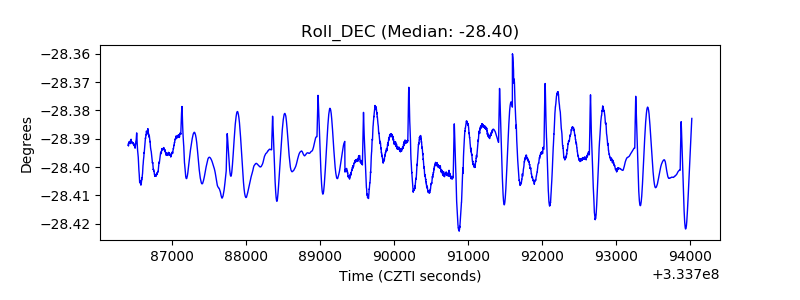 |
| _Roll_RA | 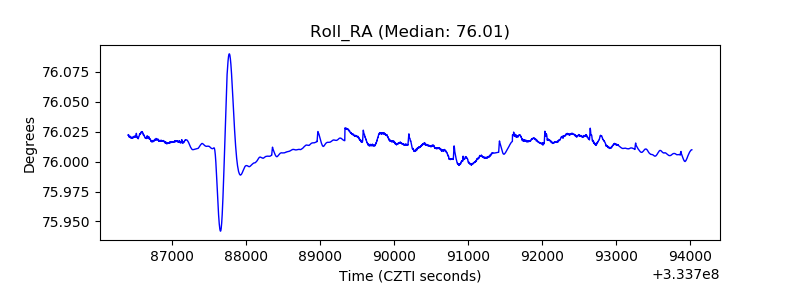 |
| Veto Counter | 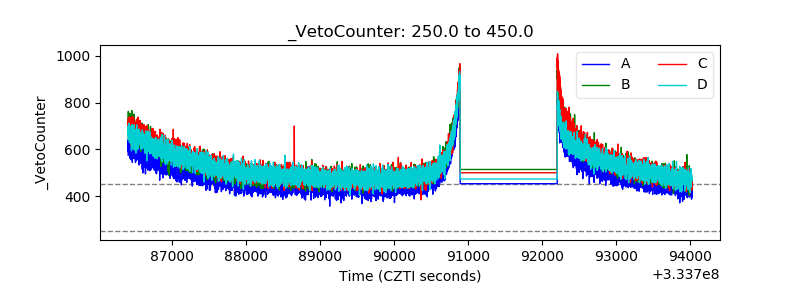 |