| Param | Original file | Final file |
|---|---|---|
| Filename | modeM0/AS1A09_138T04_9000003776_26158cztM0_level2.evt | modeM0/AS1A09_138T04_9000003776_26158cztM0_level2_quad_clean.evt |
| Size (bytes) | 515,185,920 | 91,635,840 |
| Size | 491.3 MB | 87.4 MB |
| Events in quadrant A | 3,488,199 | 592,913 |
| Events in quadrant B | 3,173,891 | 606,185 |
| Events in quadrant C | 3,859,163 | 567,034 |
| Events in quadrant D | 4,654,812 | 570,052 |
| Mode M9 | |||
|---|---|---|---|
| Quadrant | BADHDUFLAG | Total packets | Discarded packets |
| A | 0 | 11 | 0 |
| B | 0 | 11 | 0 |
| C | 0 | 11 | 0 |
| D | 0 | 11 | 0 |
| Mode M0 | |||
|---|---|---|---|
| Quadrant | BADHDUFLAG | Total packets | Discarded packets |
| A | 0 | 14194 | 0 |
| B | 0 | 13175 | 0 |
| C | 0 | 15337 | 0 |
| D | 0 | 17907 | 0 |
| Quadrant | Total seconds | Saturated seconds | Saturation percentage |
|---|---|---|---|
| A | 6286 | 84 | 1.336303% |
| B | 6287 | 72 | 1.145220% |
| C | 6287 | 278 | 4.421823% |
| D | 6287 | 211 | 3.356132% |
Noise dominated data is calculated using 1-second bins in cleaned event files. If a bin has >2000 counts, and if more than 50% of those come from <1% of pixels, then it is considered to be noise-dominated and hence unusable.
| Quadrant | # 1 sec bins | Bins with >0 counts | Bins with >2000 counts | High rate bins dominated by noise | Noise dominated (total time) | Noise dominated (detector-on time) | Marked lightcurve |
|---|---|---|---|---|---|---|---|
| A | 7371 | 6287 | 34 | 34 | 0.46% | 0.54% | 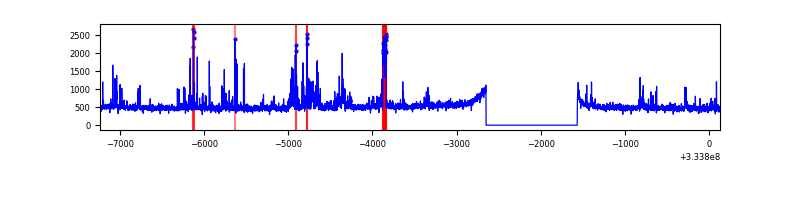 |
| B | 7372 | 6287 | 0 | 0 | 0.00% | 0.00% | 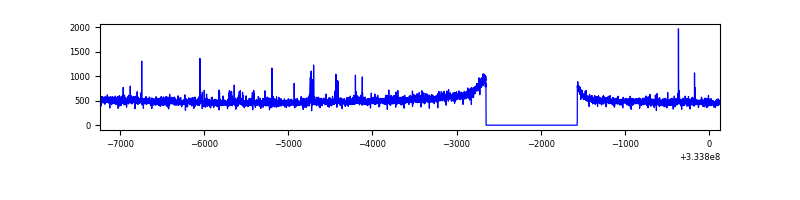 |
| C | 7372 | 6287 | 129 | 129 | 1.75% | 2.05% | 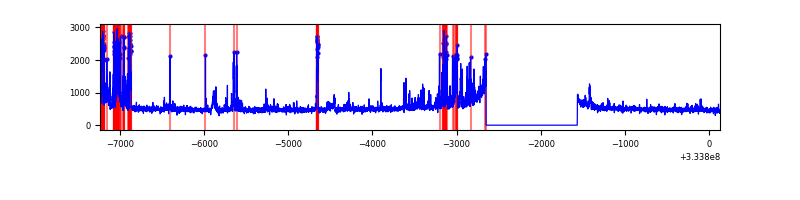 |
| D | 7372 | 6287 | 171 | 171 | 2.32% | 2.72% | 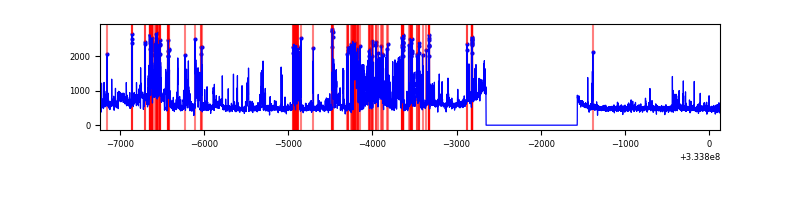 |
Top three noisy pixels from each quadrant. If the there are fewer than three noisy pixels in the level2.evt file, extra rows are filled as -1
| Pixel properties | Quadrant properties | ||||||
|---|---|---|---|---|---|---|---|
| Quadrant | DetID | PixID | Counts | Sigma | Mean | Median | Sigma |
| A | 0 | 13 | 376217 | 2325.11 | 807 | 790 | 161.5 |
| A | 13 | 254 | 9135 | 51.68 | 807 | 790 | 161.5 |
| A | 3 | 137 | 7293 | 40.27 | 807 | 790 | 161.5 |
| B | 0 | 245 | 22588 | 142.43 | 797 | 776 | 153.1 |
| B | 12 | 111 | 18205 | 113.81 | 797 | 776 | 153.1 |
| B | 11 | 111 | 16611 | 103.4 | 797 | 776 | 153.1 |
| C | 2 | 16 | 694123 | 3907.39 | 764 | 771 | 177.4 |
| C | 14 | 238 | 122177 | 684.18 | 764 | 771 | 177.4 |
| C | 3 | 233 | 59207 | 329.32 | 764 | 771 | 177.4 |
| D | 1 | 52 | 1297793 | 6954.34 | 787 | 771 | 186.5 |
| D | 12 | 233 | 360086 | 1926.57 | 787 | 771 | 186.5 |
| D | 2 | 234 | 24046 | 124.8 | 787 | 771 | 186.5 |
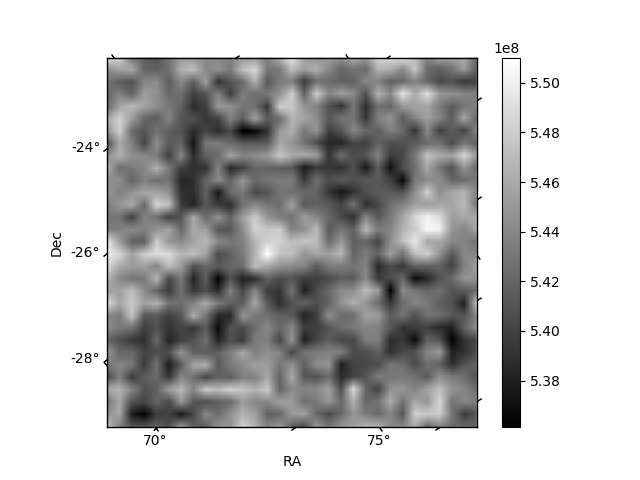
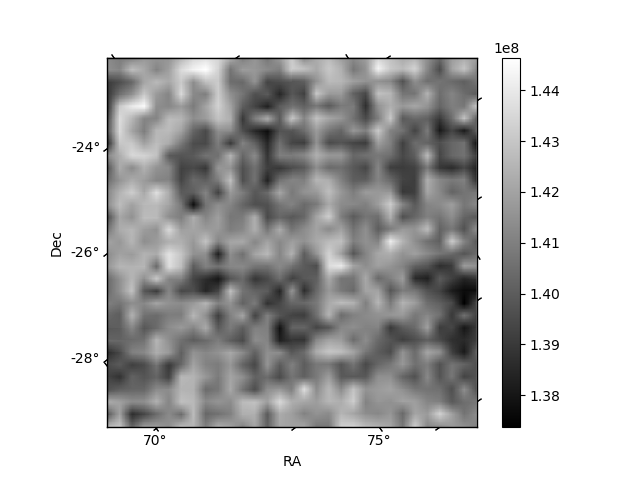
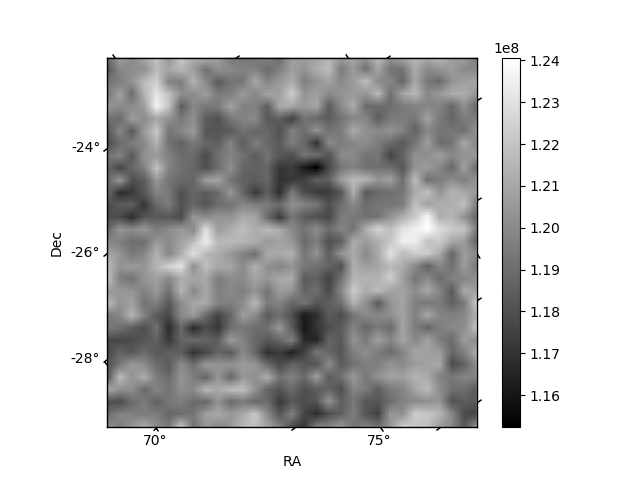
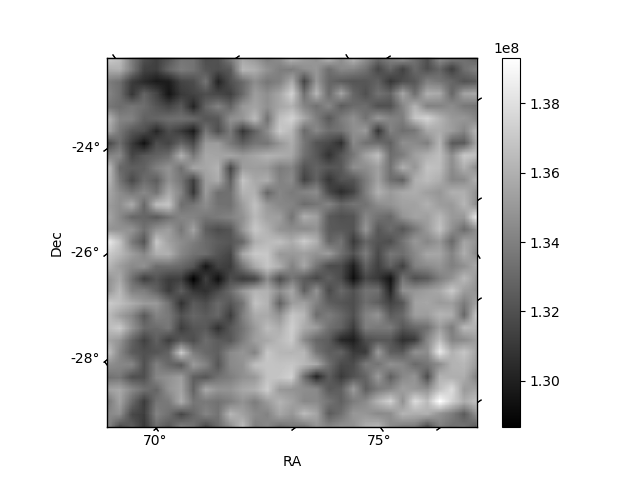
Histogram calculated using DETX and DETY for each event in the final _common_clean file
| Quadrant A | 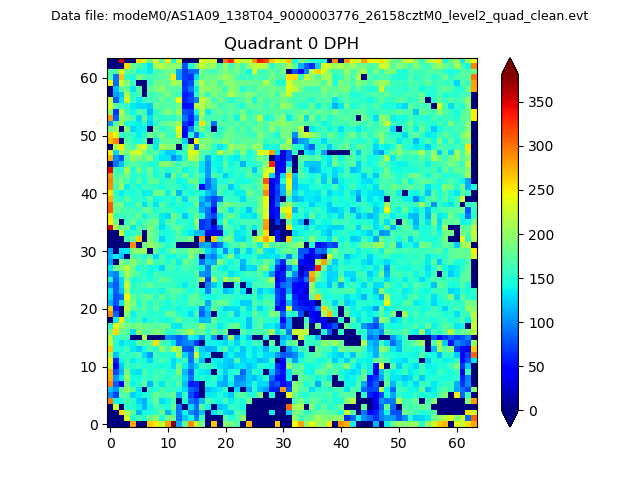 |
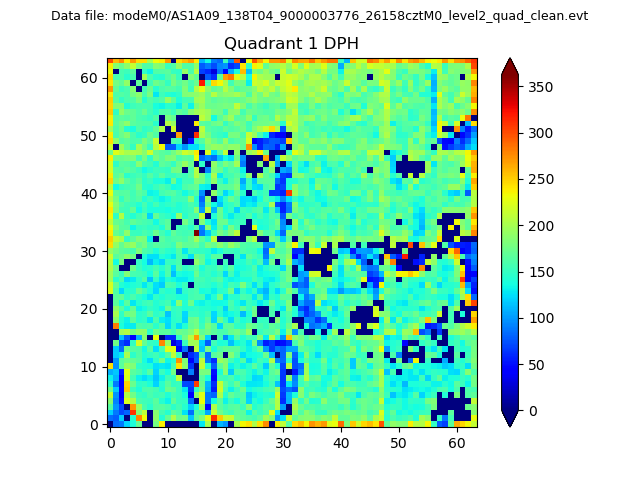 |
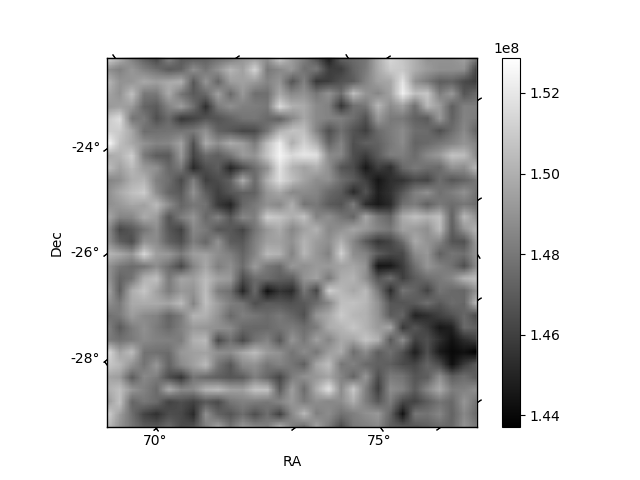
Quadrant B |
|---|---|---|---|
| Quadrant D | 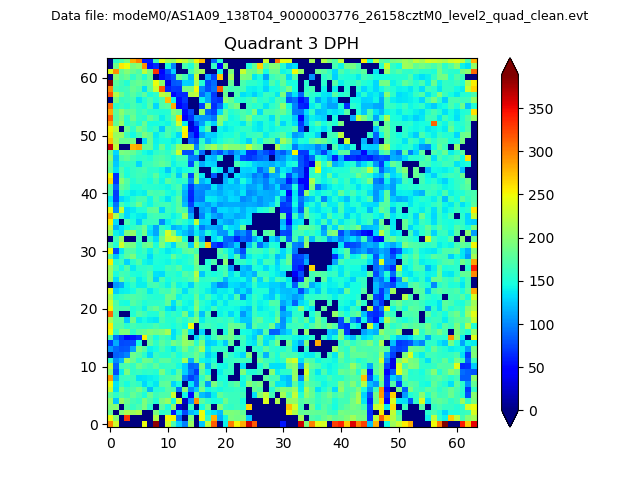 |
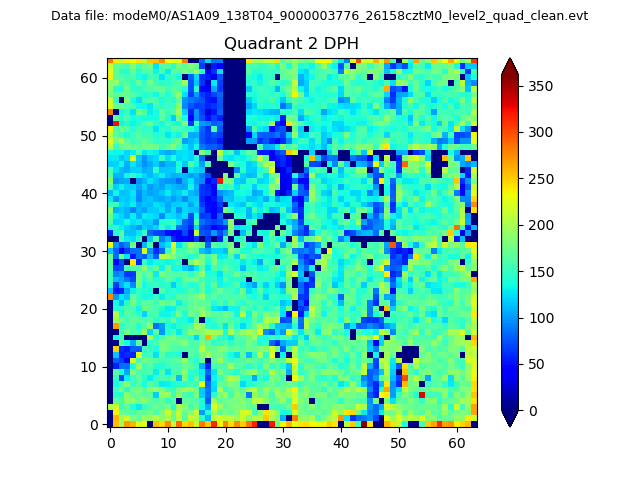 |
Quadrant C |
| Plot type | Count rate plots | Images |
|---|---|---|
| Comparison with Poisson distribution Blue bars denote a histogram of data divided into 1 sec bins. Red curve is a Poisson curve with rate = median count rate of data. |
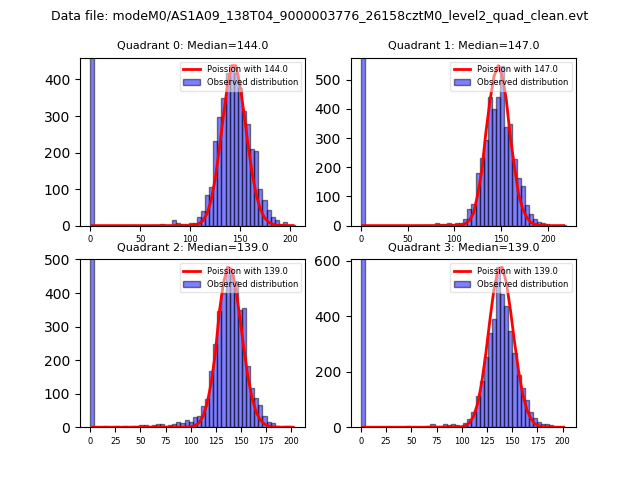 |
 |
| Quadrant-wise count rates Data is divided into 100 sec bins |
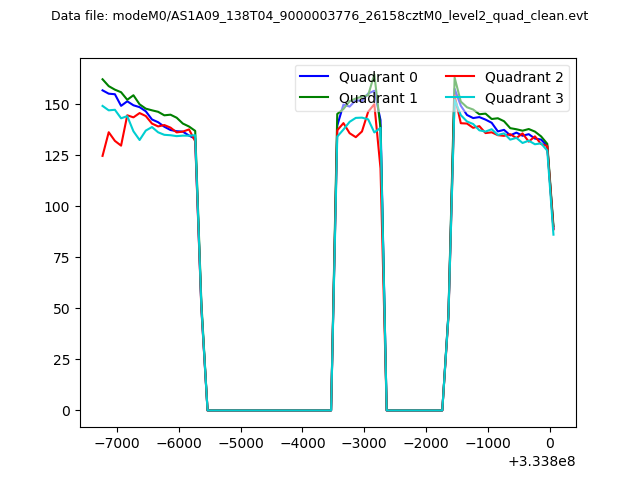 |
|
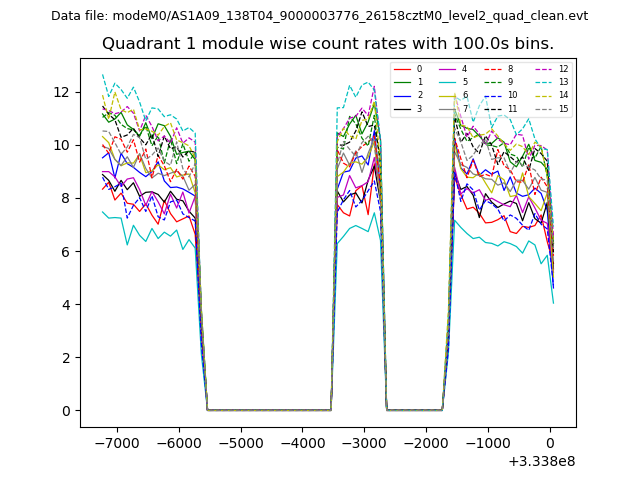
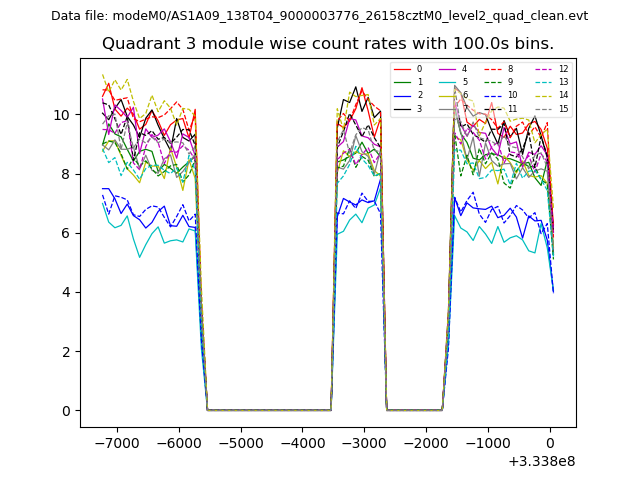
| Module-wise count rates for Quadrant A Data is divided into 100 sec bins |
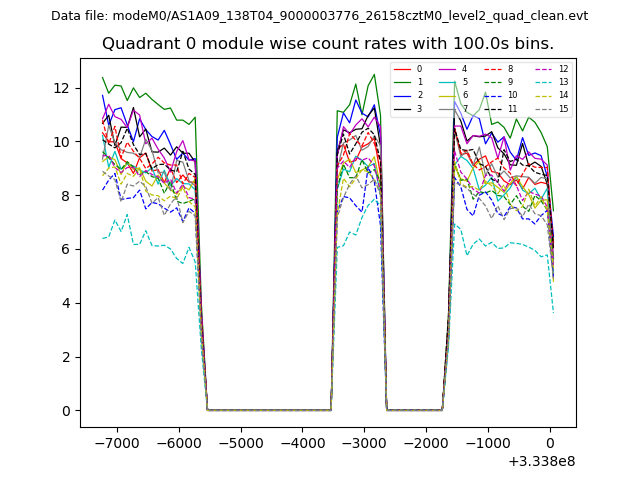 |
 |
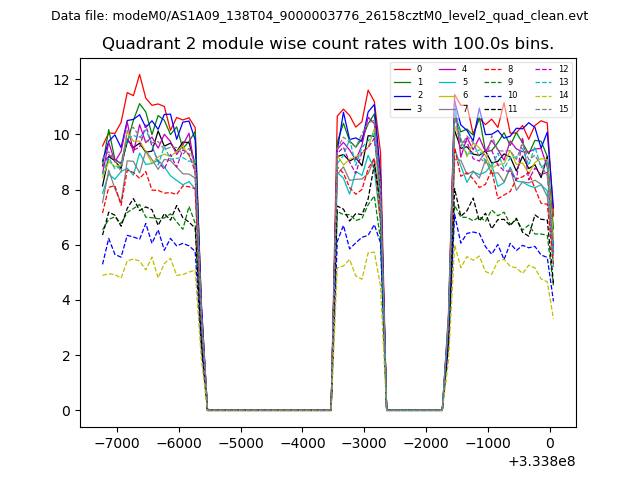
| Module-wise count rates for Quadrant B Data is divided into 100 sec bins |
 |
 |
| Module-wise count rates for Quadrant C Data is divided into 100 sec bins |
 |
 |
| Module-wise count rates for Quadrant D Data is divided into 100 sec bins |
 |
 |
| Parameter | Plot |
|---|---|
| CZT HV Monitor | 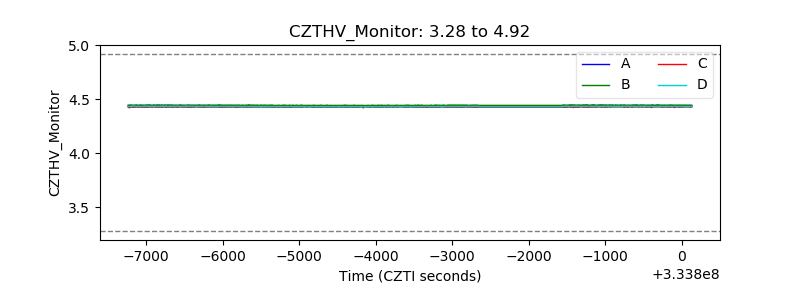 |
| D_VDD | 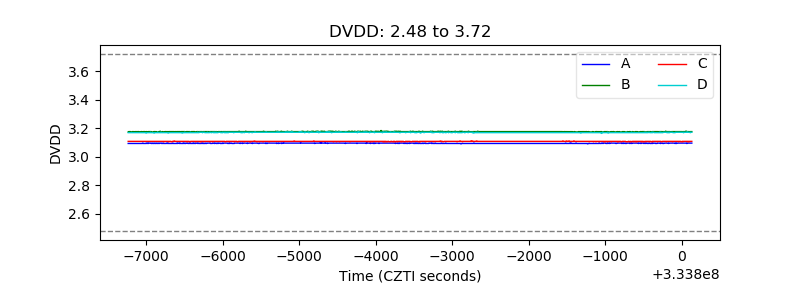 |
| Temperature 1 | 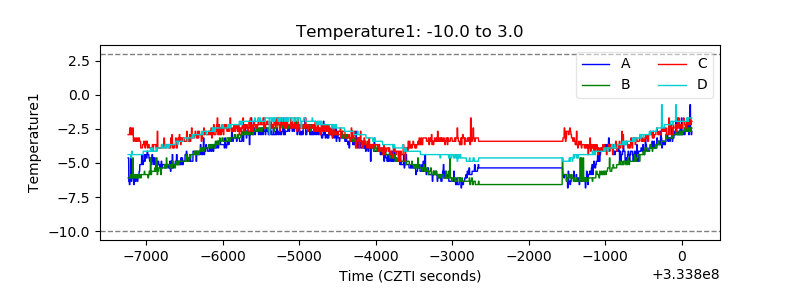 |
| Veto HV Monitor | 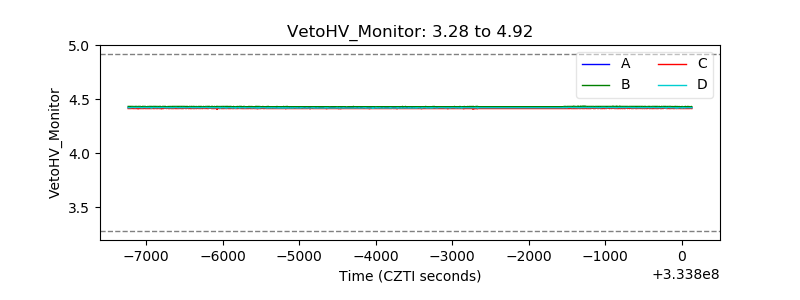 |
| Veto LLD | 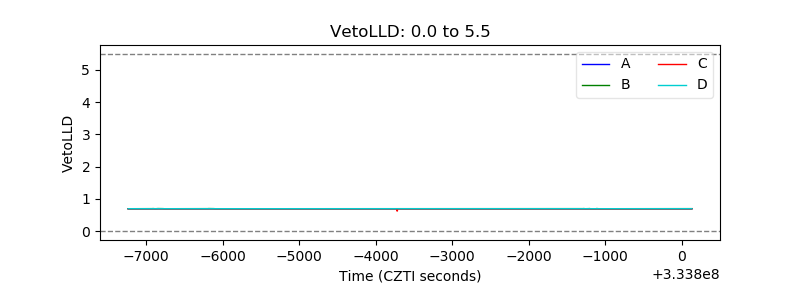 |
| Alpha Counter | 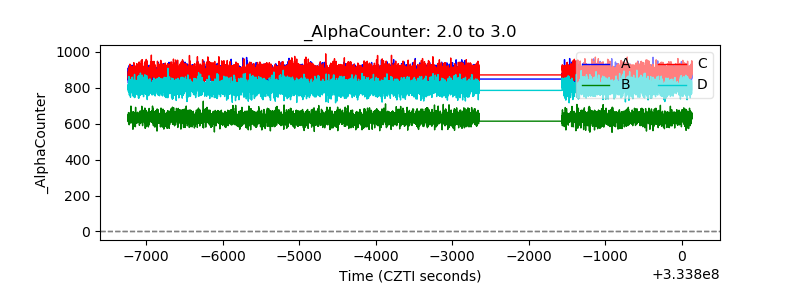 |
| _CPM_Rate | 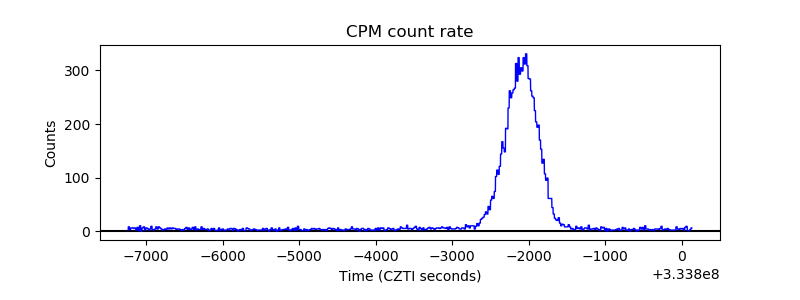 |
| CZT Counter | 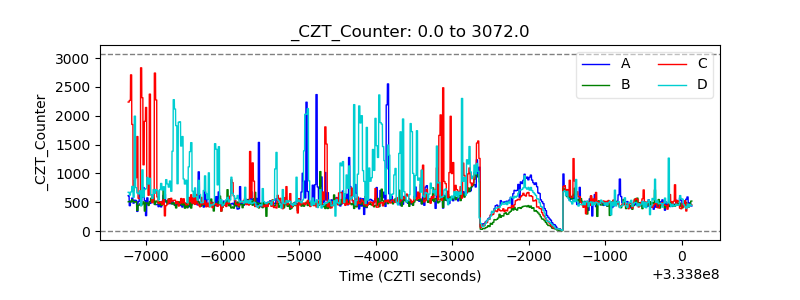 |
| +2.5 Volts monitor | 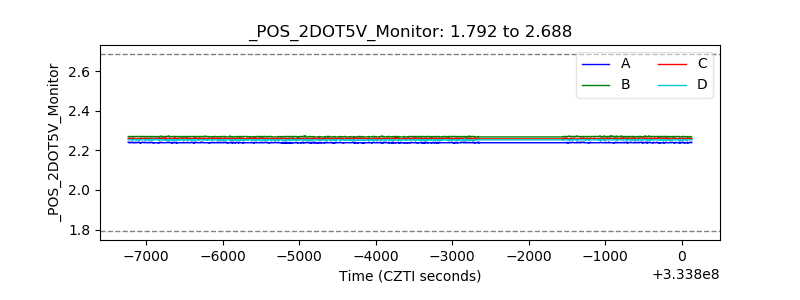 |
| +5 Volts monitor | 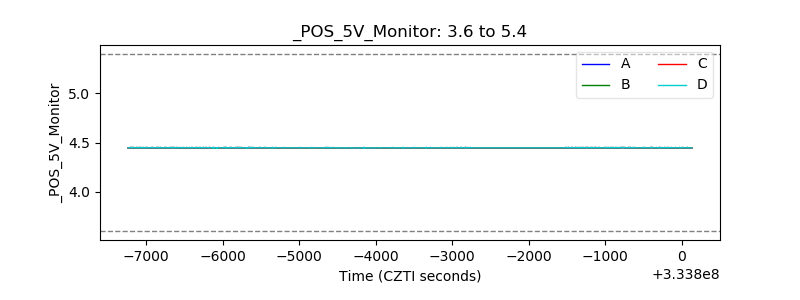 |
| _ROLL_ROT | 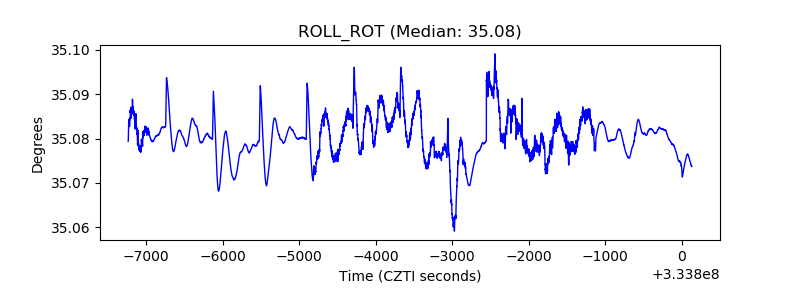 |
| _Roll_DEC |  |
| _Roll_RA | 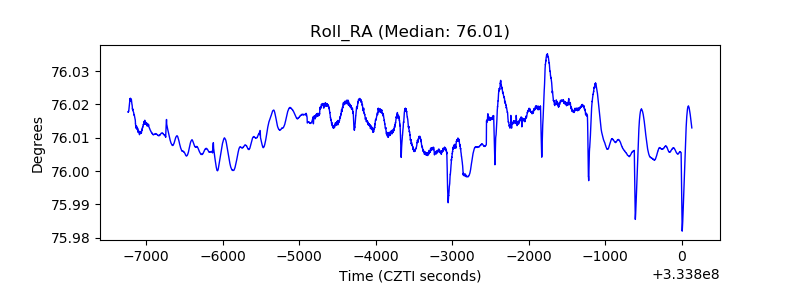 |
| Veto Counter |  |