| Param | Original file | Final file |
|---|---|---|
| Filename | modeM0/AS1A09_138T04_9000003776_26159cztM0_level2.evt | modeM0/AS1A09_138T04_9000003776_26159cztM0_level2_quad_clean.evt |
| Size (bytes) | 470,831,040 | 84,536,640 |
| Size | 449.0 MB | 80.6 MB |
| Events in quadrant A | 3,088,890 | 533,836 |
| Events in quadrant B | 3,046,323 | 548,180 |
| Events in quadrant C | 3,181,888 | 525,057 |
| Events in quadrant D | 4,517,532 | 516,691 |
| Mode M9 | |||
|---|---|---|---|
| Quadrant | BADHDUFLAG | Total packets | Discarded packets |
| A | 0 | 7 | 0 |
| B | 0 | 7 | 0 |
| C | 0 | 7 | 0 |
| D | 0 | 7 | 0 |
| Mode M0 | |||
|---|---|---|---|
| Quadrant | BADHDUFLAG | Total packets | Discarded packets |
| A | 0 | 13002 | 0 |
| B | 0 | 12837 | 0 |
| C | 0 | 13248 | 0 |
| D | 0 | 17309 | 0 |
| Quadrant | Total seconds | Saturated seconds | Saturation percentage |
|---|---|---|---|
| A | 6252 | 104 | 1.663468% |
| B | 6253 | 92 | 1.471294% |
| C | 6253 | 117 | 1.871102% |
| D | 6253 | 412 | 6.588837% |
Noise dominated data is calculated using 1-second bins in cleaned event files. If a bin has >2000 counts, and if more than 50% of those come from <1% of pixels, then it is considered to be noise-dominated and hence unusable.
| Quadrant | # 1 sec bins | Bins with >0 counts | Bins with >2000 counts | High rate bins dominated by noise | Noise dominated (total time) | Noise dominated (detector-on time) | Marked lightcurve |
|---|---|---|---|---|---|---|---|
| A | 6922 | 6252 | 2 | 2 | 0.03% | 0.03% | 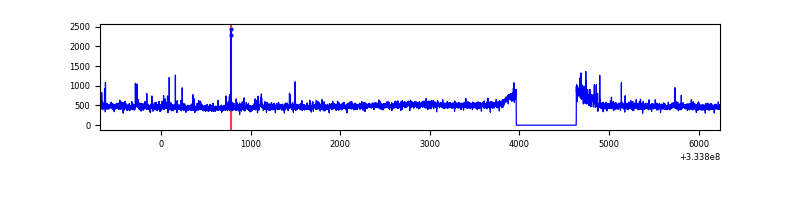 |
| B | 6923 | 6253 | 0 | 0 | 0.00% | 0.00% | 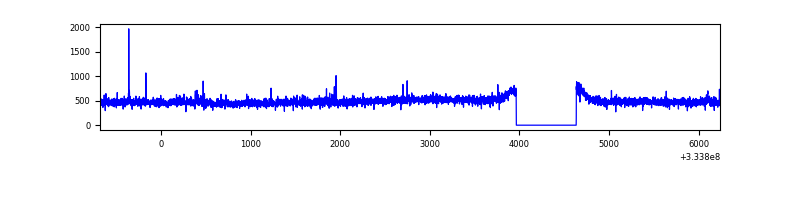 |
| C | 6923 | 6253 | 2 | 2 | 0.03% | 0.03% | 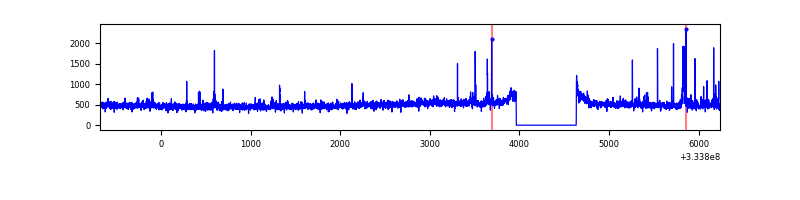 |
| D | 6923 | 6253 | 338 | 338 | 4.88% | 5.41% | 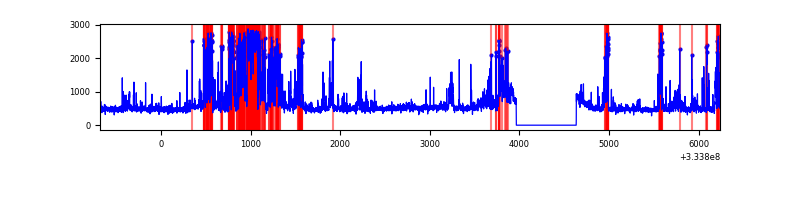 |
Top three noisy pixels from each quadrant. If the there are fewer than three noisy pixels in the level2.evt file, extra rows are filled as -1
| Pixel properties | Quadrant properties | ||||||
|---|---|---|---|---|---|---|---|
| Quadrant | DetID | PixID | Counts | Sigma | Mean | Median | Sigma |
| A | 0 | 13 | 64248 | 406.34 | 777 | 761 | 156.2 |
| A | 6 | 16 | 30980 | 193.41 | 777 | 761 | 156.2 |
| A | 13 | 254 | 9709 | 57.27 | 777 | 761 | 156.2 |
| B | 12 | 111 | 17737 | 114.94 | 766 | 746 | 147.8 |
| B | 11 | 111 | 16396 | 105.86 | 766 | 746 | 147.8 |
| B | 14 | 111 | 14489 | 92.96 | 766 | 746 | 147.8 |
| C | 3 | 233 | 119480 | 682.26 | 745 | 751 | 174.0 |
| C | 14 | 238 | 119258 | 680.99 | 745 | 751 | 174.0 |
| C | 2 | 16 | 38749 | 218.35 | 745 | 751 | 174.0 |
| D | 12 | 233 | 1100101 | 6132.71 | 746 | 729 | 179.3 |
| D | 1 | 52 | 553673 | 3084.53 | 746 | 729 | 179.3 |
| D | 2 | 234 | 25456 | 137.94 | 746 | 729 | 179.3 |
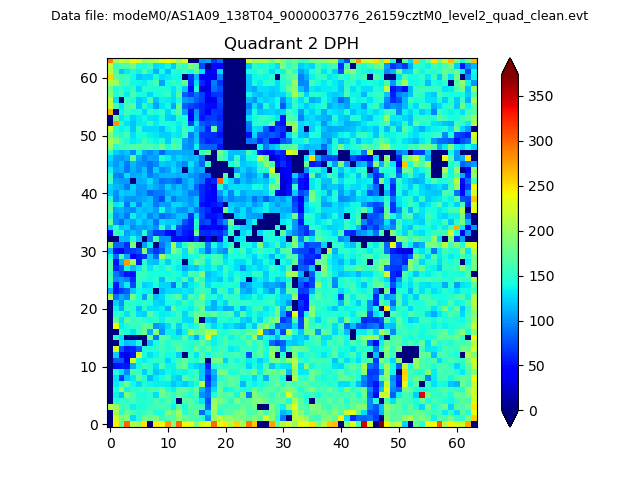
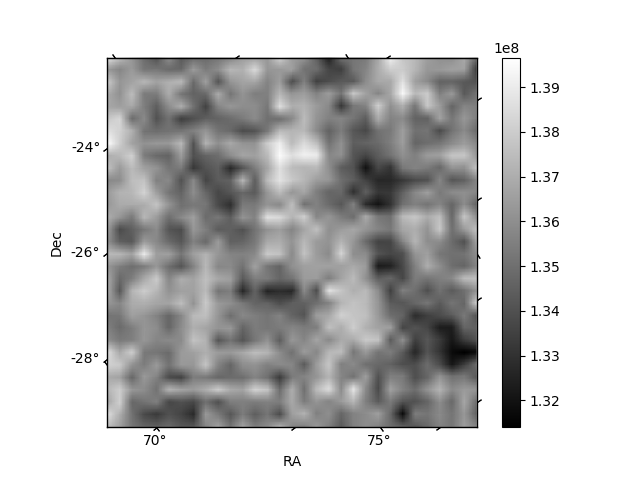
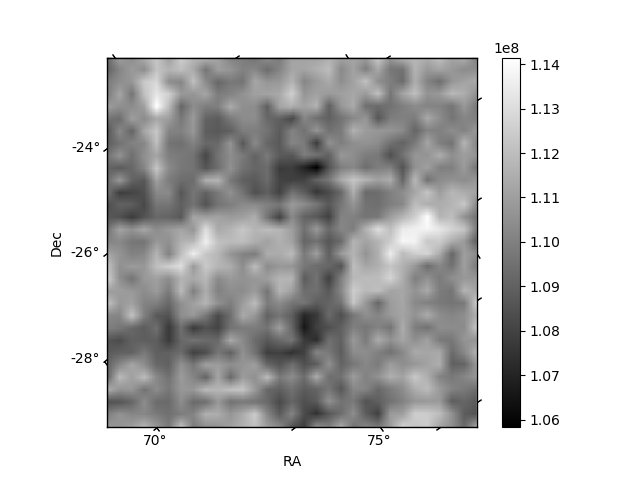
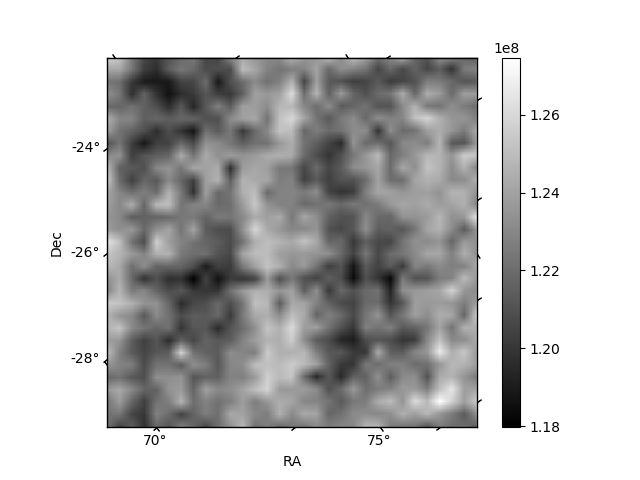
Histogram calculated using DETX and DETY for each event in the final _common_clean file
| Quadrant A | 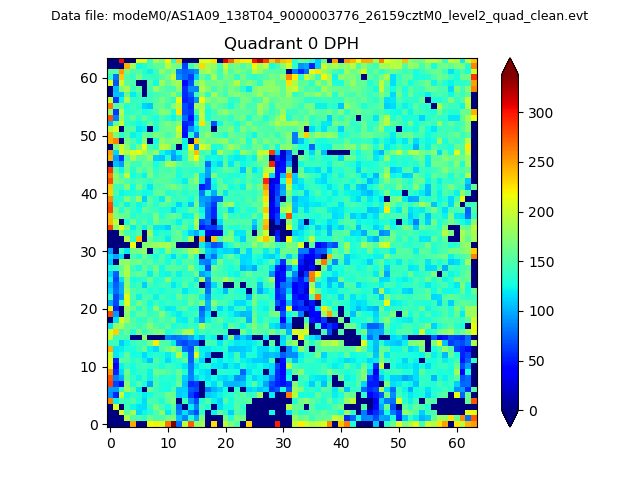 |
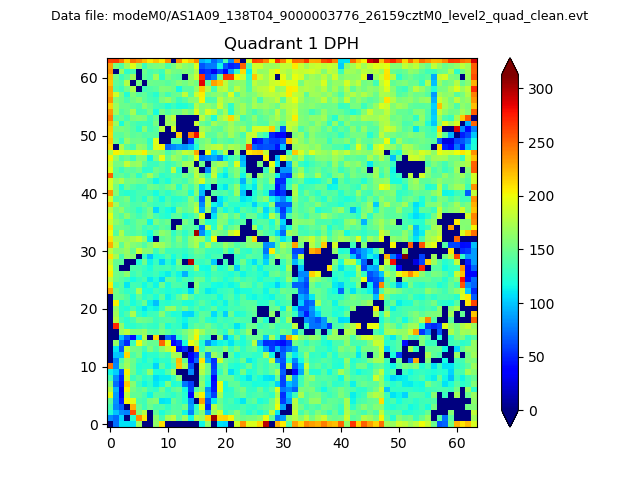 |
Quadrant B |
|---|---|---|---|
| Quadrant D | 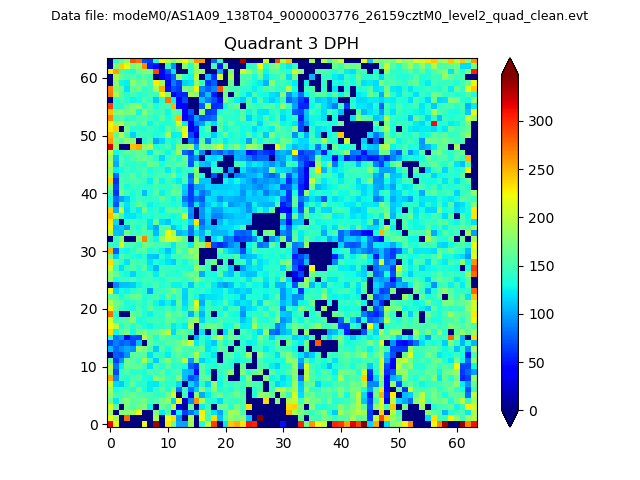 |
 |
Quadrant C |
| Plot type | Count rate plots | Images |
|---|---|---|
| Comparison with Poisson distribution Blue bars denote a histogram of data divided into 1 sec bins. Red curve is a Poisson curve with rate = median count rate of data. |
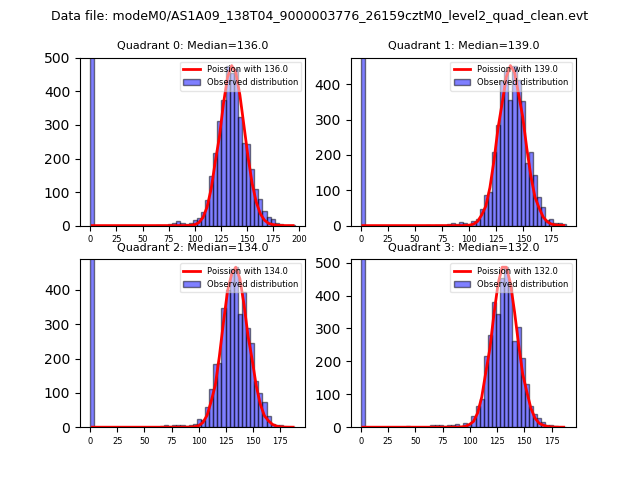 |
 |
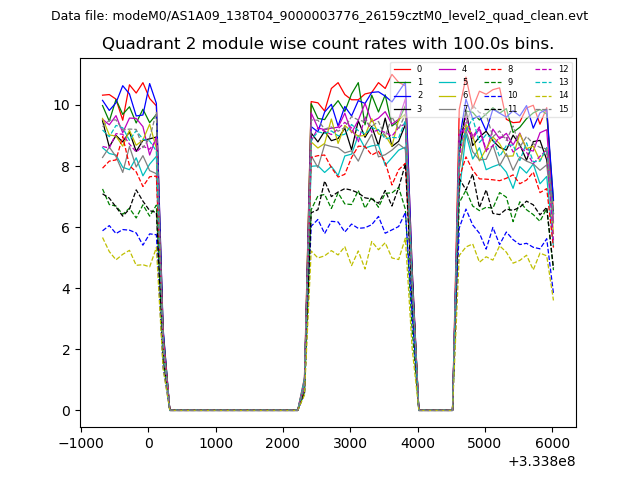
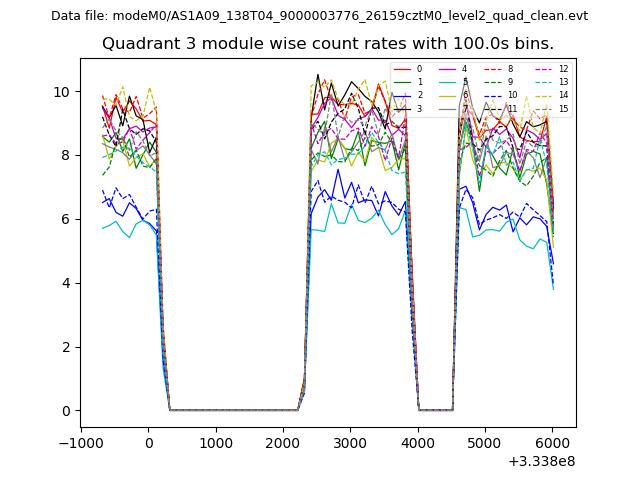
| Quadrant-wise count rates Data is divided into 100 sec bins |
 |
|
| Module-wise count rates for Quadrant A Data is divided into 100 sec bins |
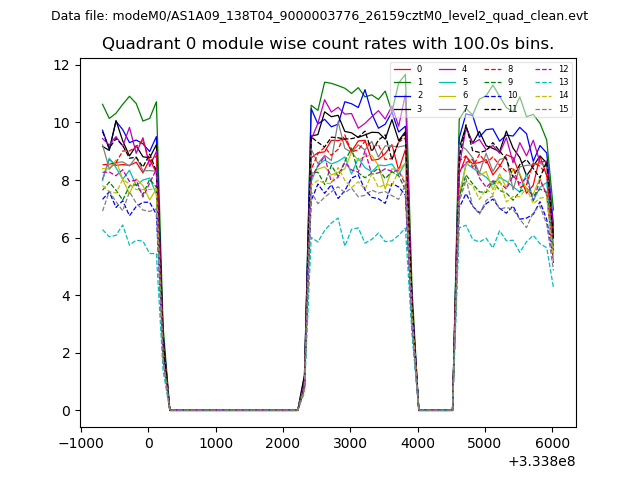 |
 |
| Module-wise count rates for Quadrant B Data is divided into 100 sec bins |
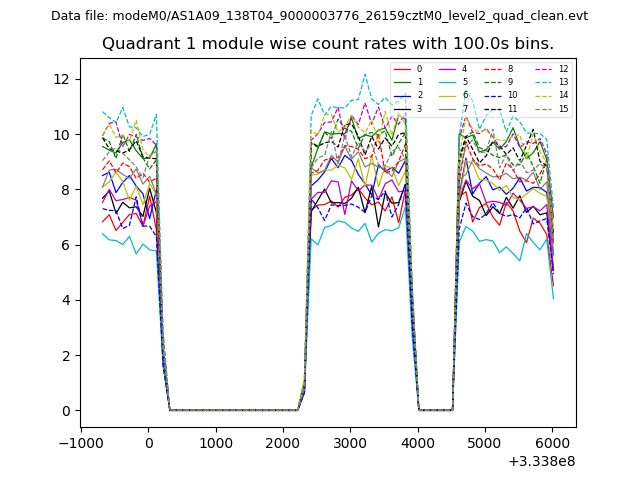 |
 |
| Module-wise count rates for Quadrant C Data is divided into 100 sec bins |
 |
 |
| Module-wise count rates for Quadrant D Data is divided into 100 sec bins |
 |
 |
| Parameter | Plot |
|---|---|
| CZT HV Monitor | 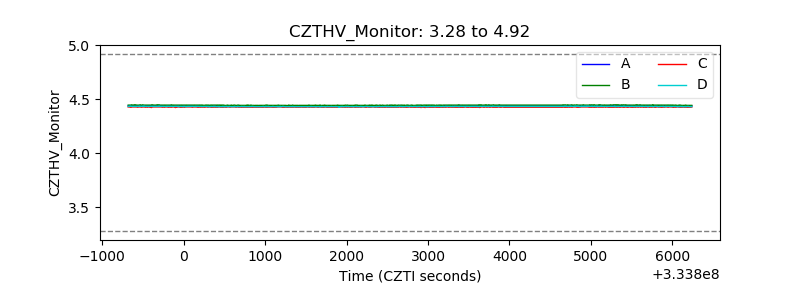 |
| D_VDD | 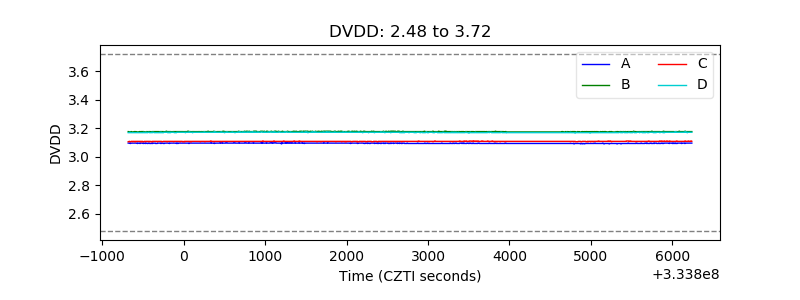 |
| Temperature 1 | 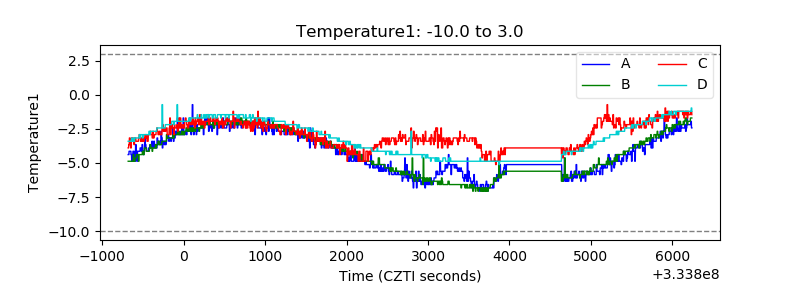 |
| Veto HV Monitor | 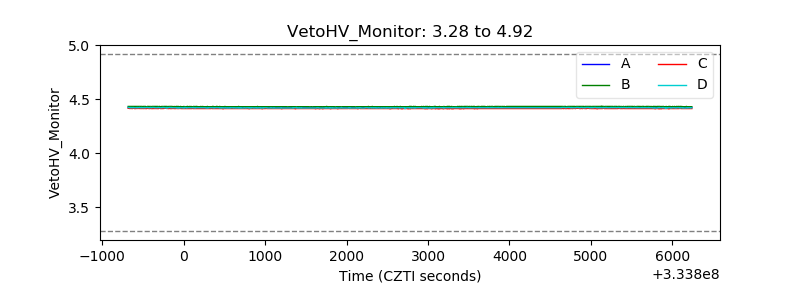 |
| Veto LLD | 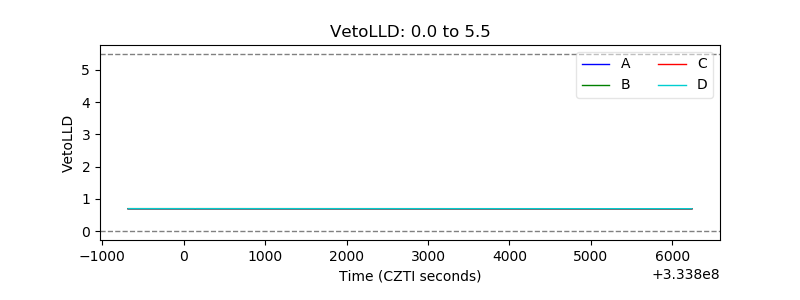 |
| Alpha Counter | 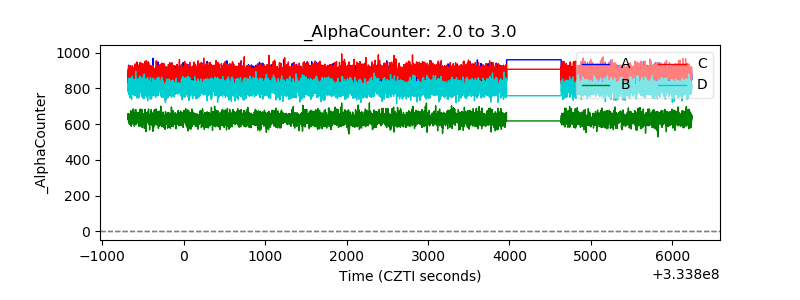 |
| _CPM_Rate | 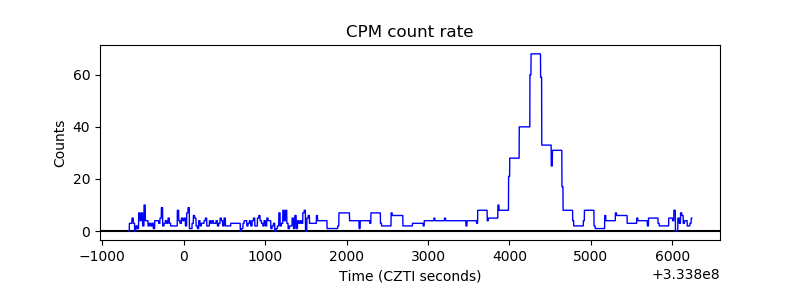 |
| CZT Counter | 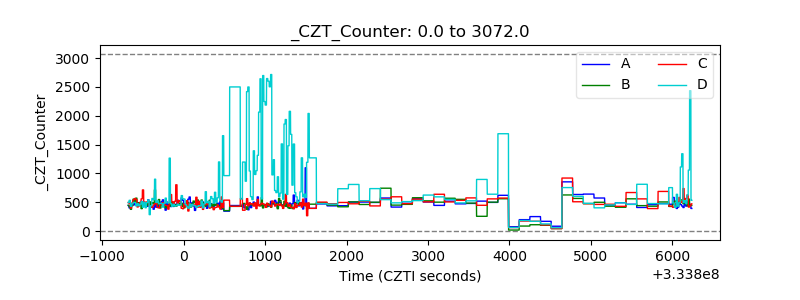 |
| +2.5 Volts monitor |  |
| +5 Volts monitor |  |
| _ROLL_ROT | 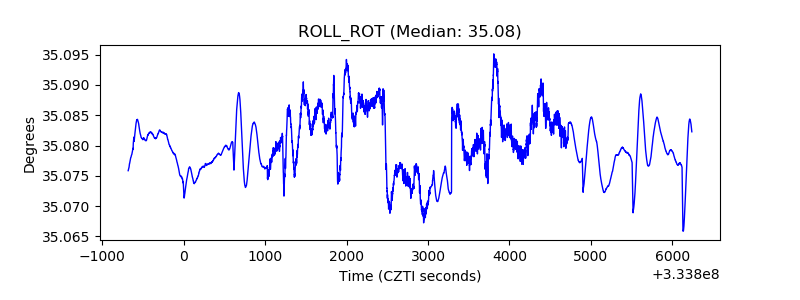 |
| _Roll_DEC | 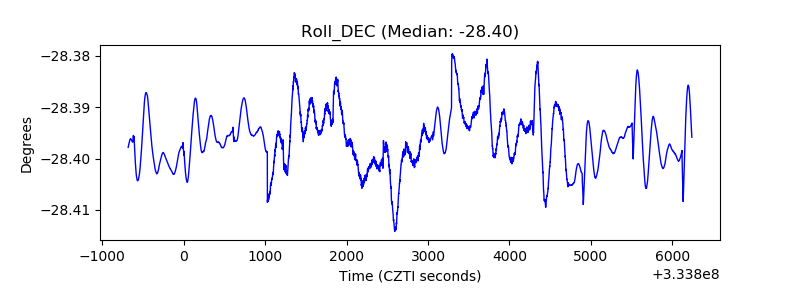 |
| _Roll_RA | 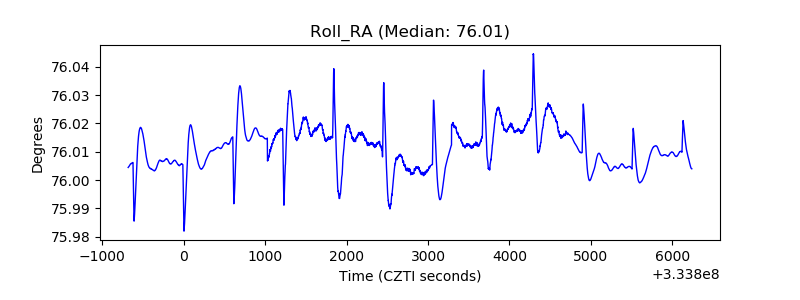 |
| Veto Counter | 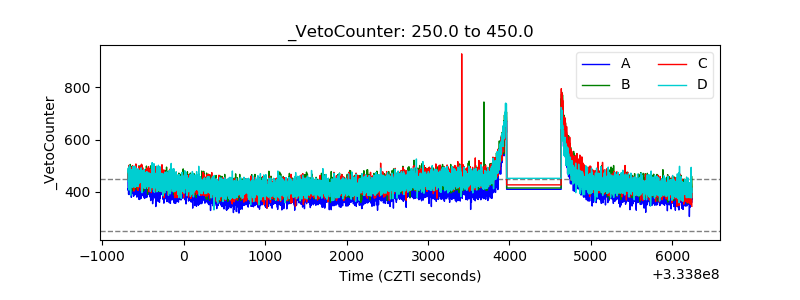 |