| Param | Original file | Final file |
|---|---|---|
| Filename | modeM0/AS1A09_138T04_9000003776_26160cztM0_level2.evt | modeM0/AS1A09_138T04_9000003776_26160cztM0_level2_quad_clean.evt |
| Size (bytes) | 533,623,680 | 92,756,160 |
| Size | 508.9 MB | 88.5 MB |
| Events in quadrant A | 3,677,619 | 581,161 |
| Events in quadrant B | 3,520,084 | 595,634 |
| Events in quadrant C | 4,198,171 | 563,284 |
| Events in quadrant D | 4,274,322 | 565,465 |
| Mode M9 | |||
|---|---|---|---|
| Quadrant | BADHDUFLAG | Total packets | Discarded packets |
| A | 0 | 3 | 0 |
| B | 0 | 3 | 0 |
| C | 0 | 3 | 0 |
| D | 0 | 3 | 0 |
| Mode M0 | |||
|---|---|---|---|
| Quadrant | BADHDUFLAG | Total packets | Discarded packets |
| A | 0 | 15426 | 0 |
| B | 0 | 14944 | 0 |
| C | 0 | 16946 | 0 |
| D | 0 | 17274 | 0 |
| Quadrant | Total seconds | Saturated seconds | Saturation percentage |
|---|---|---|---|
| A | 7225 | 226 | 3.128028% |
| B | 7226 | 212 | 2.933850% |
| C | 7226 | 362 | 5.009687% |
| D | 7226 | 312 | 4.317741% |
Noise dominated data is calculated using 1-second bins in cleaned event files. If a bin has >2000 counts, and if more than 50% of those come from <1% of pixels, then it is considered to be noise-dominated and hence unusable.
| Quadrant | # 1 sec bins | Bins with >0 counts | Bins with >2000 counts | High rate bins dominated by noise | Noise dominated (total time) | Noise dominated (detector-on time) | Marked lightcurve |
|---|---|---|---|---|---|---|---|
| A | 7445 | 7225 | 22 | 22 | 0.30% | 0.30% | 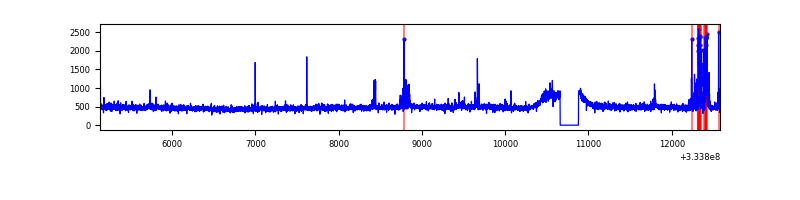 |
| B | 7446 | 7226 | 1 | 1 | 0.01% | 0.01% | 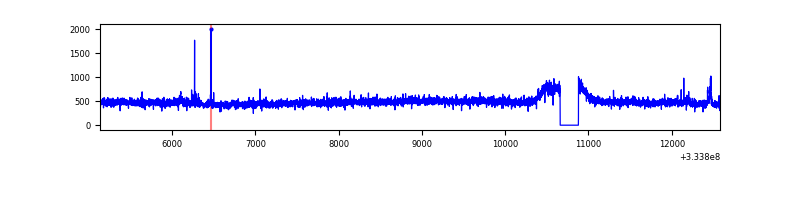 |
| C | 7446 | 7226 | 104 | 104 | 1.40% | 1.44% | 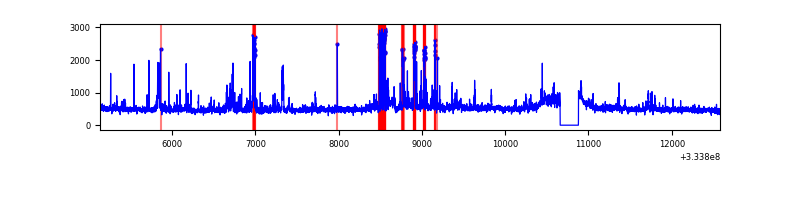 |
| D | 7446 | 7226 | 167 | 167 | 2.24% | 2.31% | 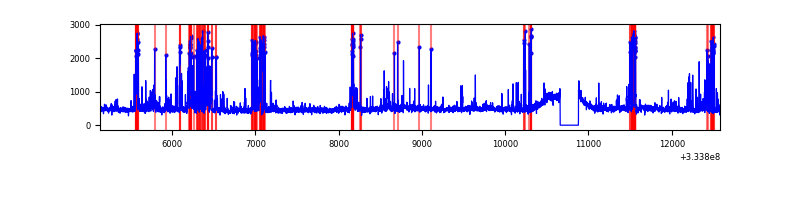 |
Top three noisy pixels from each quadrant. If the there are fewer than three noisy pixels in the level2.evt file, extra rows are filled as -1
| Pixel properties | Quadrant properties | ||||||
|---|---|---|---|---|---|---|---|
| Quadrant | DetID | PixID | Counts | Sigma | Mean | Median | Sigma |
| A | 0 | 13 | 187942 | 1037.28 | 893 | 871 | 180.3 |
| A | 6 | 16 | 46452 | 252.74 | 893 | 871 | 180.3 |
| A | 13 | 254 | 11165 | 57.08 | 893 | 871 | 180.3 |
| B | 0 | 190 | 28236 | 158.86 | 884 | 860 | 172.3 |
| B | 12 | 111 | 21170 | 117.85 | 884 | 860 | 172.3 |
| B | 11 | 111 | 19038 | 105.48 | 884 | 860 | 172.3 |
| C | 3 | 233 | 497163 | 2470.72 | 852 | 856 | 200.9 |
| C | 2 | 16 | 246194 | 1221.34 | 852 | 856 | 200.9 |
| C | 14 | 238 | 134944 | 667.52 | 852 | 856 | 200.9 |
| D | 12 | 233 | 558814 | 2655.07 | 874 | 850 | 210.2 |
| D | 1 | 52 | 363587 | 1726.08 | 874 | 850 | 210.2 |
| D | 2 | 234 | 30837 | 142.69 | 874 | 850 | 210.2 |
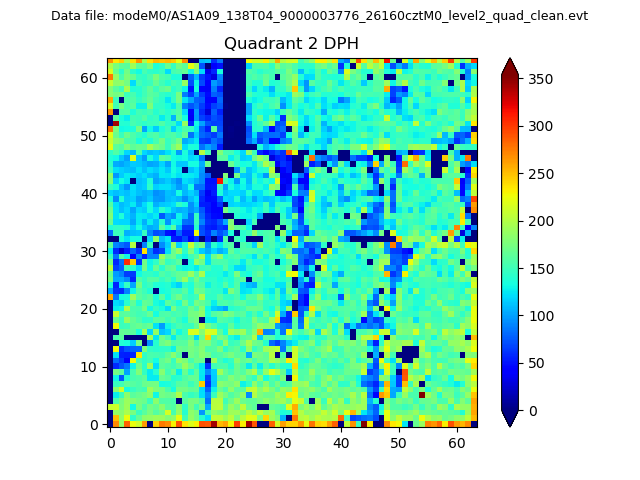
Histogram calculated using DETX and DETY for each event in the final _common_clean file
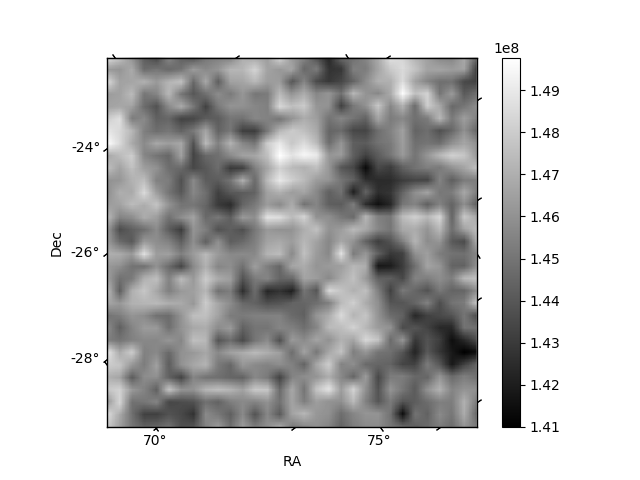
| Quadrant A | 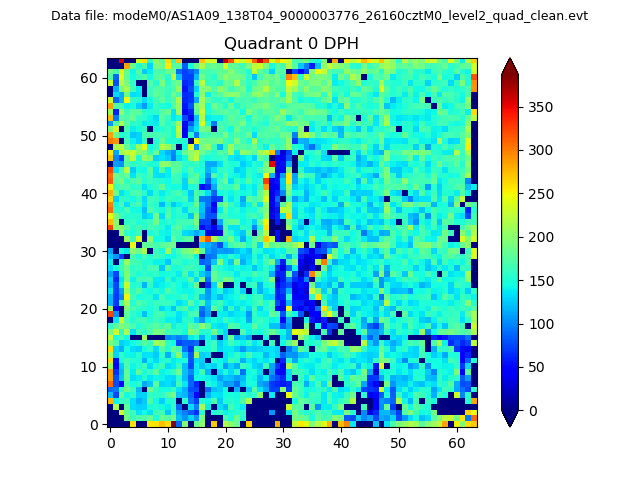 |
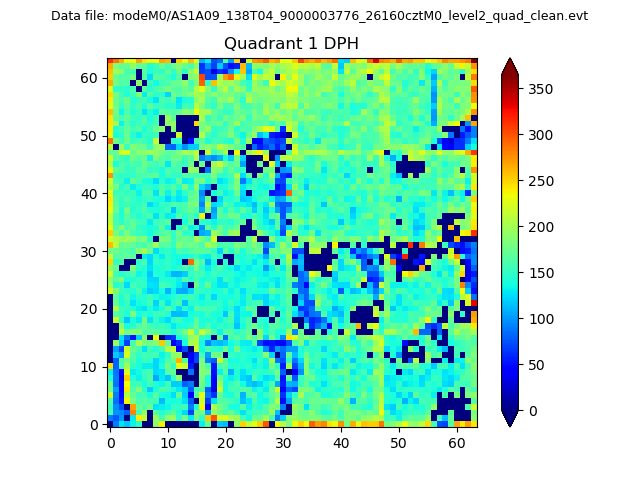 |
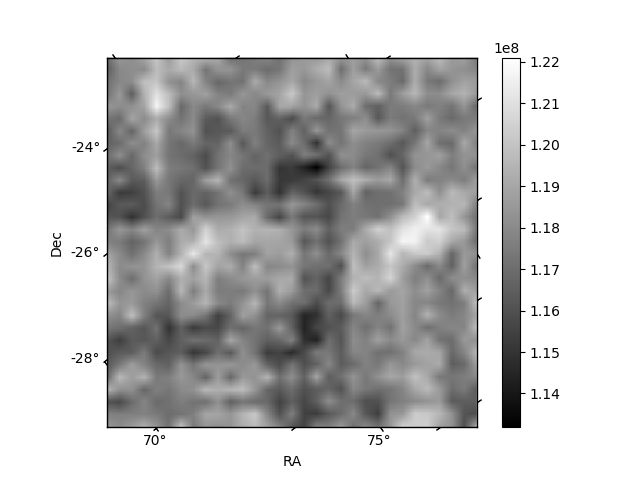
Quadrant B |
|---|---|---|---|
| Quadrant D | 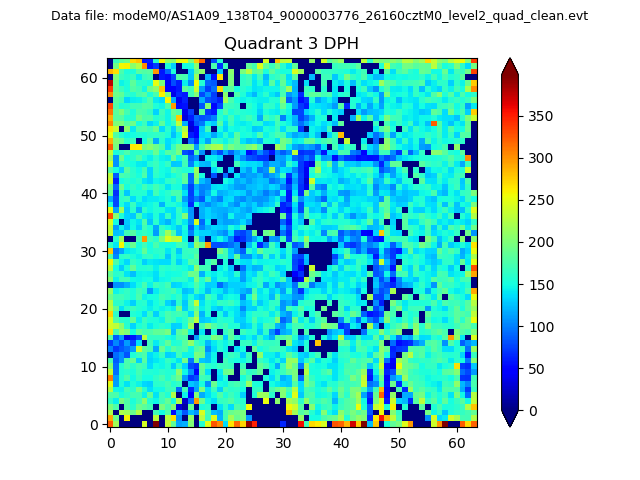 |
 |
Quadrant C |
| Plot type | Count rate plots | Images |
|---|---|---|
| Comparison with Poisson distribution Blue bars denote a histogram of data divided into 1 sec bins. Red curve is a Poisson curve with rate = median count rate of data. |
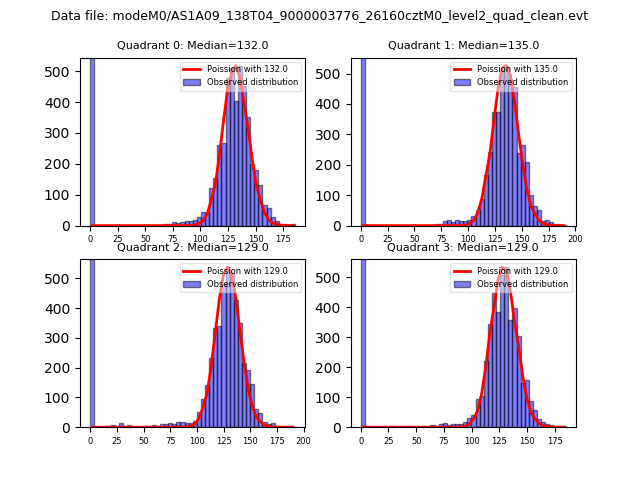 |
 |
| Quadrant-wise count rates Data is divided into 100 sec bins |
 |
|
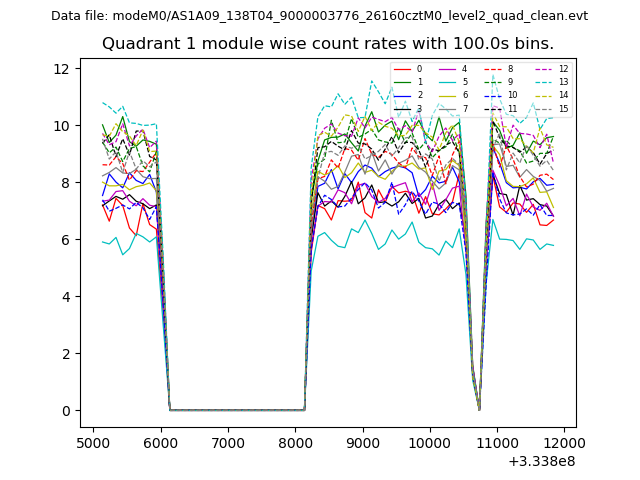
| Module-wise count rates for Quadrant A Data is divided into 100 sec bins |
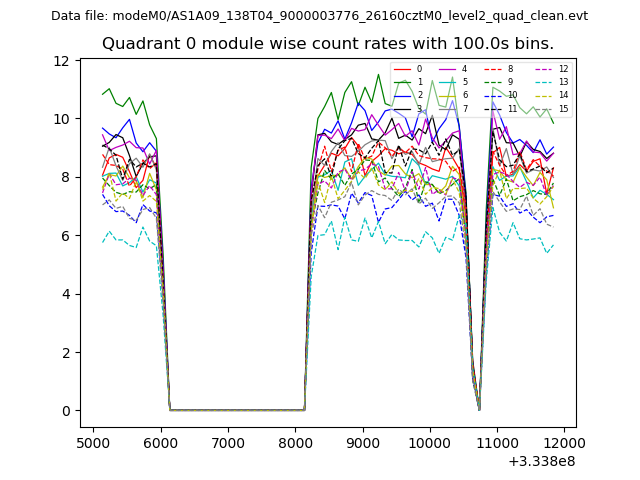 |
 |
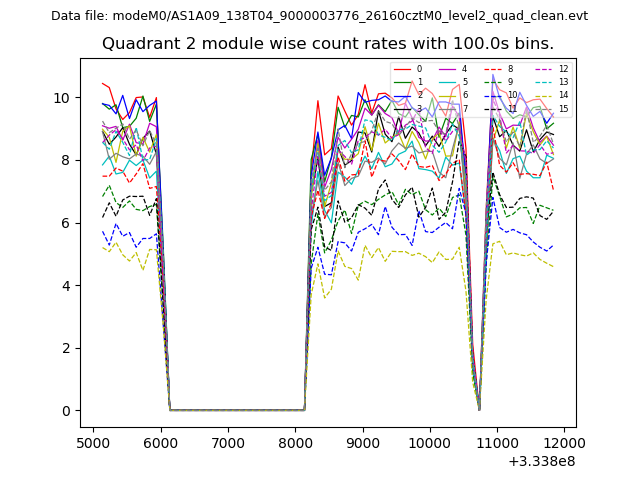
| Module-wise count rates for Quadrant B Data is divided into 100 sec bins |
 |
 |
| Module-wise count rates for Quadrant C Data is divided into 100 sec bins |
 |
 |
| Module-wise count rates for Quadrant D Data is divided into 100 sec bins |
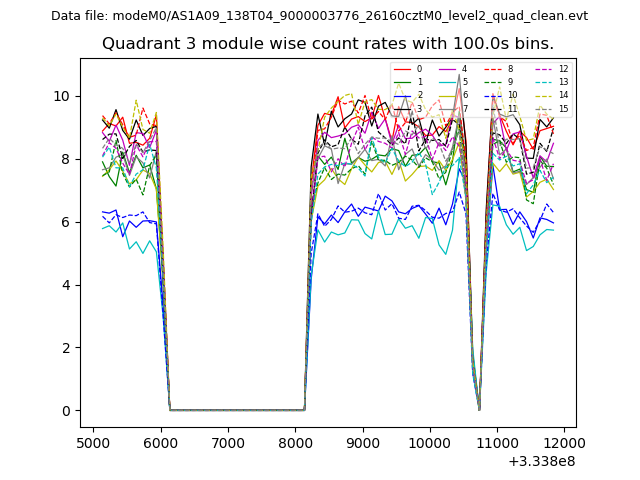 |
 |
| Parameter | Plot |
|---|---|
| CZT HV Monitor | 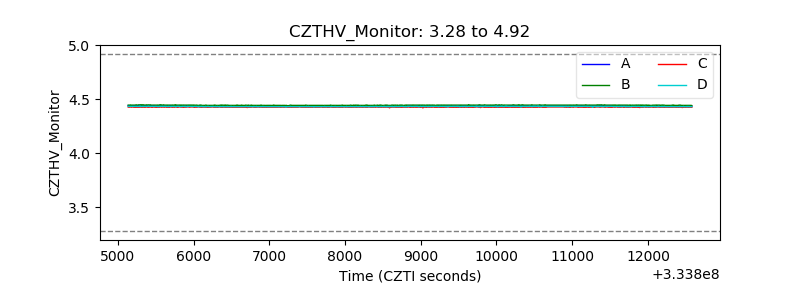 |
| D_VDD | 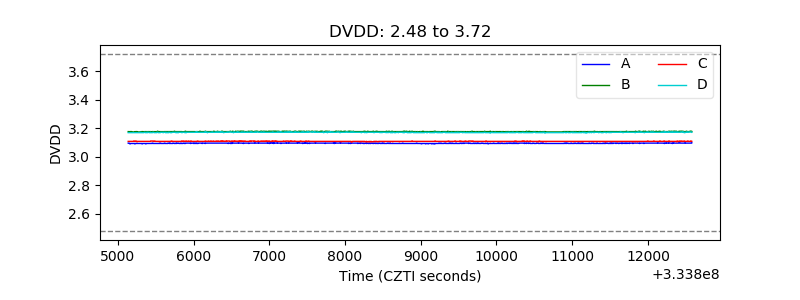 |
| Temperature 1 | 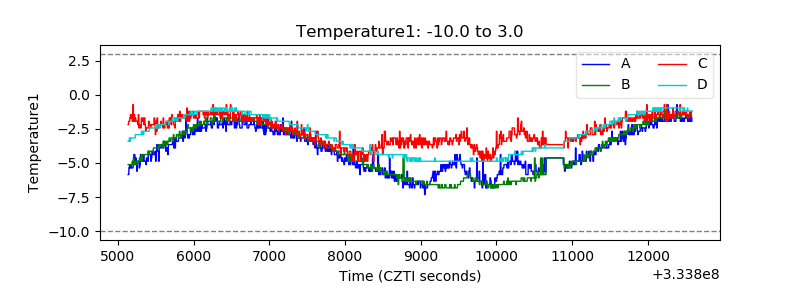 |
| Veto HV Monitor | 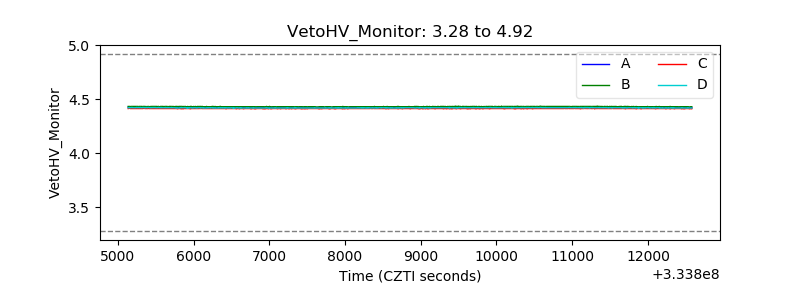 |
| Veto LLD | 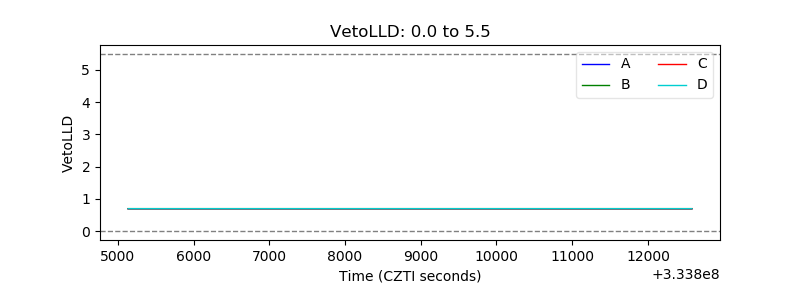 |
| Alpha Counter | 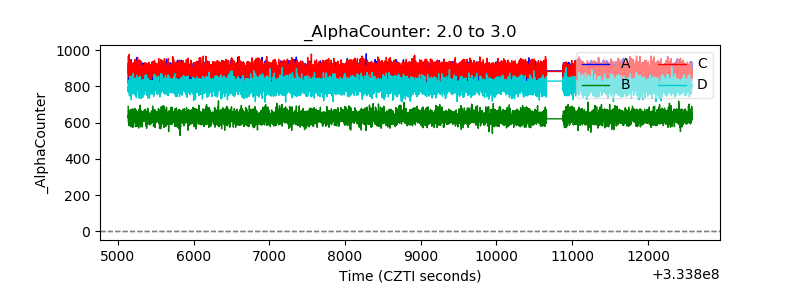 |
| _CPM_Rate | 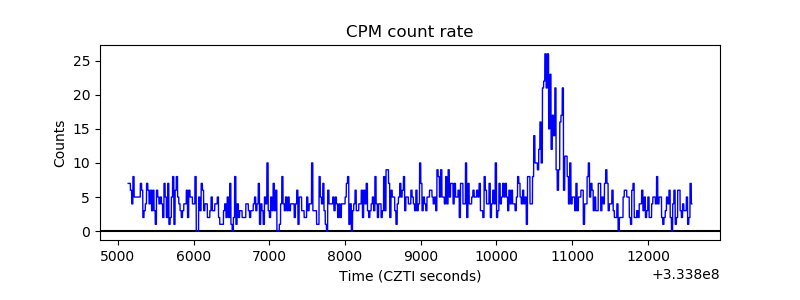 |
| CZT Counter | 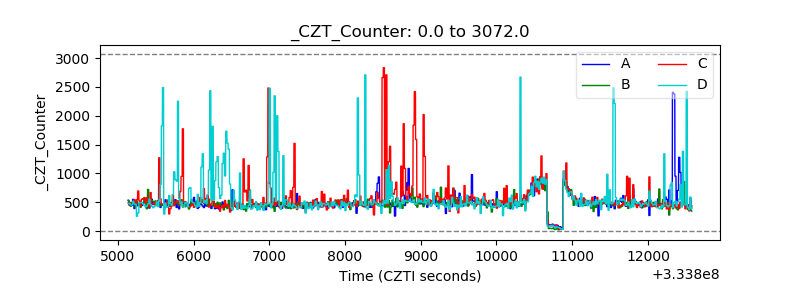 |
| +2.5 Volts monitor | 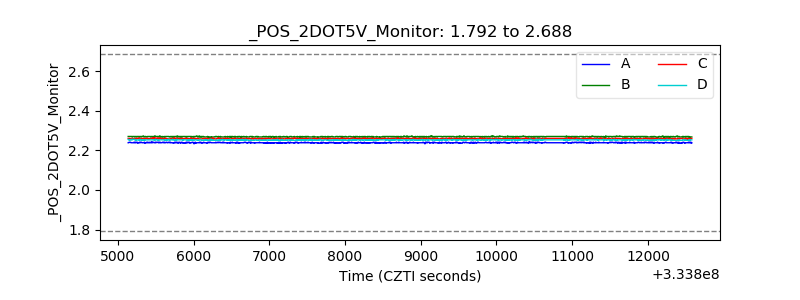 |
| +5 Volts monitor |  |
| _ROLL_ROT | 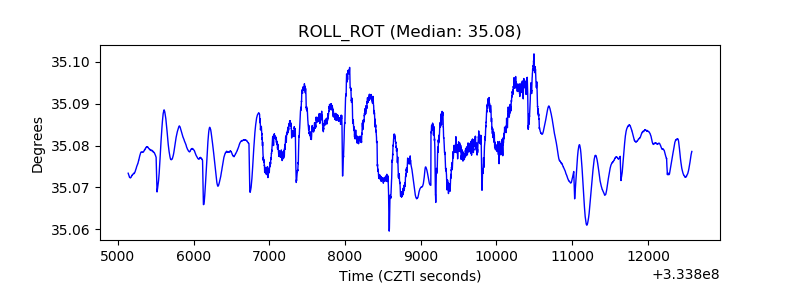 |
| _Roll_DEC | 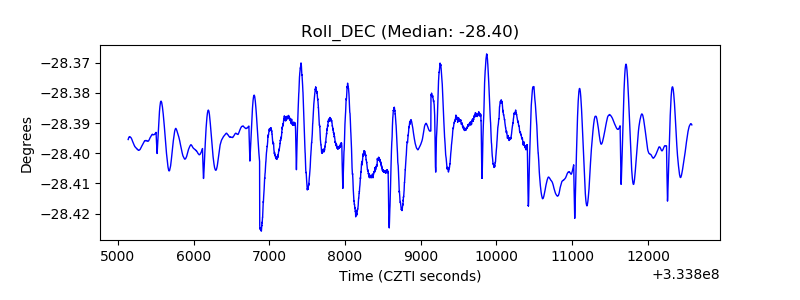 |
| _Roll_RA | 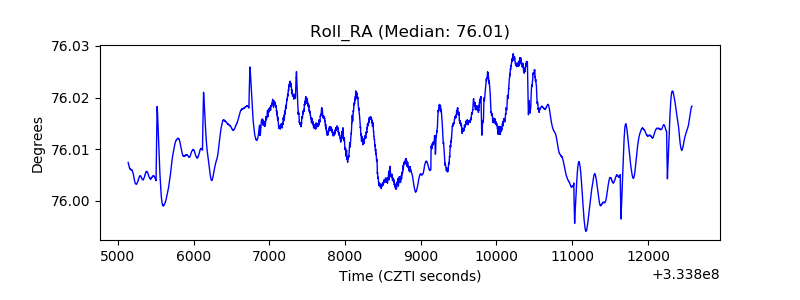 |
| Veto Counter | 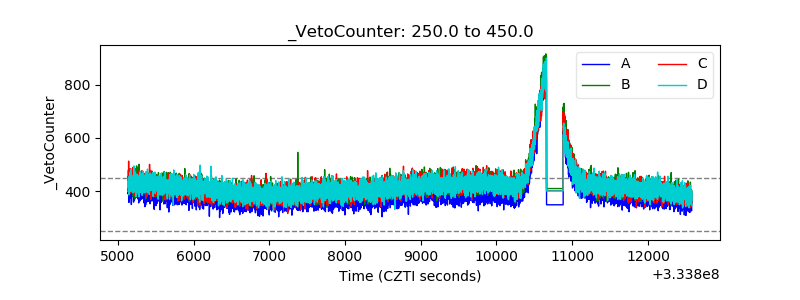 |