| Param | Original file | Final file |
|---|---|---|
| Filename | modeM0/AS1A09_138T04_9000003776_26161cztM0_level2.evt | modeM0/AS1A09_138T04_9000003776_26161cztM0_level2_quad_clean.evt |
| Size (bytes) | 525,450,240 | 83,056,320 |
| Size | 501.1 MB | 79.2 MB |
| Events in quadrant A | 3,958,864 | 512,500 |
| Events in quadrant B | 3,412,685 | 521,412 |
| Events in quadrant C | 4,242,977 | 494,121 |
| Events in quadrant D | 3,823,151 | 498,663 |
| Mode M9 | |||
|---|---|---|---|
| Quadrant | BADHDUFLAG | Total packets | Discarded packets |
| A | 0 | 2 | 0 |
| B | 0 | 2 | 0 |
| C | 0 | 2 | 0 |
| D | 0 | 2 | 0 |
| Mode M0 | |||
|---|---|---|---|
| Quadrant | BADHDUFLAG | Total packets | Discarded packets |
| A | 0 | 16176 | 0 |
| B | 0 | 14549 | 0 |
| C | 0 | 17085 | 0 |
| D | 0 | 15771 | 0 |
| Quadrant | Total seconds | Saturated seconds | Saturation percentage |
|---|---|---|---|
| A | 7006 | 263 | 3.753925% |
| B | 7007 | 198 | 2.825746% |
| C | 7007 | 341 | 4.866562% |
| D | 7007 | 166 | 2.369060% |
Noise dominated data is calculated using 1-second bins in cleaned event files. If a bin has >2000 counts, and if more than 50% of those come from <1% of pixels, then it is considered to be noise-dominated and hence unusable.
| Quadrant | # 1 sec bins | Bins with >0 counts | Bins with >2000 counts | High rate bins dominated by noise | Noise dominated (total time) | Noise dominated (detector-on time) | Marked lightcurve |
|---|---|---|---|---|---|---|---|
| A | 7191 | 7006 | 62 | 62 | 0.86% | 0.88% | 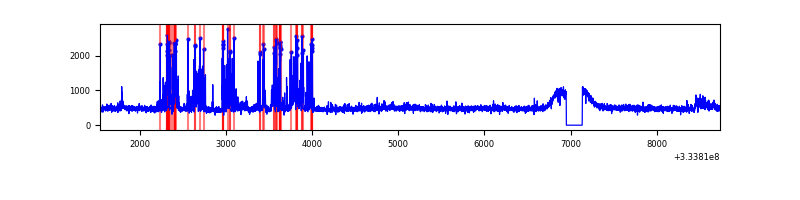 |
| B | 7192 | 7007 | 4 | 4 | 0.06% | 0.06% | 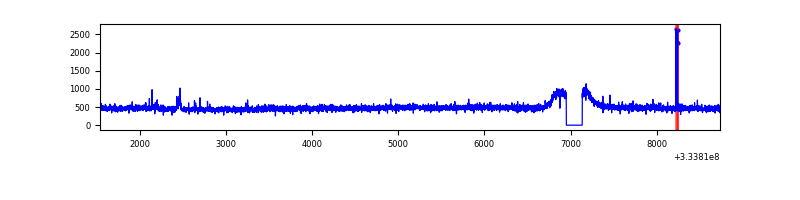 |
| C | 7192 | 7007 | 112 | 112 | 1.56% | 1.60% | 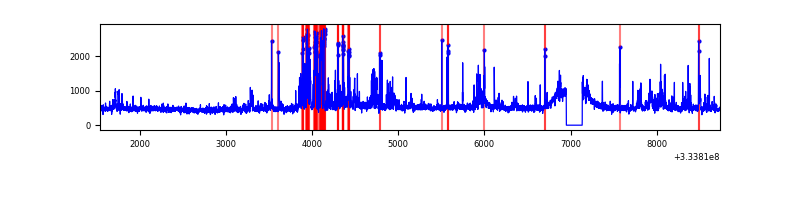 |
| D | 7192 | 7007 | 44 | 44 | 0.61% | 0.63% | 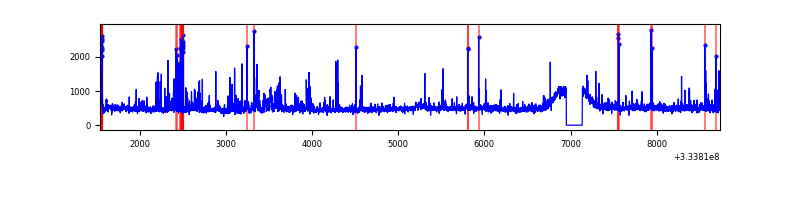 |
Top three noisy pixels from each quadrant. If the there are fewer than three noisy pixels in the level2.evt file, extra rows are filled as -1
| Pixel properties | Quadrant properties | ||||||
|---|---|---|---|---|---|---|---|
| Quadrant | DetID | PixID | Counts | Sigma | Mean | Median | Sigma |
| A | 0 | 13 | 600116 | 3372.93 | 867 | 848 | 177.7 |
| A | 6 | 16 | 15954 | 85.02 | 867 | 848 | 177.7 |
| A | 13 | 254 | 10786 | 55.94 | 867 | 848 | 177.7 |
| B | 0 | 190 | 21568 | 123.94 | 859 | 834 | 167.3 |
| B | 12 | 111 | 20825 | 119.5 | 859 | 834 | 167.3 |
| B | 11 | 111 | 18329 | 104.58 | 859 | 834 | 167.3 |
| C | 3 | 233 | 890007 | 4549.81 | 823 | 828 | 195.4 |
| C | 14 | 238 | 130805 | 665.07 | 823 | 828 | 195.4 |
| C | 2 | 16 | 17484 | 85.23 | 823 | 828 | 195.4 |
| D | 1 | 52 | 517112 | 2524.9 | 850 | 829 | 204.5 |
| D | 12 | 233 | 66501 | 321.17 | 850 | 829 | 204.5 |
| D | 2 | 234 | 31596 | 150.47 | 850 | 829 | 204.5 |
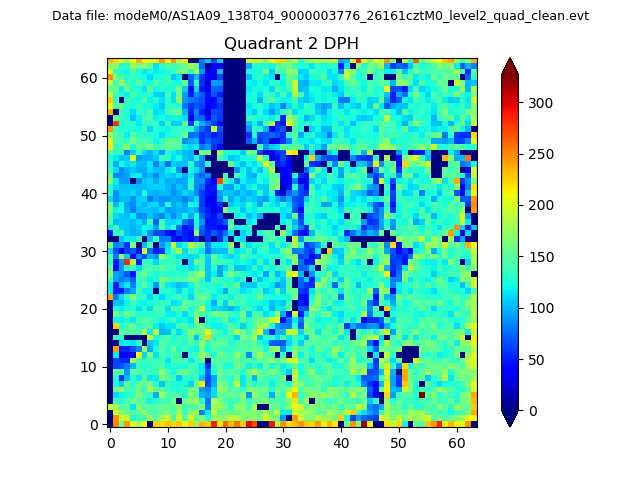
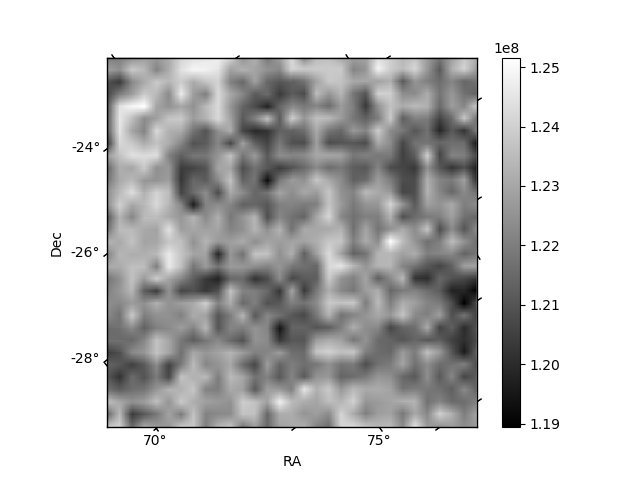
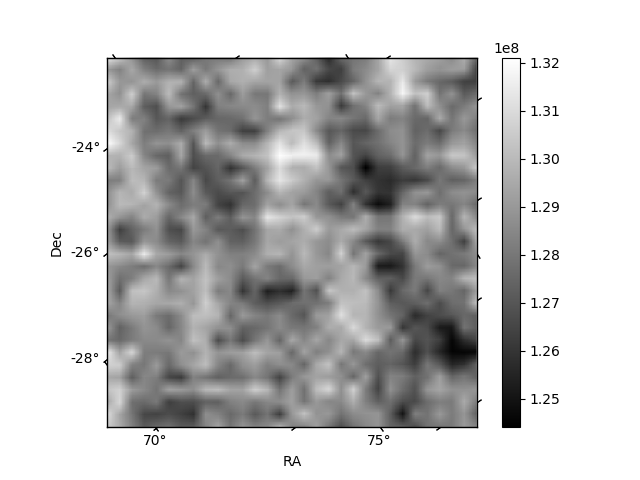
Histogram calculated using DETX and DETY for each event in the final _common_clean file
| Quadrant A | 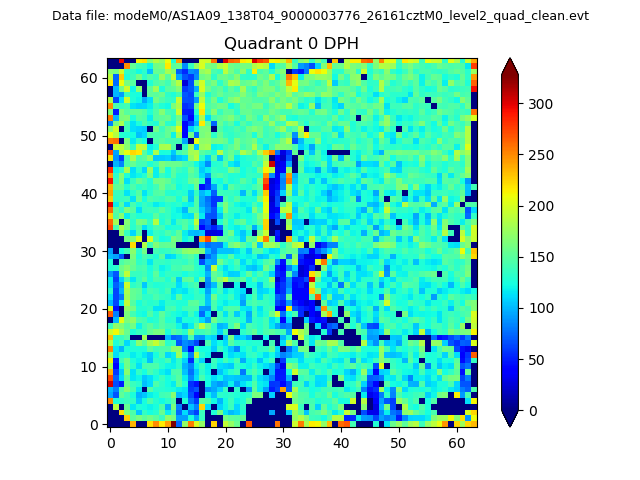 |
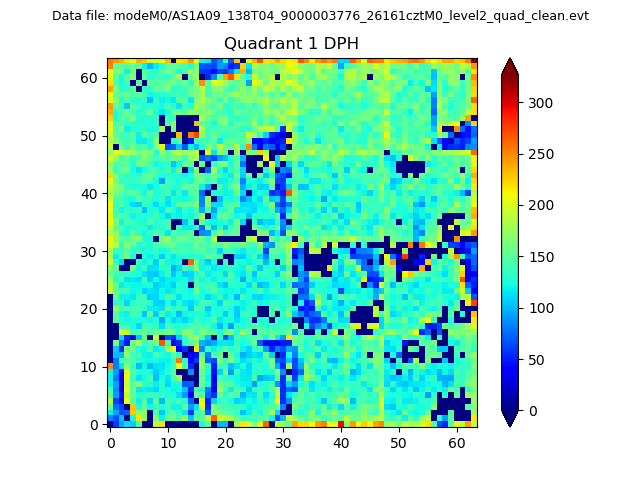 |
Quadrant B |
|---|---|---|---|
| Quadrant D | 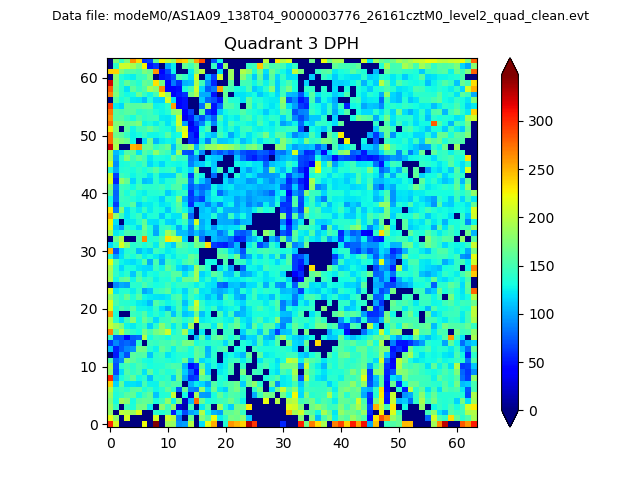 |
 |
Quadrant C |
| Plot type | Count rate plots | Images |
|---|---|---|
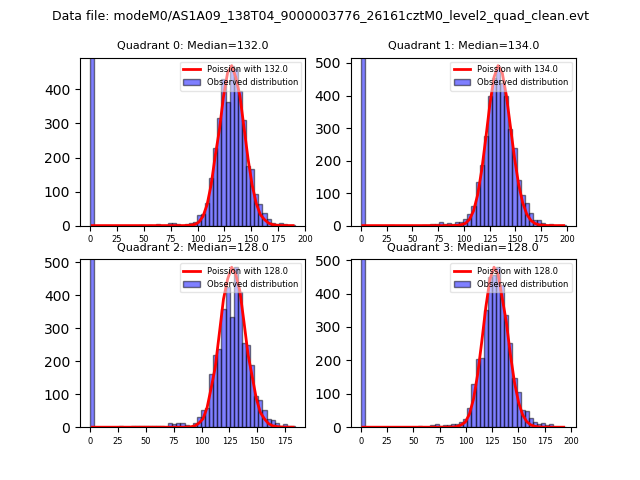
| Comparison with Poisson distribution Blue bars denote a histogram of data divided into 1 sec bins. Red curve is a Poisson curve with rate = median count rate of data. |
 |
 |
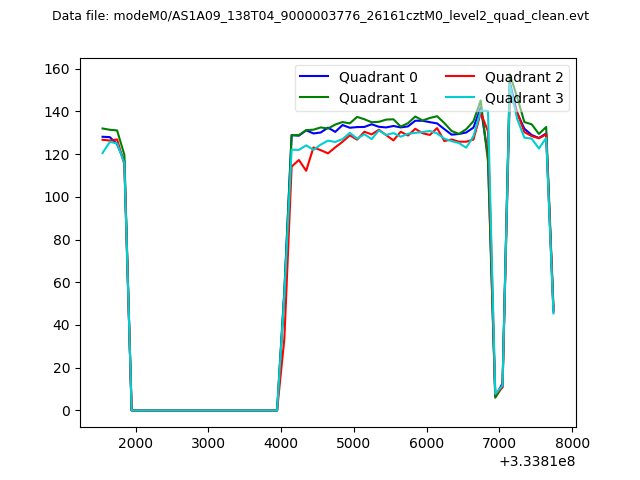
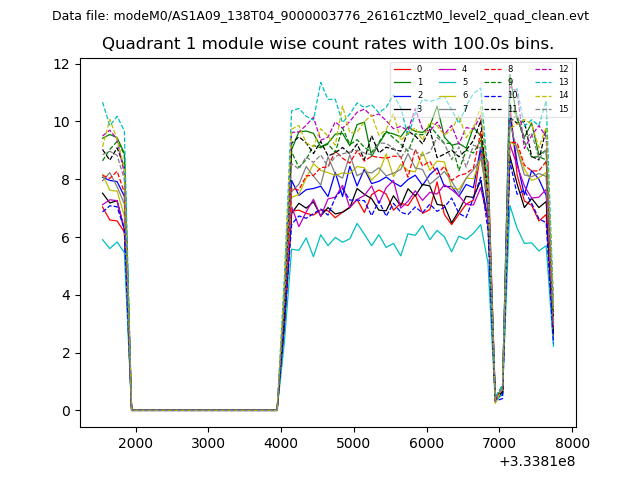
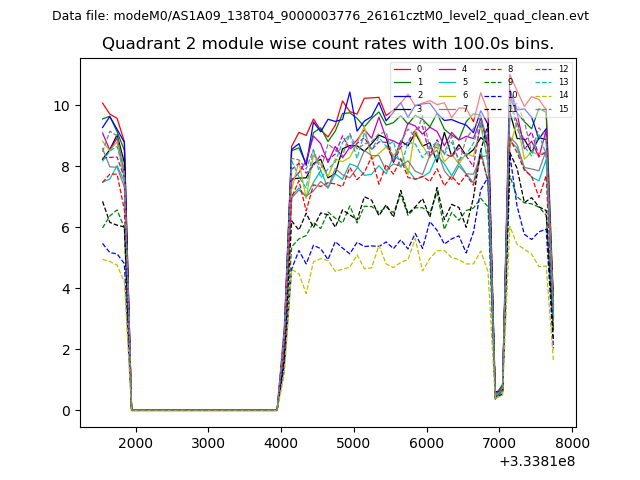
| Quadrant-wise count rates Data is divided into 100 sec bins |
 |
|
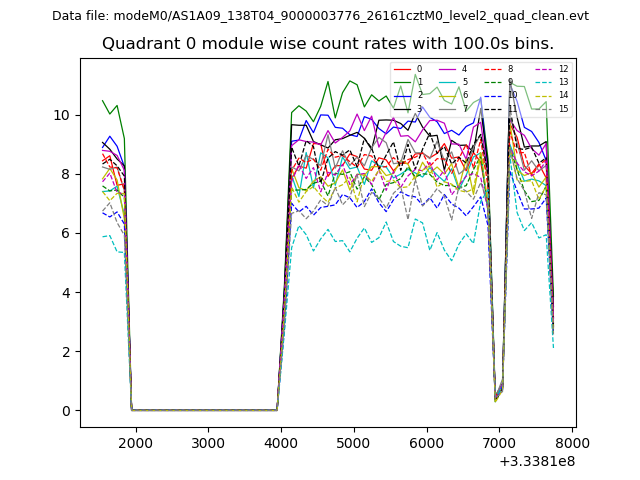
| Module-wise count rates for Quadrant A Data is divided into 100 sec bins |
 |
 |
| Module-wise count rates for Quadrant B Data is divided into 100 sec bins |
 |
 |
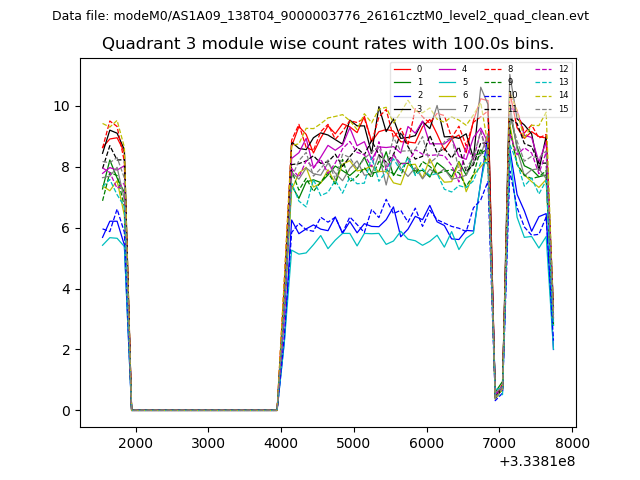
| Module-wise count rates for Quadrant C Data is divided into 100 sec bins |
 |
 |
| Module-wise count rates for Quadrant D Data is divided into 100 sec bins |
 |
 |
| Parameter | Plot |
|---|---|
| CZT HV Monitor | 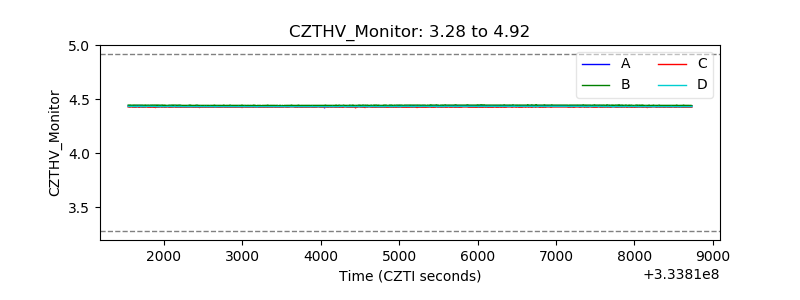 |
| D_VDD | 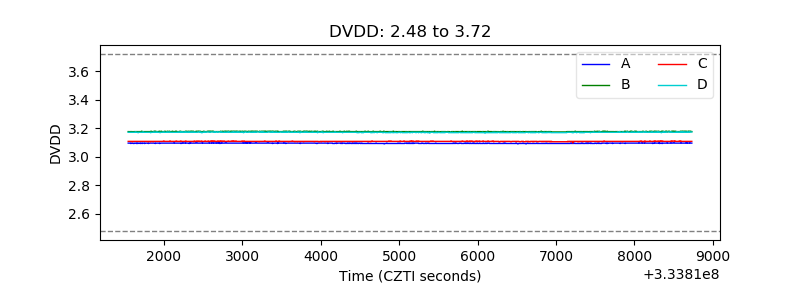 |
| Temperature 1 | 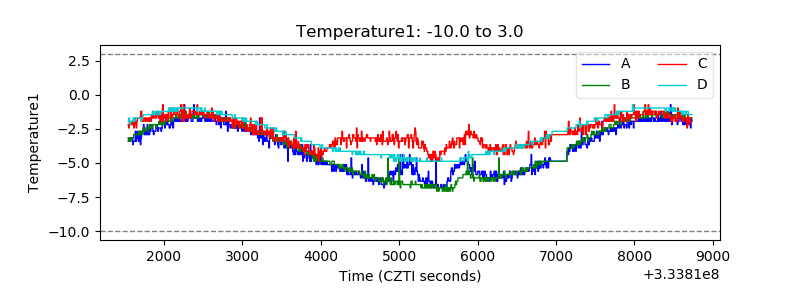 |
| Veto HV Monitor | 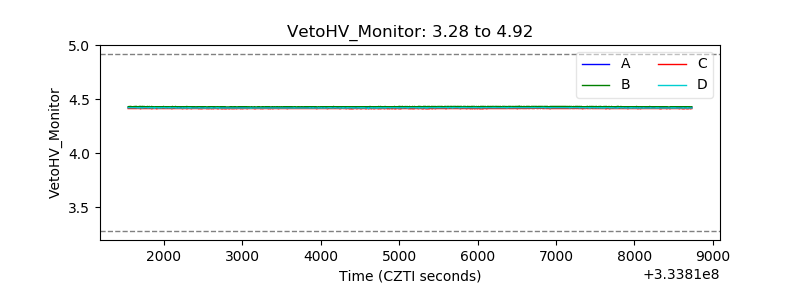 |
| Veto LLD | 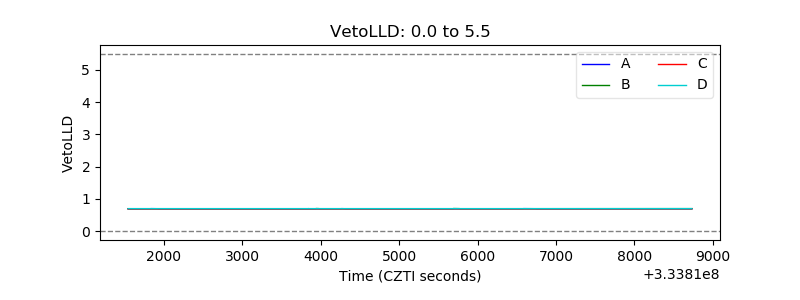 |
| Alpha Counter | 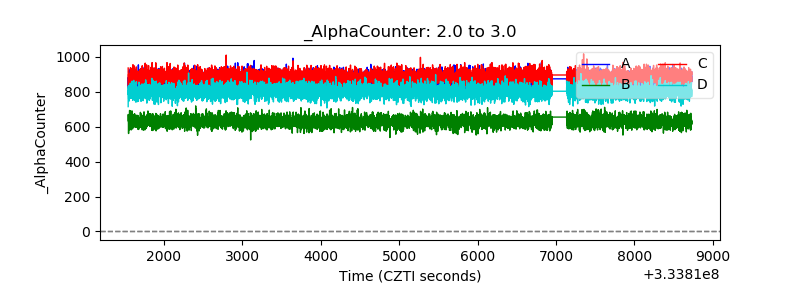 |
| _CPM_Rate | 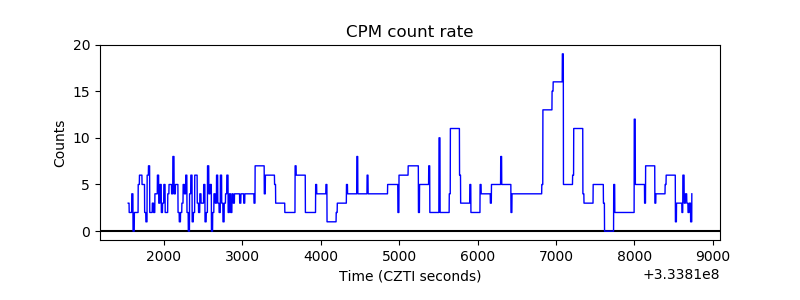 |
| CZT Counter | 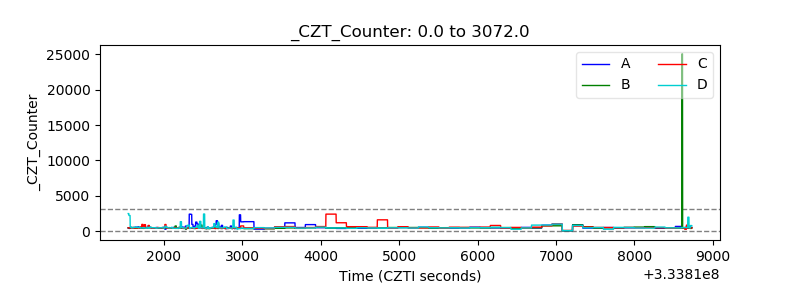 |
| +2.5 Volts monitor | 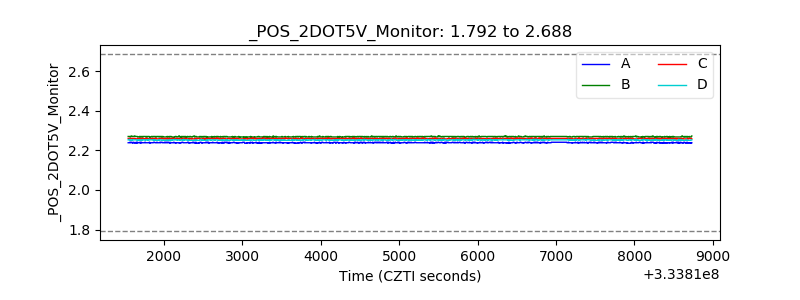 |
| +5 Volts monitor |  |
| _ROLL_ROT | 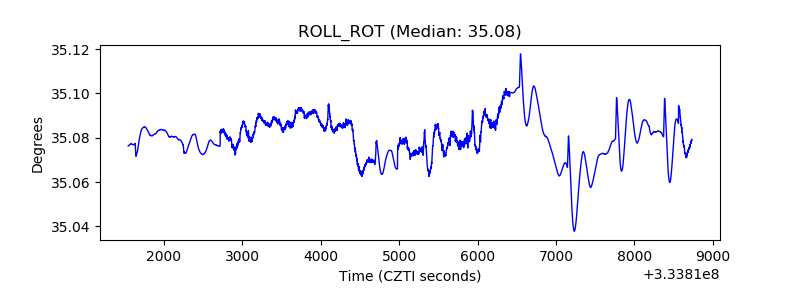 |
| _Roll_DEC | 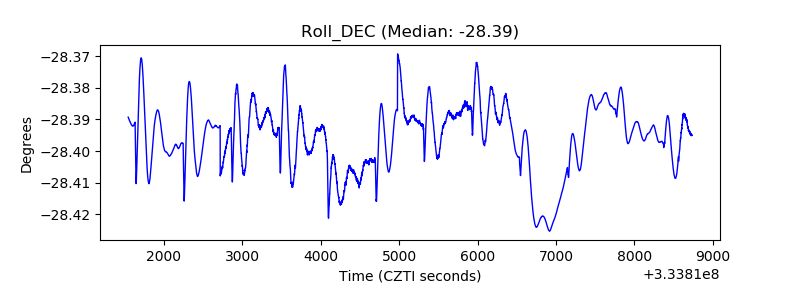 |
| _Roll_RA |  |
| Veto Counter | 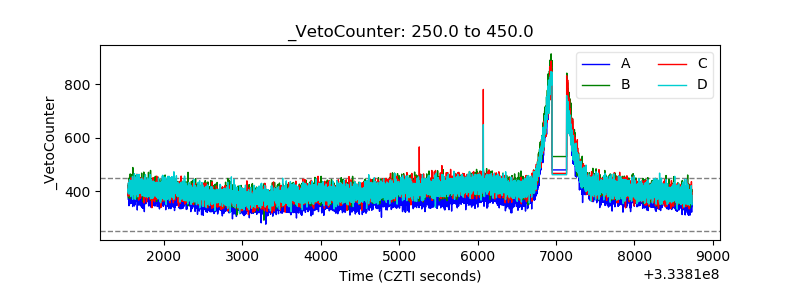 |