| Param | Original file | Final file |
|---|---|---|
| Filename | modeM0/AS1A09_138T04_9000003776_26164cztM0_level2.evt | modeM0/AS1A09_138T04_9000003776_26164cztM0_level2_quad_clean.evt |
| Size (bytes) | 1,327,360,320 | 231,024,960 |
| Size | 1.2 GB | 220.3 MB |
| Events in quadrant A | 9,202,330 | 1,443,986 |
| Events in quadrant B | 9,016,840 | 1,471,573 |
| Events in quadrant C | 10,187,829 | 1,397,743 |
| Events in quadrant D | 10,524,700 | 1,391,435 |
| Mode M9 | |||
|---|---|---|---|
| Quadrant | BADHDUFLAG | Total packets | Discarded packets |
| A | 0 | 18 | 0 |
| B | 0 | 18 | 0 |
| C | 0 | 18 | 0 |
| D | 0 | 18 | 0 |
| Mode M0 | |||
|---|---|---|---|
| Quadrant | BADHDUFLAG | Total packets | Discarded packets |
| A | 0 | 38905 | 0 |
| B | 0 | 38573 | 0 |
| C | 0 | 41743 | 0 |
| D | 0 | 43372 | 0 |
| Quadrant | Total seconds | Saturated seconds | Saturation percentage |
|---|---|---|---|
| A | 18758 | 186 | 0.991577% |
| B | 18759 | 222 | 1.183432% |
| C | 18759 | 408 | 2.174956% |
| D | 18759 | 314 | 1.673863% |
Noise dominated data is calculated using 1-second bins in cleaned event files. If a bin has >2000 counts, and if more than 50% of those come from <1% of pixels, then it is considered to be noise-dominated and hence unusable.
| Quadrant | # 1 sec bins | Bins with >0 counts | Bins with >2000 counts | High rate bins dominated by noise | Noise dominated (total time) | Noise dominated (detector-on time) | Marked lightcurve |
|---|---|---|---|---|---|---|---|
| A | 20493 | 18758 | 0 | 0 | 0.00% | 0.00% | 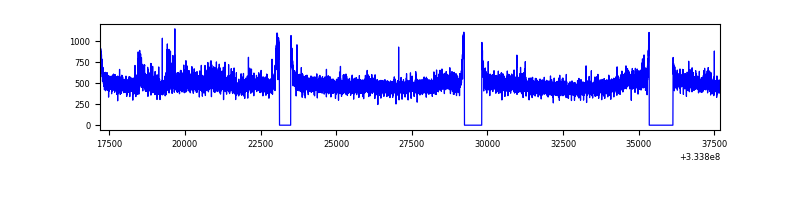 |
| B | 20494 | 18759 | 4 | 4 | 0.02% | 0.02% | 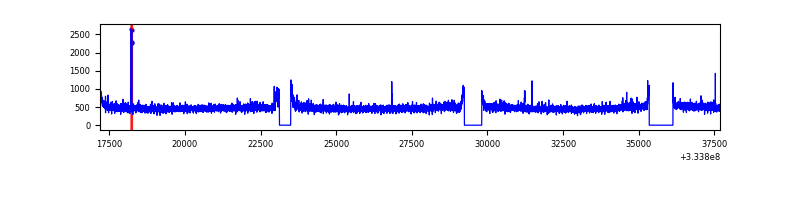 |
| C | 20493 | 18758 | 82 | 82 | 0.40% | 0.44% | 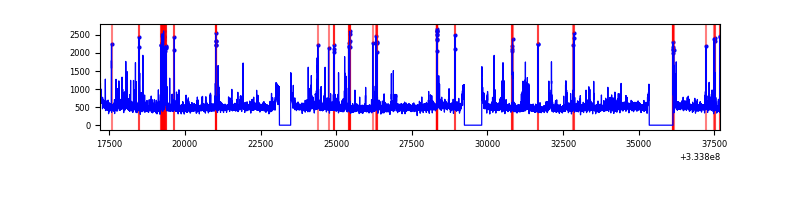 |
| D | 20494 | 18759 | 171 | 171 | 0.83% | 0.91% | 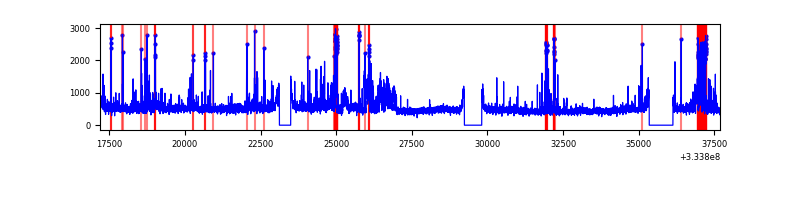 |
Top three noisy pixels from each quadrant. If the there are fewer than three noisy pixels in the level2.evt file, extra rows are filled as -1
| Pixel properties | Quadrant properties | ||||||
|---|---|---|---|---|---|---|---|
| Quadrant | DetID | PixID | Counts | Sigma | Mean | Median | Sigma |
| A | 0 | 13 | 324076 | 701.19 | 2293 | 2241 | 459.0 |
| A | 6 | 16 | 40769 | 83.94 | 2293 | 2241 | 459.0 |
| A | 13 | 254 | 29884 | 60.23 | 2293 | 2241 | 459.0 |
| B | 12 | 111 | 53874 | 118.53 | 2277 | 2219 | 435.8 |
| B | 11 | 111 | 48204 | 105.52 | 2277 | 2219 | 435.8 |
| B | 14 | 111 | 42299 | 91.97 | 2277 | 2219 | 435.8 |
| C | 3 | 233 | 1113318 | 2164.84 | 2192 | 2205 | 513.3 |
| C | 14 | 238 | 349644 | 676.93 | 2192 | 2205 | 513.3 |
| C | 2 | 16 | 184117 | 354.43 | 2192 | 2205 | 513.3 |
| D | 1 | 52 | 1754572 | 3311.92 | 2229 | 2176 | 529.1 |
| D | 12 | 233 | 165318 | 308.33 | 2229 | 2176 | 529.1 |
| D | 2 | 234 | 86840 | 160.01 | 2229 | 2176 | 529.1 |
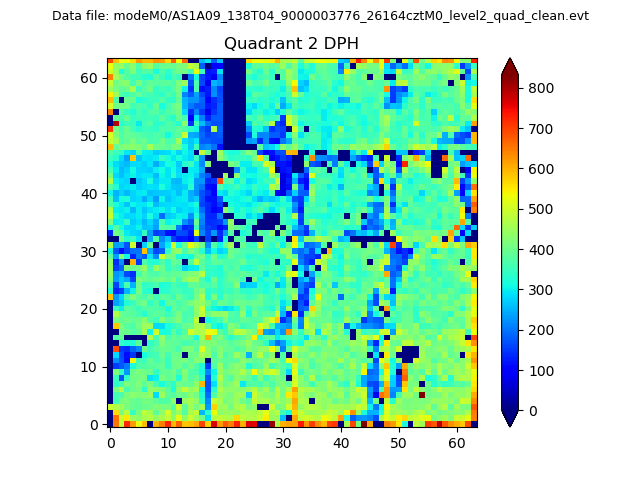
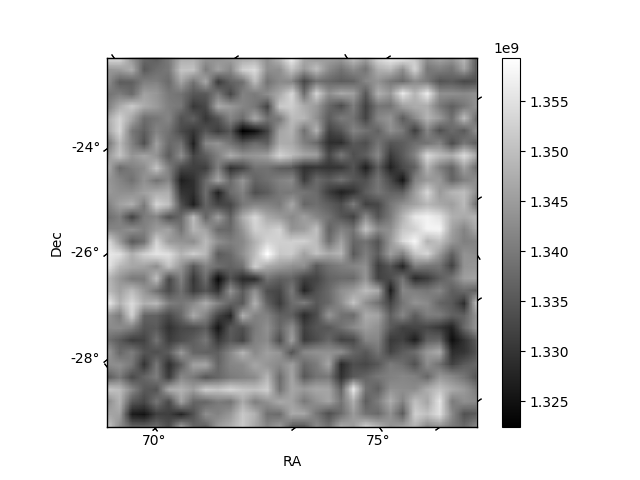
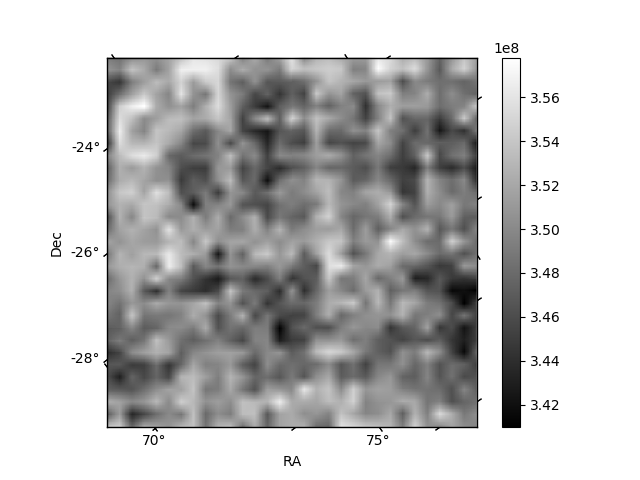
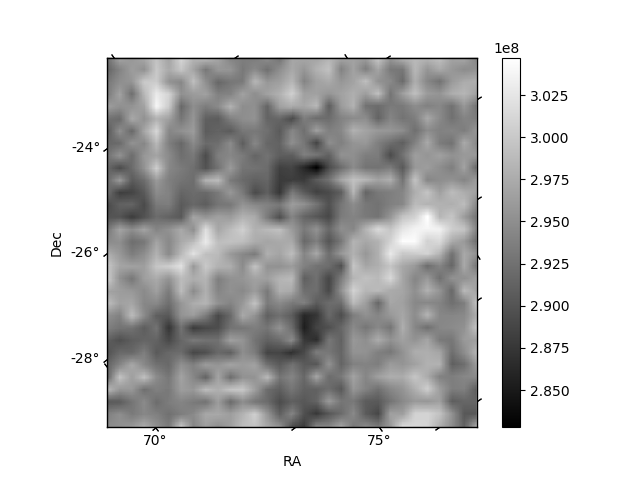
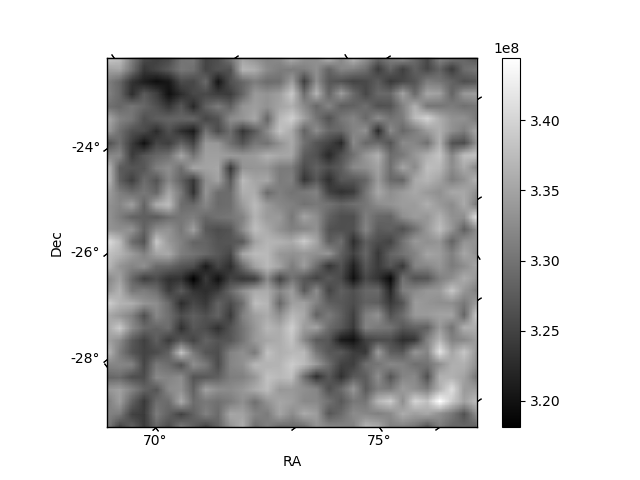
Histogram calculated using DETX and DETY for each event in the final _common_clean file
| Quadrant A | 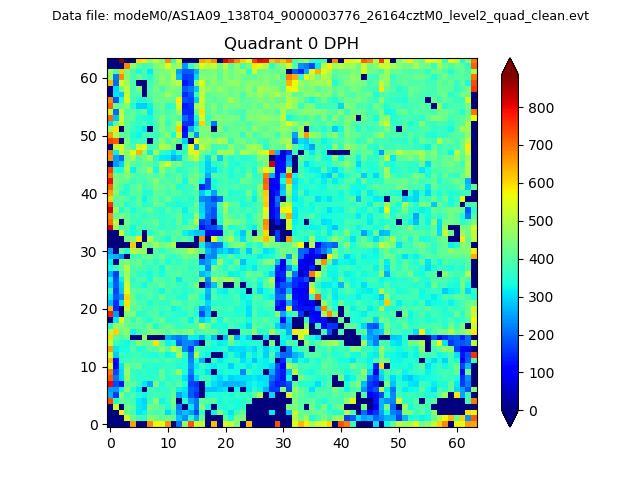 |
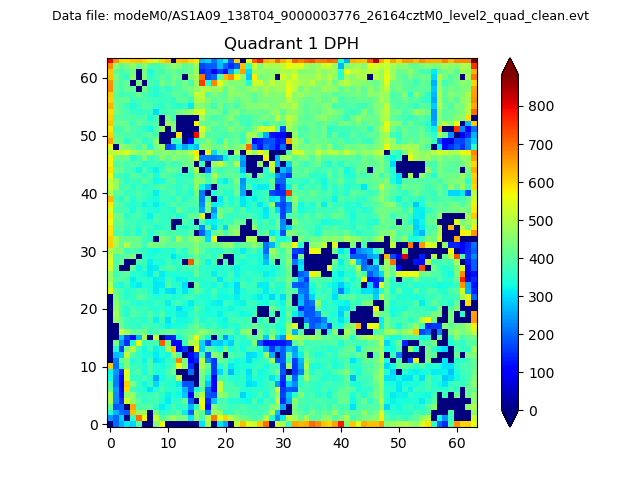 |
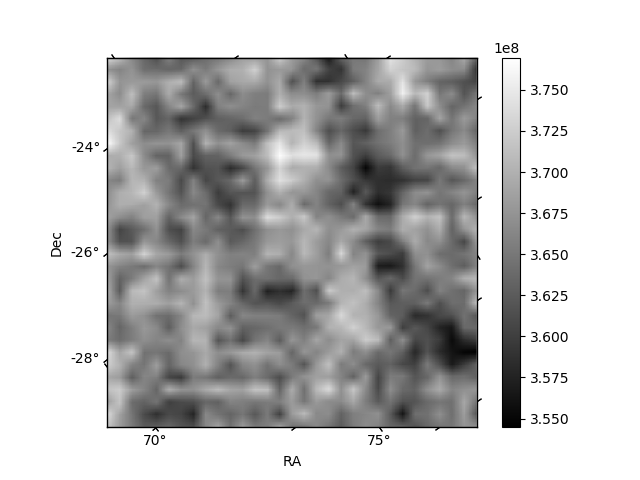
Quadrant B |
|---|---|---|---|
| Quadrant D | 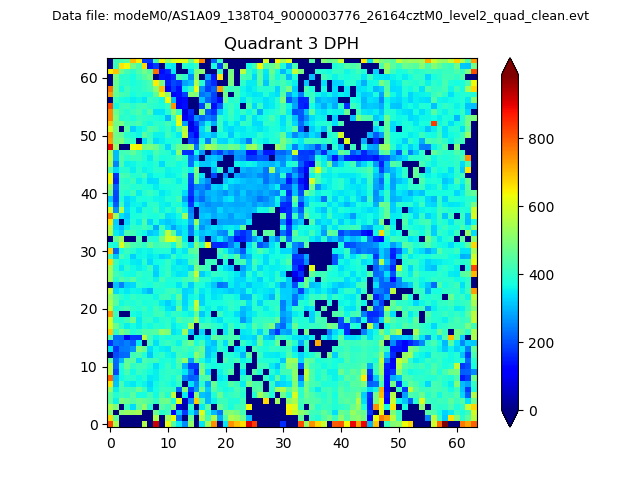 |
 |
Quadrant C |
| Plot type | Count rate plots | Images |
|---|---|---|
| Comparison with Poisson distribution Blue bars denote a histogram of data divided into 1 sec bins. Red curve is a Poisson curve with rate = median count rate of data. |
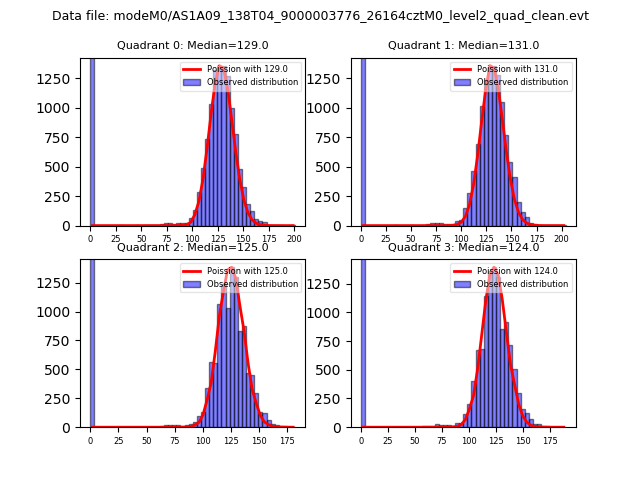 |
 |
| Quadrant-wise count rates Data is divided into 100 sec bins |
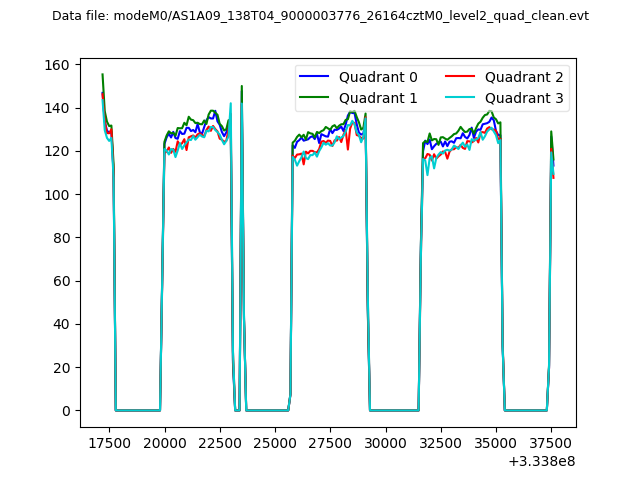 |
|
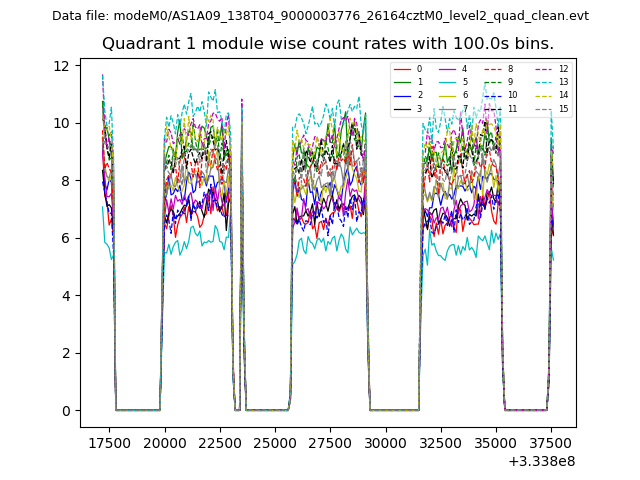
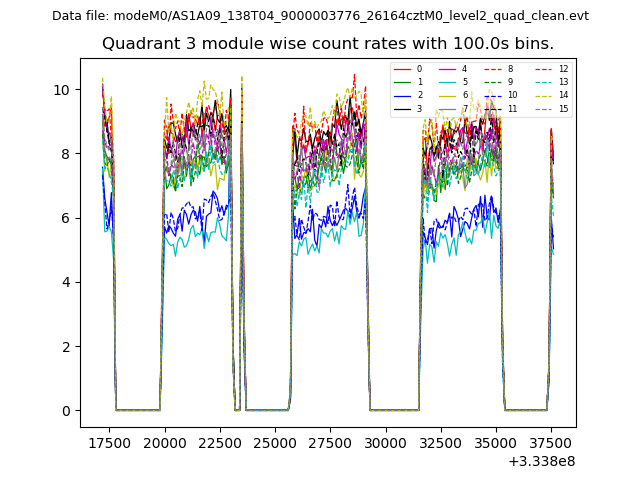
| Module-wise count rates for Quadrant A Data is divided into 100 sec bins |
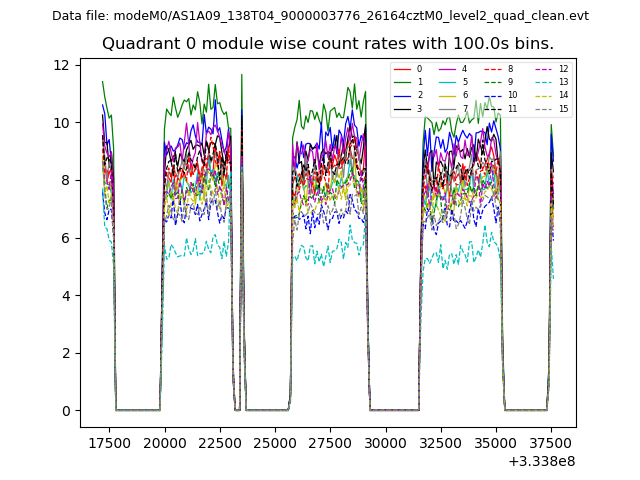 |
 |
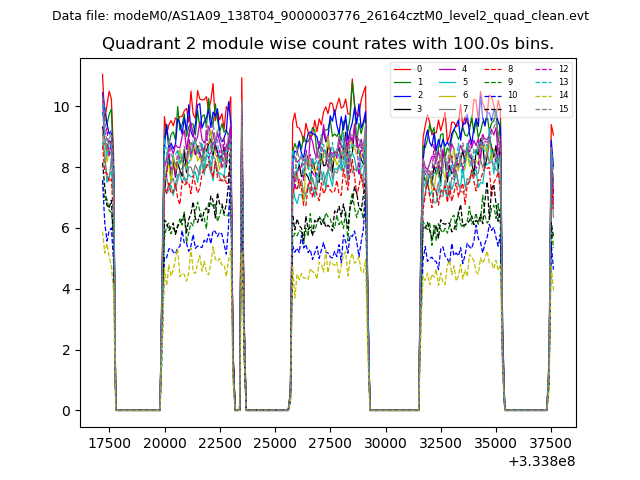
| Module-wise count rates for Quadrant B Data is divided into 100 sec bins |
 |
 |
| Module-wise count rates for Quadrant C Data is divided into 100 sec bins |
 |
 |
| Module-wise count rates for Quadrant D Data is divided into 100 sec bins |
 |
 |
| Parameter | Plot |
|---|---|
| CZT HV Monitor | 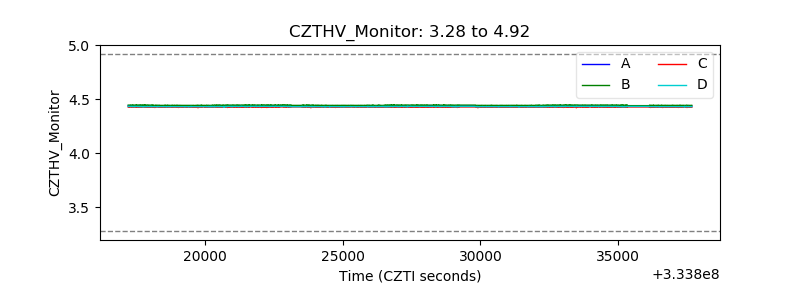 |
| D_VDD | 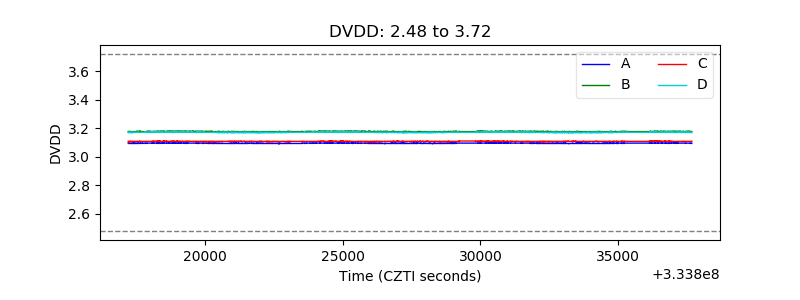 |
| Temperature 1 | 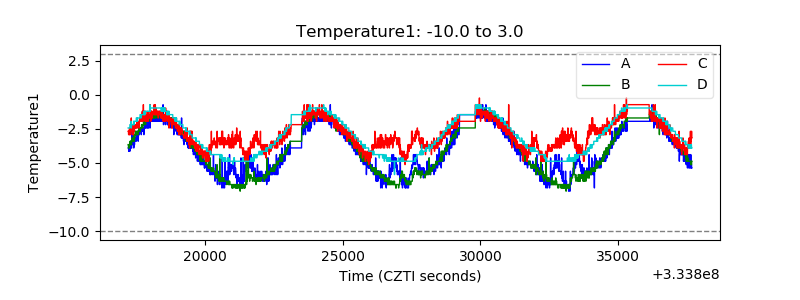 |
| Veto HV Monitor | 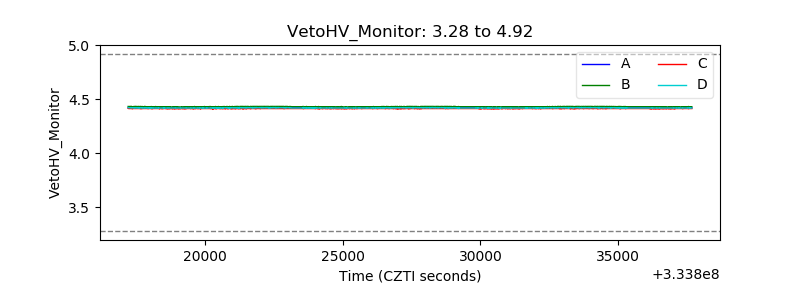 |
| Veto LLD | 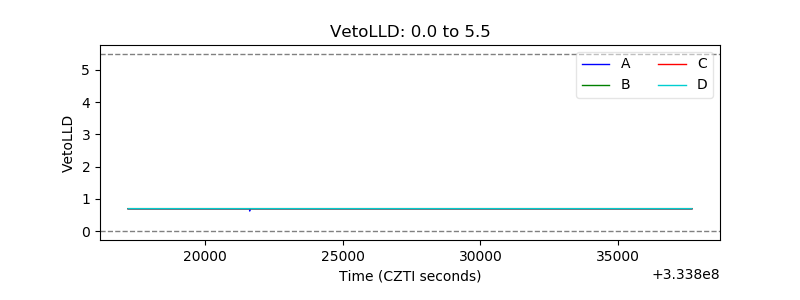 |
| Alpha Counter | 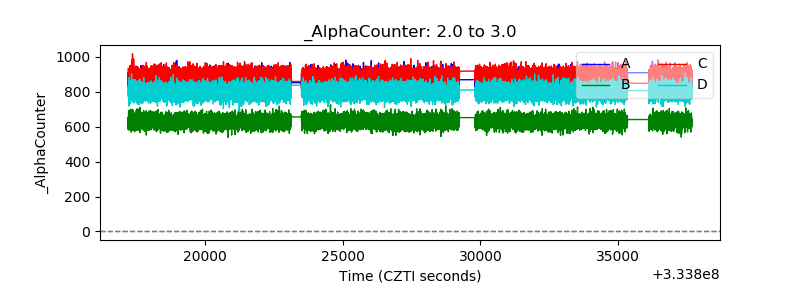 |
| _CPM_Rate |  |
| CZT Counter | 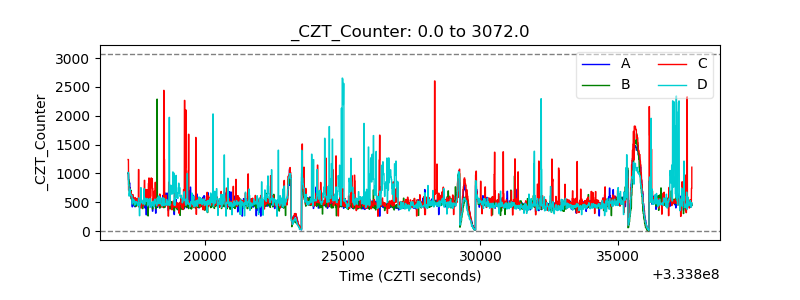 |
| +2.5 Volts monitor |  |
| +5 Volts monitor |  |
| _ROLL_ROT | 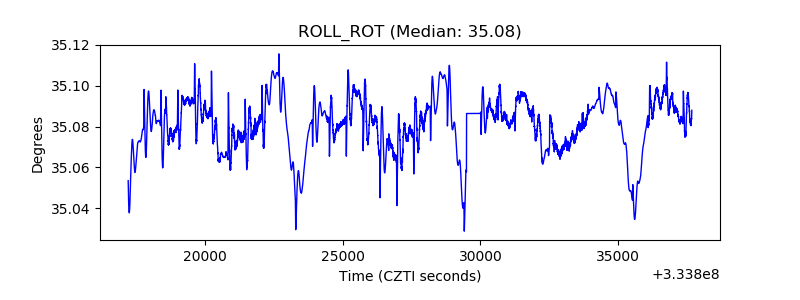 |
| _Roll_DEC | 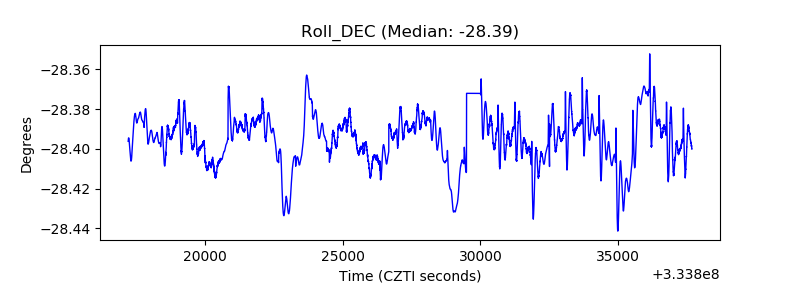 |
| _Roll_RA |  |
| Veto Counter | 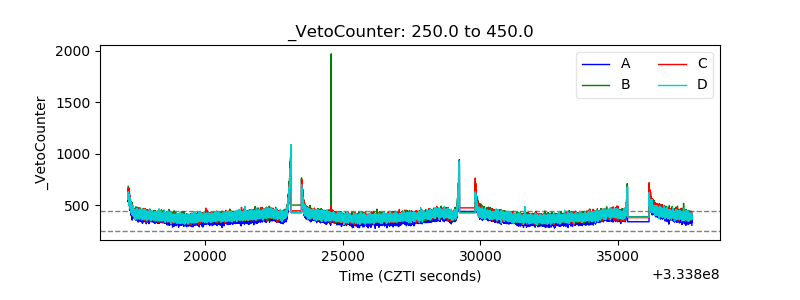 |