| Param | Original file | Final file |
|---|---|---|
| Filename | modeM0/AS1A09_138T04_9000003776_26165cztM0_level2.evt | modeM0/AS1A09_138T04_9000003776_26165cztM0_level2_quad_clean.evt |
| Size (bytes) | 452,649,600 | 84,458,880 |
| Size | 431.7 MB | 80.5 MB |
| Events in quadrant A | 3,157,069 | 534,303 |
| Events in quadrant B | 3,211,985 | 541,937 |
| Events in quadrant C | 3,398,199 | 513,242 |
| Events in quadrant D | 3,496,813 | 511,902 |
| Mode M9 | |||
|---|---|---|---|
| Quadrant | BADHDUFLAG | Total packets | Discarded packets |
| A | 0 | 9 | 0 |
| B | 0 | 9 | 0 |
| C | 0 | 9 | 0 |
| D | 0 | 9 | 0 |
| Mode M0 | |||
|---|---|---|---|
| Quadrant | BADHDUFLAG | Total packets | Discarded packets |
| A | 0 | 13477 | 0 |
| B | 0 | 13563 | 0 |
| C | 0 | 14061 | 0 |
| D | 0 | 14741 | 0 |
| Quadrant | Total seconds | Saturated seconds | Saturation percentage |
|---|---|---|---|
| A | 6539 | 39 | 0.596421% |
| B | 6539 | 50 | 0.764643% |
| C | 6538 | 111 | 1.697767% |
| D | 6538 | 112 | 1.713062% |
Noise dominated data is calculated using 1-second bins in cleaned event files. If a bin has >2000 counts, and if more than 50% of those come from <1% of pixels, then it is considered to be noise-dominated and hence unusable.
| Quadrant | # 1 sec bins | Bins with >0 counts | Bins with >2000 counts | High rate bins dominated by noise | Noise dominated (total time) | Noise dominated (detector-on time) | Marked lightcurve |
|---|---|---|---|---|---|---|---|
| A | 7459 | 6539 | 0 | 0 | 0.00% | 0.00% | 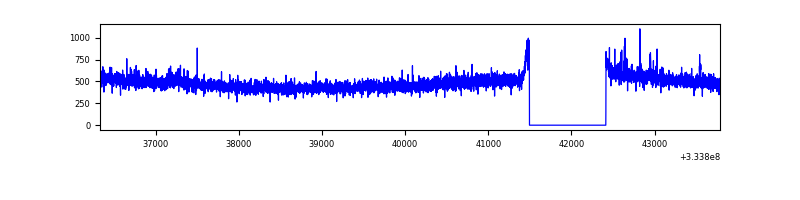 |
| B | 7459 | 6539 | 0 | 0 | 0.00% | 0.00% | 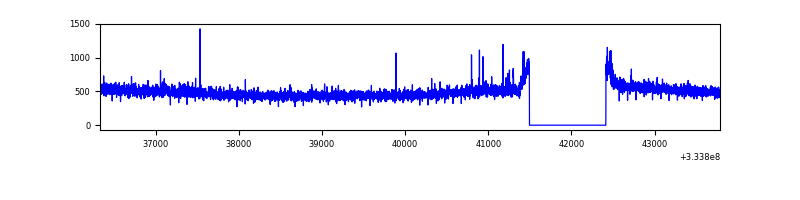 |
| C | 7457 | 6537 | 30 | 30 | 0.40% | 0.46% | 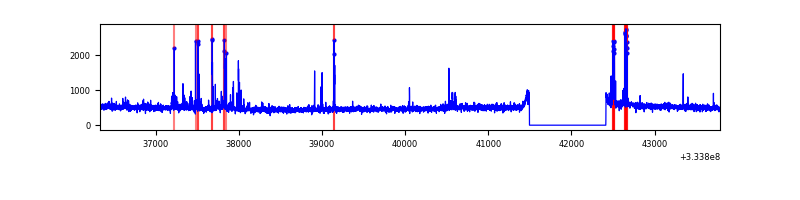 |
| D | 7458 | 6538 | 80 | 80 | 1.07% | 1.22% | 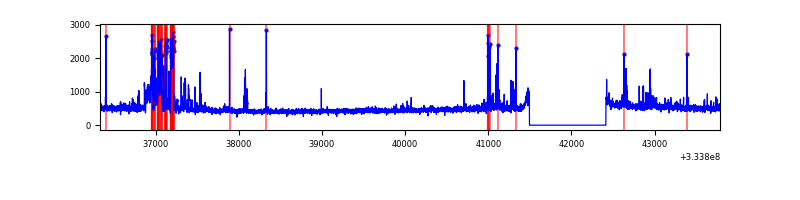 |
Top three noisy pixels from each quadrant. If the there are fewer than three noisy pixels in the level2.evt file, extra rows are filled as -1
| Pixel properties | Quadrant properties | ||||||
|---|---|---|---|---|---|---|---|
| Quadrant | DetID | PixID | Counts | Sigma | Mean | Median | Sigma |
| A | 6 | 16 | 20281 | 119.33 | 808 | 790 | 163.3 |
| A | 0 | 13 | 14545 | 84.21 | 808 | 790 | 163.3 |
| A | 13 | 254 | 11550 | 65.88 | 808 | 790 | 163.3 |
| B | 7 | 219 | 22473 | 140.41 | 806 | 786 | 154.4 |
| B | 12 | 111 | 18827 | 116.81 | 806 | 786 | 154.4 |
| B | 11 | 111 | 16829 | 103.87 | 806 | 786 | 154.4 |
| C | 2 | 16 | 182662 | 996.11 | 776 | 779 | 182.6 |
| C | 14 | 238 | 124940 | 679.99 | 776 | 779 | 182.6 |
| C | 3 | 233 | 57617 | 311.28 | 776 | 779 | 182.6 |
| D | 1 | 52 | 354674 | 1890.42 | 784 | 762 | 187.2 |
| D | 12 | 233 | 107264 | 568.88 | 784 | 762 | 187.2 |
| D | 2 | 234 | 29900 | 155.64 | 784 | 762 | 187.2 |
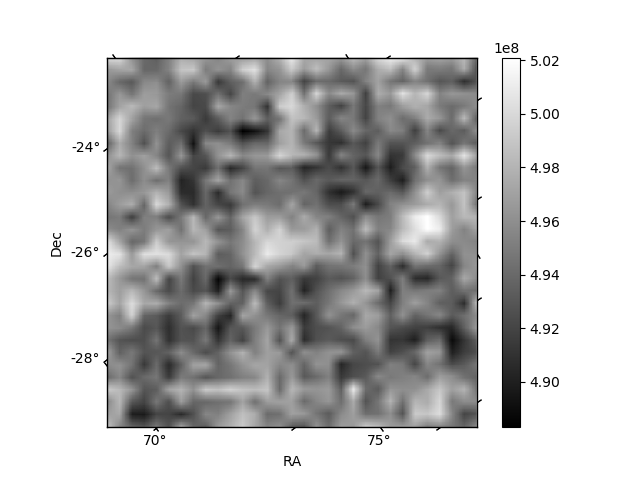
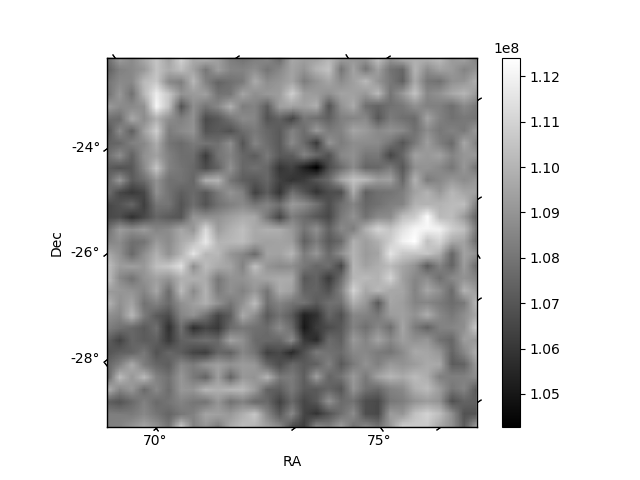
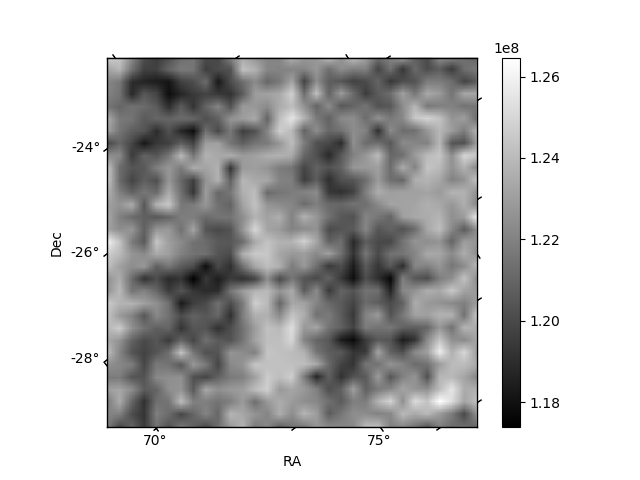
Histogram calculated using DETX and DETY for each event in the final _common_clean file
| Quadrant A | 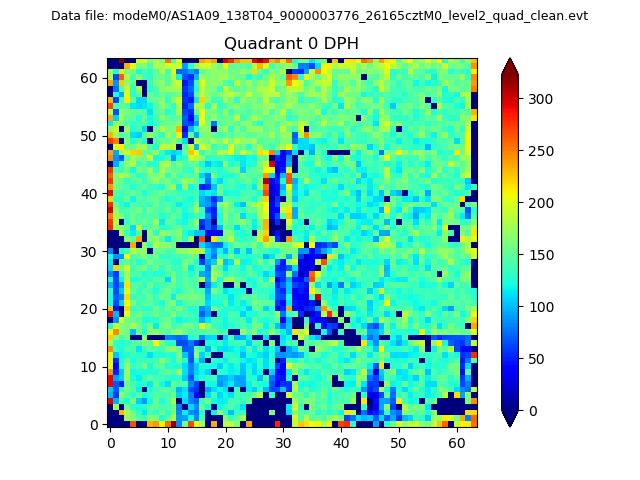 |
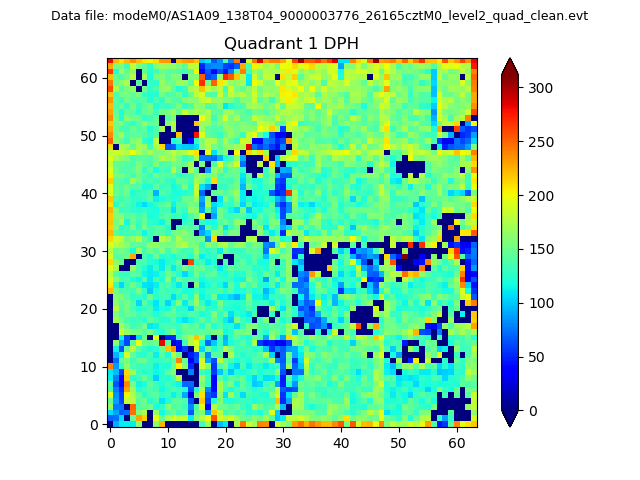 |
Quadrant B |
|---|---|---|---|
| Quadrant D | 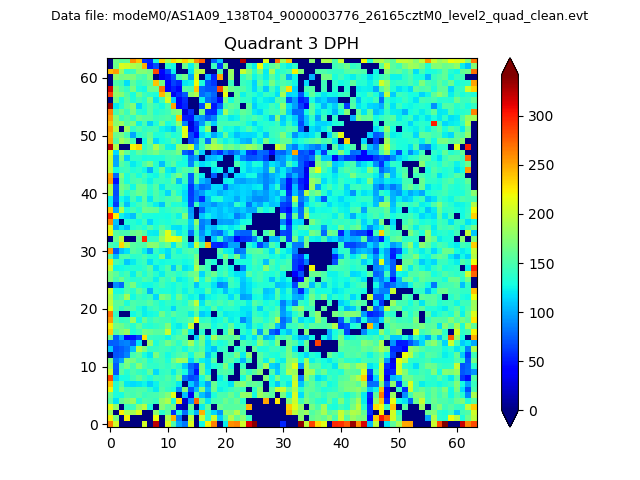 |
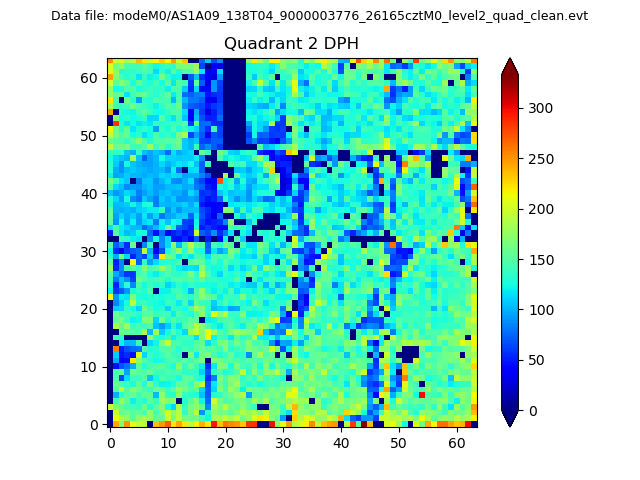 |
Quadrant C |
| Plot type | Count rate plots | Images |
|---|---|---|
| Comparison with Poisson distribution Blue bars denote a histogram of data divided into 1 sec bins. Red curve is a Poisson curve with rate = median count rate of data. |
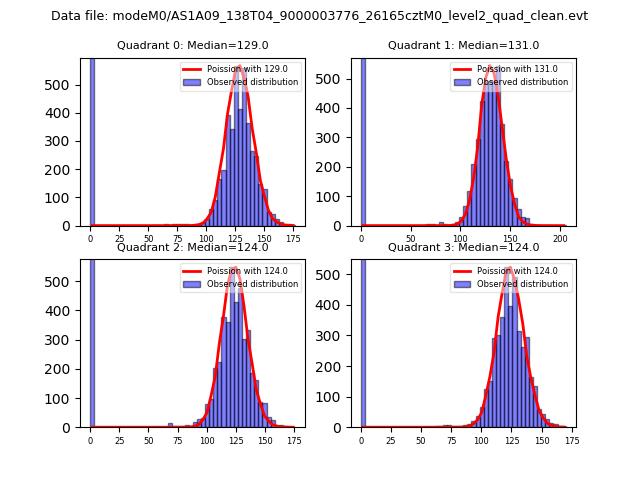 |
 |
| Quadrant-wise count rates Data is divided into 100 sec bins |
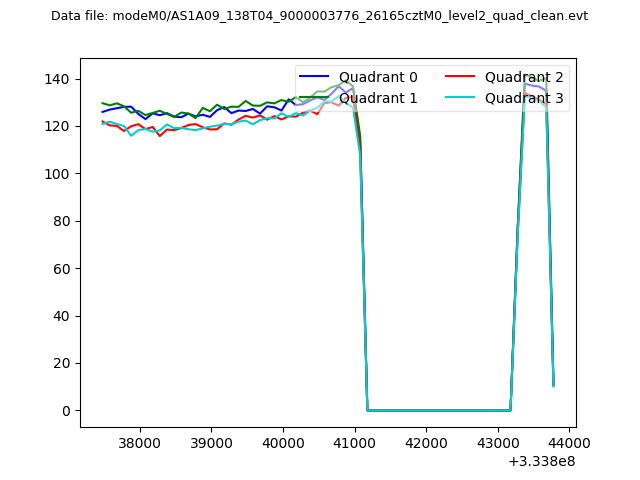 |
|
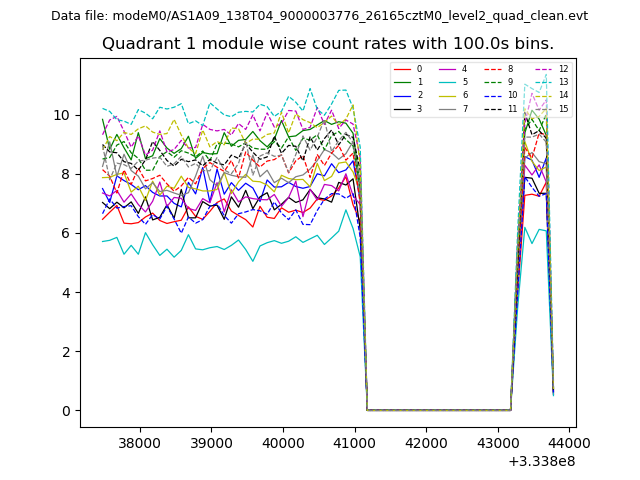
| Module-wise count rates for Quadrant A Data is divided into 100 sec bins |
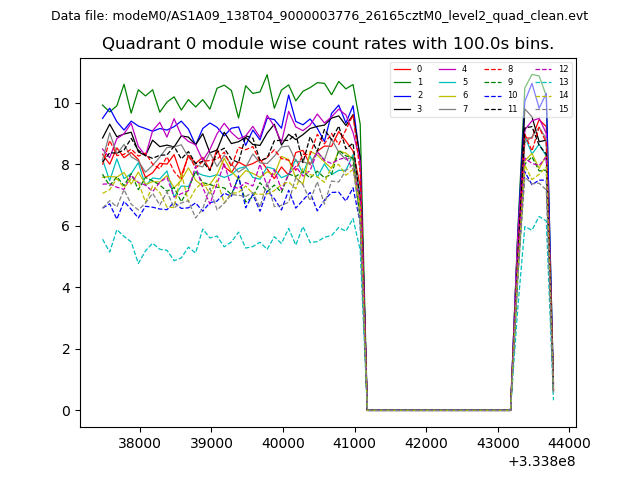 |
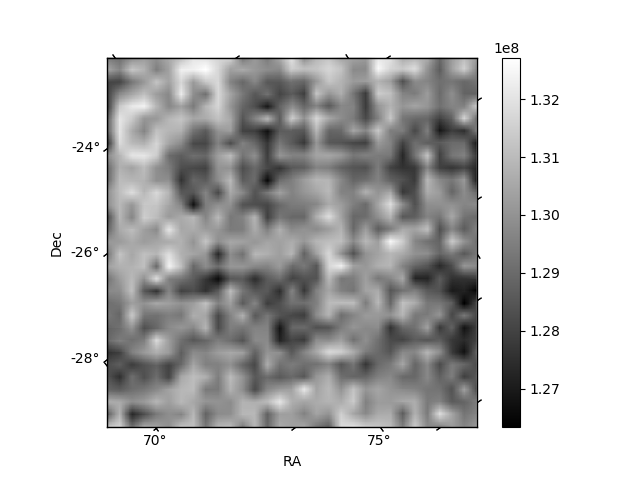 |
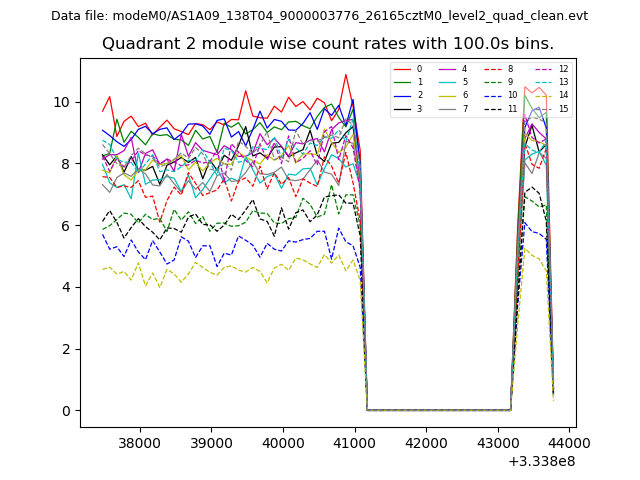
| Module-wise count rates for Quadrant B Data is divided into 100 sec bins |
 |
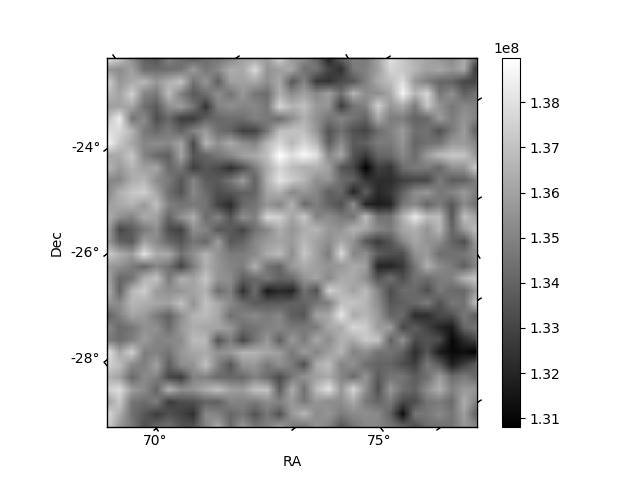 |
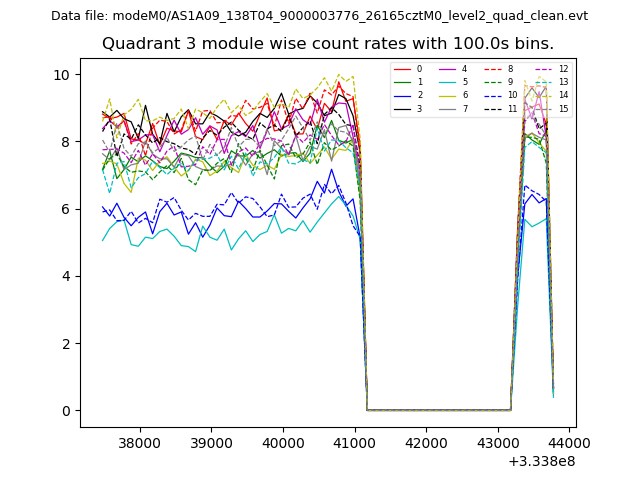
| Module-wise count rates for Quadrant C Data is divided into 100 sec bins |
 |
 |
| Module-wise count rates for Quadrant D Data is divided into 100 sec bins |
 |
 |
| Parameter | Plot |
|---|---|
| CZT HV Monitor | 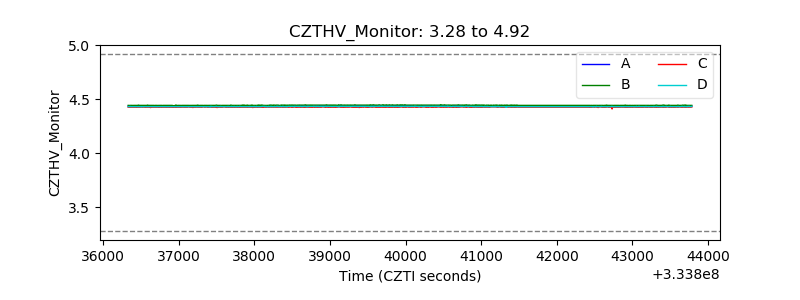 |
| D_VDD | 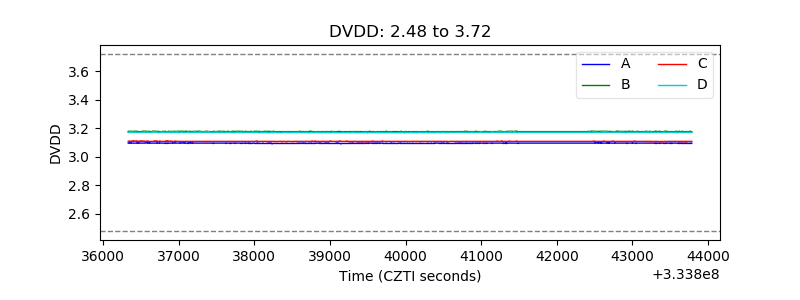 |
| Temperature 1 | 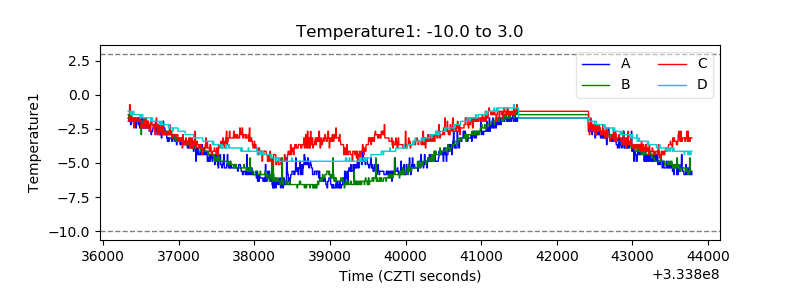 |
| Veto HV Monitor | 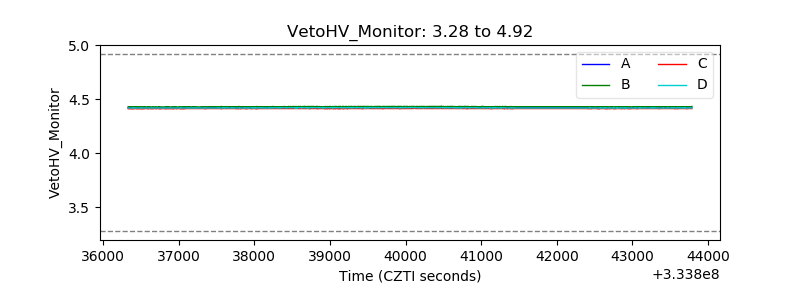 |
| Veto LLD | 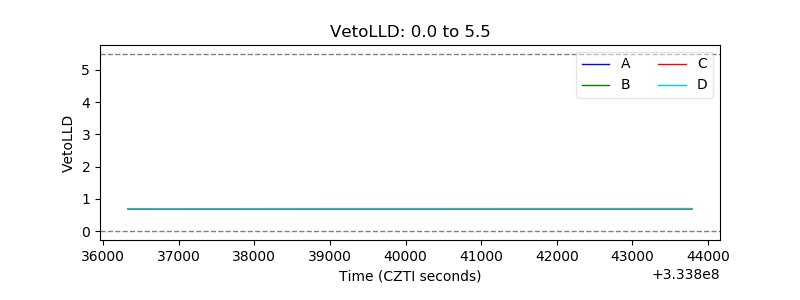 |
| Alpha Counter | 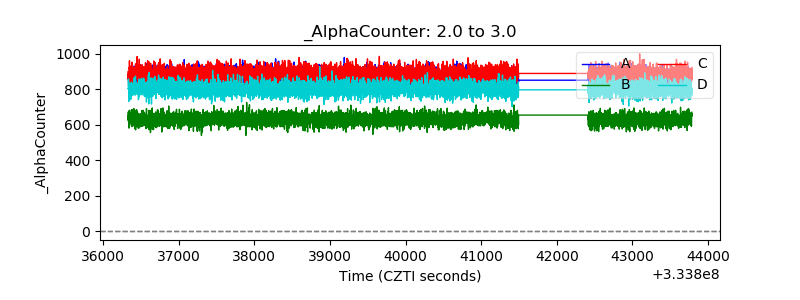 |
| _CPM_Rate | 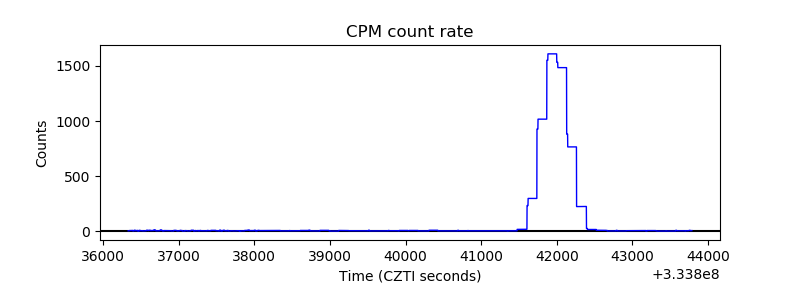 |
| CZT Counter | 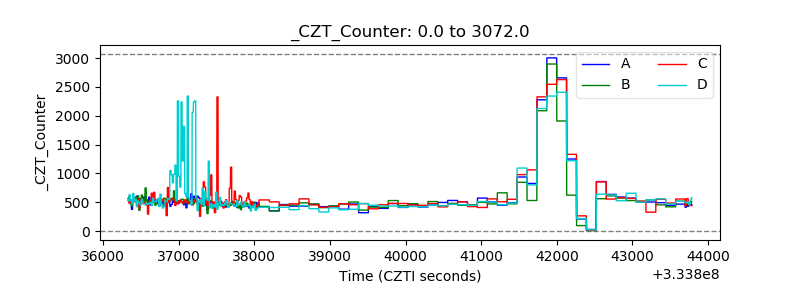 |
| +2.5 Volts monitor |  |
| +5 Volts monitor |  |
| _ROLL_ROT | 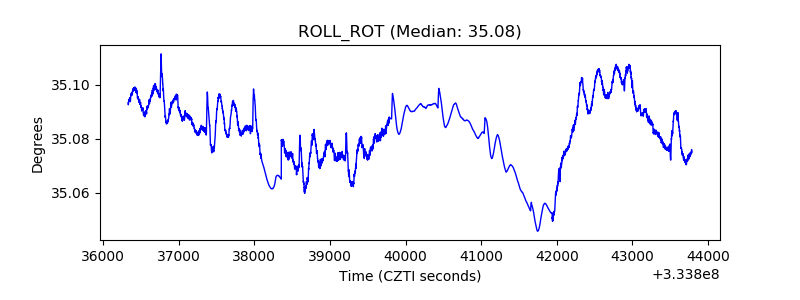 |
| _Roll_DEC | 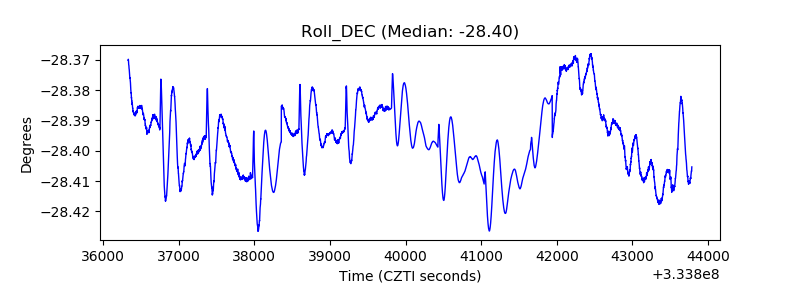 |
| _Roll_RA | 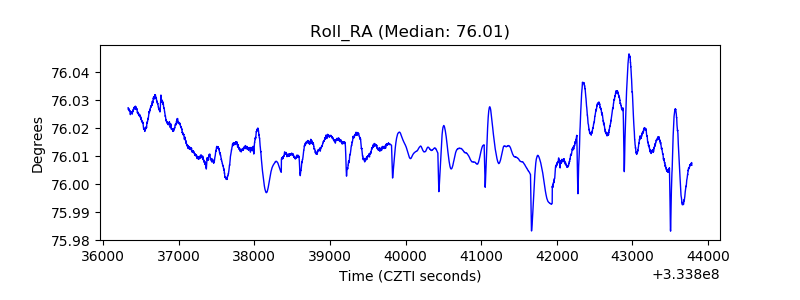 |
| Veto Counter | 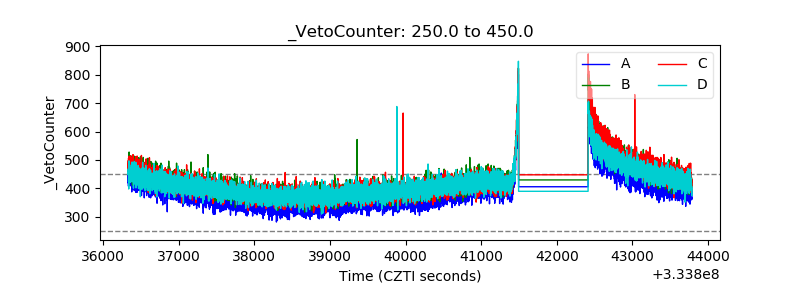 |