| Param | Original file | Final file |
|---|---|---|
| Filename | modeM0/AS1A09_138T04_9000003776_26166cztM0_level2.evt | modeM0/AS1A09_138T04_9000003776_26166cztM0_level2_quad_clean.evt |
| Size (bytes) | 452,687,040 | 93,813,120 |
| Size | 431.7 MB | 89.5 MB |
| Events in quadrant A | 3,206,810 | 603,822 |
| Events in quadrant B | 3,254,270 | 616,490 |
| Events in quadrant C | 3,401,288 | 587,685 |
| Events in quadrant D | 3,408,091 | 582,324 |
| Mode M9 | |||
|---|---|---|---|
| Quadrant | BADHDUFLAG | Total packets | Discarded packets |
| A | 0 | 11 | 0 |
| B | 0 | 12 | 0 |
| C | 0 | 12 | 0 |
| D | 0 | 12 | 0 |
| Mode M0 | |||
|---|---|---|---|
| Quadrant | BADHDUFLAG | Total packets | Discarded packets |
| A | 0 | 13602 | 0 |
| B | 0 | 13692 | 0 |
| C | 0 | 14141 | 0 |
| D | 0 | 14159 | 0 |
| Quadrant | Total seconds | Saturated seconds | Saturation percentage |
|---|---|---|---|
| A | 6468 | 27 | 0.417440% |
| B | 6468 | 49 | 0.757576% |
| C | 6467 | 110 | 1.700943% |
| D | 6467 | 39 | 0.603062% |
Noise dominated data is calculated using 1-second bins in cleaned event files. If a bin has >2000 counts, and if more than 50% of those come from <1% of pixels, then it is considered to be noise-dominated and hence unusable.
| Quadrant | # 1 sec bins | Bins with >0 counts | Bins with >2000 counts | High rate bins dominated by noise | Noise dominated (total time) | Noise dominated (detector-on time) | Marked lightcurve |
|---|---|---|---|---|---|---|---|
| A | 7558 | 6468 | 0 | 0 | 0.00% | 0.00% | 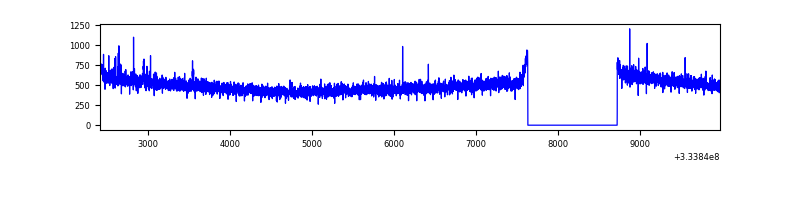 |
| B | 7557 | 6467 | 0 | 0 | 0.00% | 0.00% | 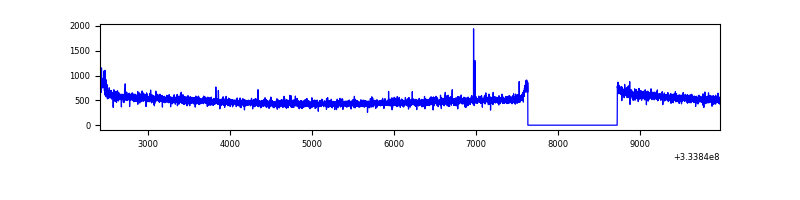 |
| C | 7557 | 6467 | 23 | 23 | 0.30% | 0.36% | 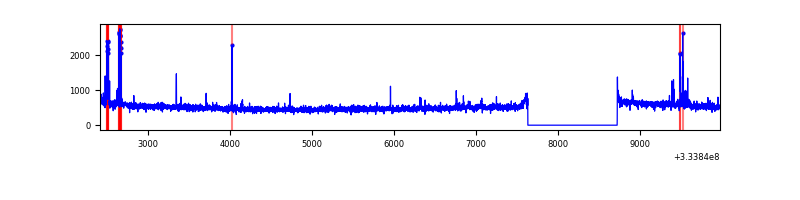 |
| D | 7556 | 6466 | 7 | 7 | 0.09% | 0.11% | 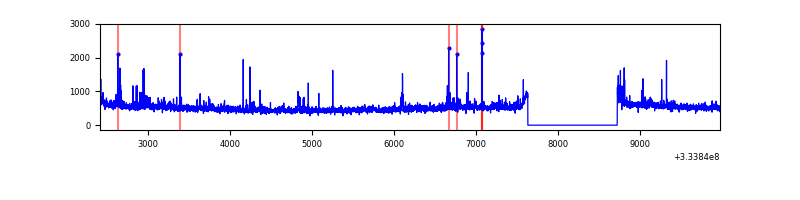 |
Top three noisy pixels from each quadrant. If the there are fewer than three noisy pixels in the level2.evt file, extra rows are filled as -1
| Pixel properties | Quadrant properties | ||||||
|---|---|---|---|---|---|---|---|
| Quadrant | DetID | PixID | Counts | Sigma | Mean | Median | Sigma |
| A | 6 | 16 | 14040 | 80.04 | 825 | 808 | 165.3 |
| A | 13 | 254 | 10815 | 60.53 | 825 | 808 | 165.3 |
| A | 3 | 137 | 7650 | 41.39 | 825 | 808 | 165.3 |
| B | 12 | 111 | 18956 | 114.95 | 824 | 805 | 157.9 |
| B | 11 | 111 | 16911 | 102.0 | 824 | 805 | 157.9 |
| B | 14 | 111 | 15005 | 89.93 | 824 | 805 | 157.9 |
| C | 14 | 238 | 128223 | 682.37 | 799 | 803 | 186.7 |
| C | 2 | 16 | 116495 | 619.56 | 799 | 803 | 186.7 |
| C | 3 | 233 | 42702 | 224.38 | 799 | 803 | 186.7 |
| D | 1 | 52 | 246224 | 1284.56 | 807 | 789 | 191.1 |
| D | 12 | 233 | 57467 | 296.64 | 807 | 789 | 191.1 |
| D | 8 | 195 | 31887 | 162.76 | 807 | 789 | 191.1 |
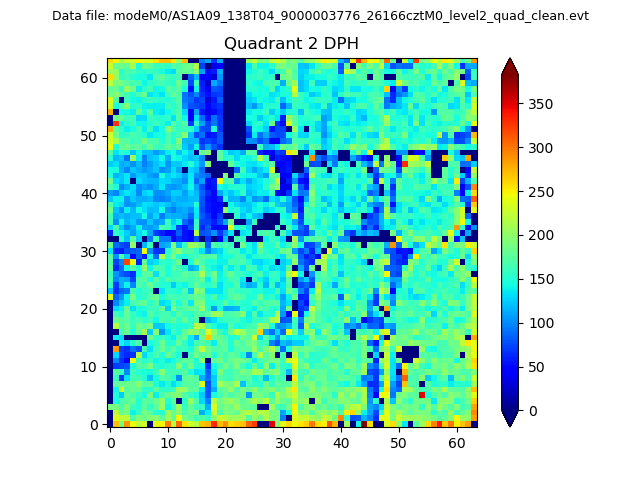
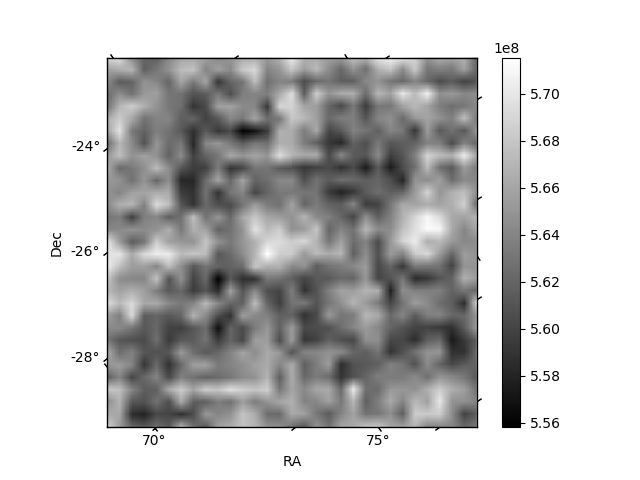
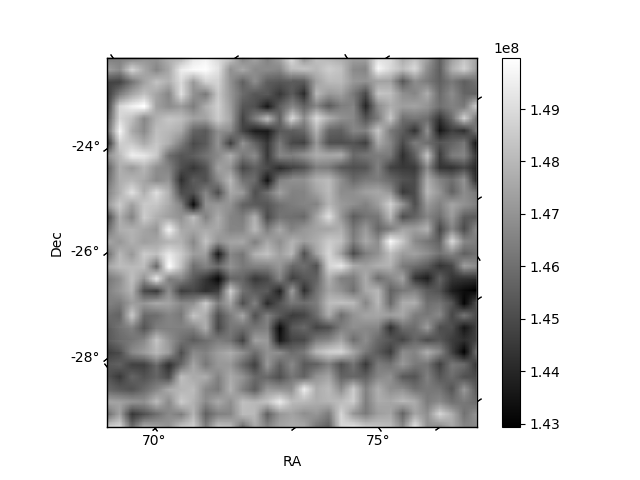
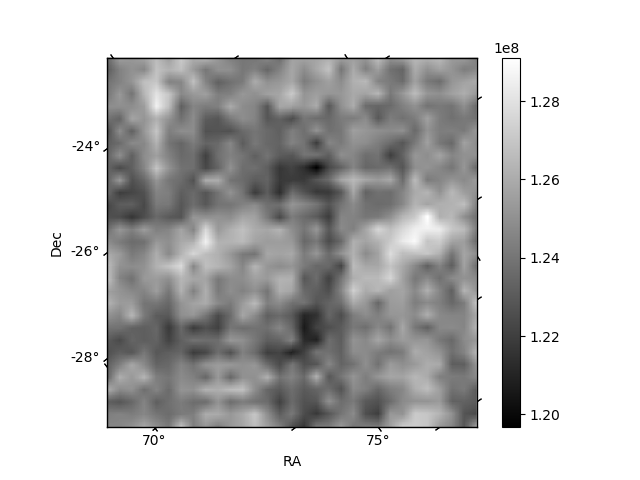
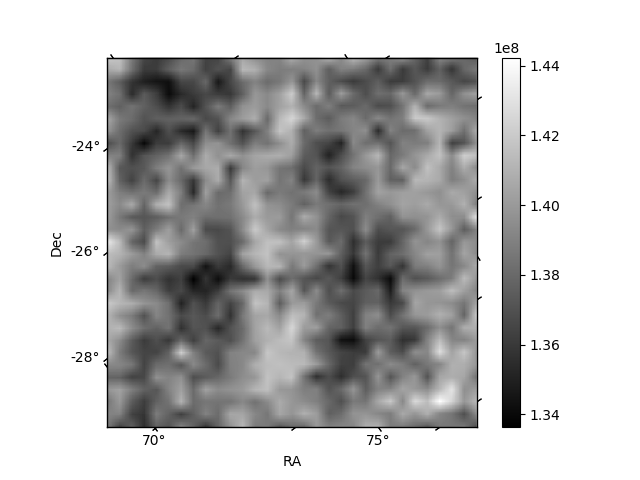
Histogram calculated using DETX and DETY for each event in the final _common_clean file
| Quadrant A | 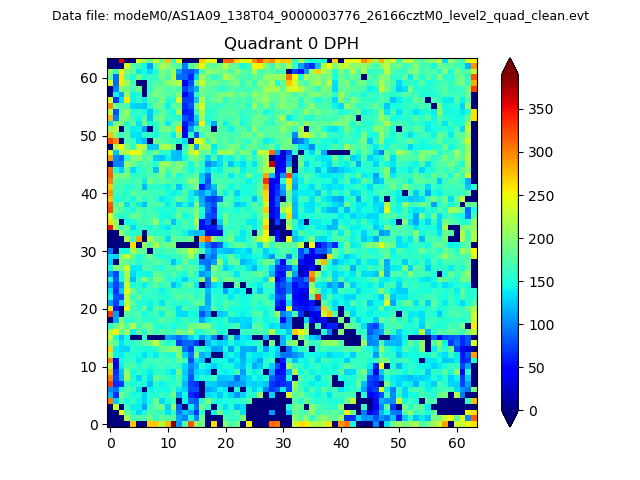 |
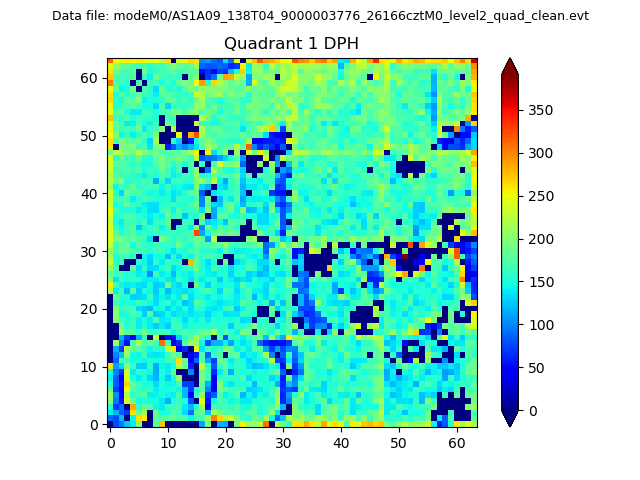 |
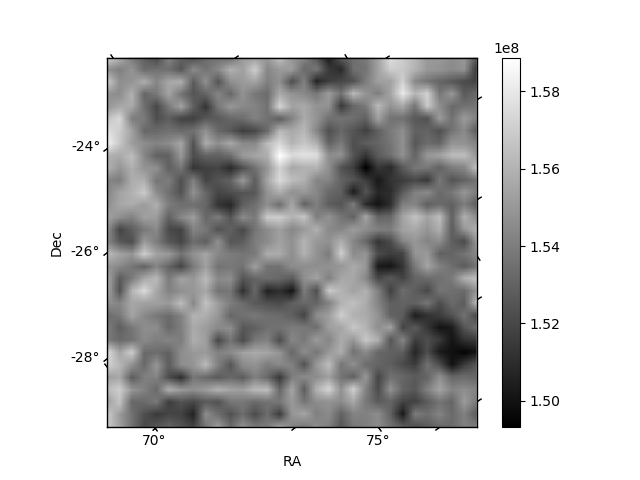
Quadrant B |
|---|---|---|---|
| Quadrant D | 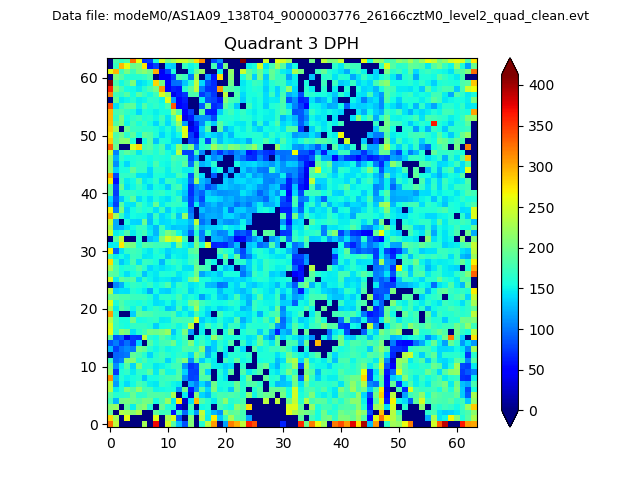 |
 |
Quadrant C |
| Plot type | Count rate plots | Images |
|---|---|---|
| Comparison with Poisson distribution Blue bars denote a histogram of data divided into 1 sec bins. Red curve is a Poisson curve with rate = median count rate of data. |
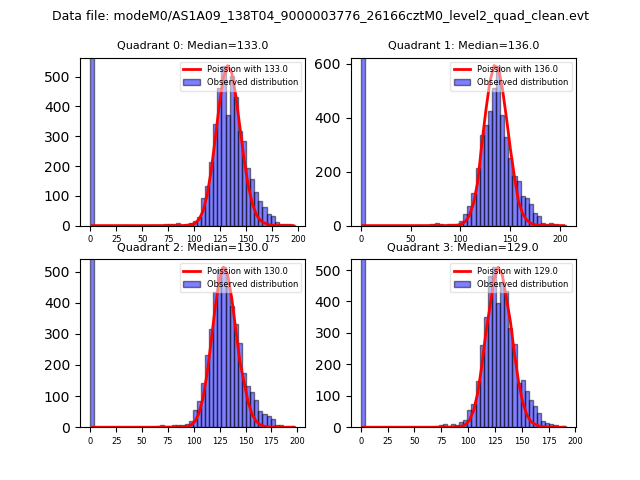 |
 |
| Quadrant-wise count rates Data is divided into 100 sec bins |
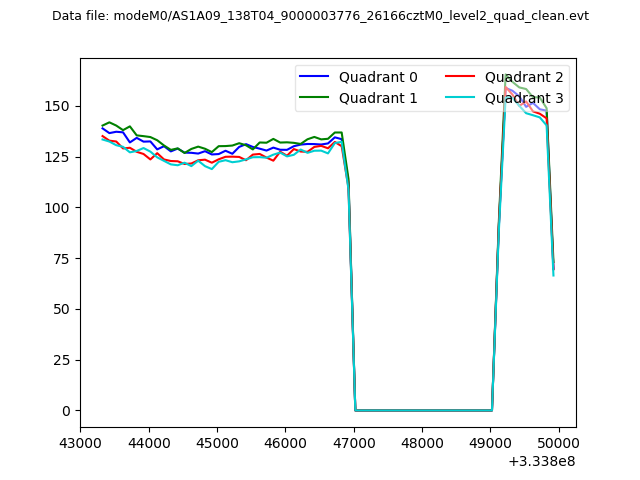 |
|
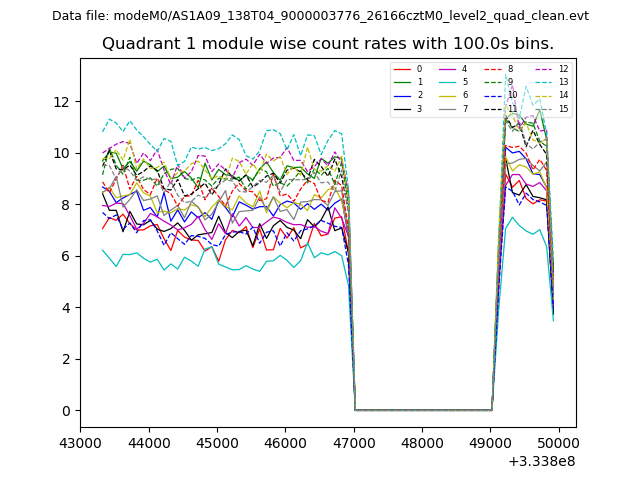
| Module-wise count rates for Quadrant A Data is divided into 100 sec bins |
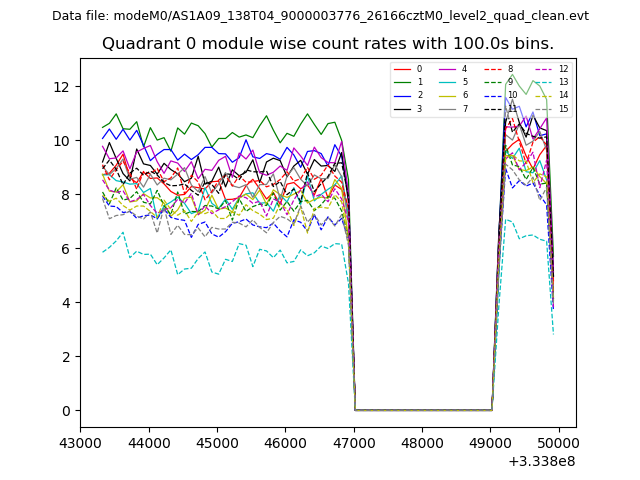 |
 |
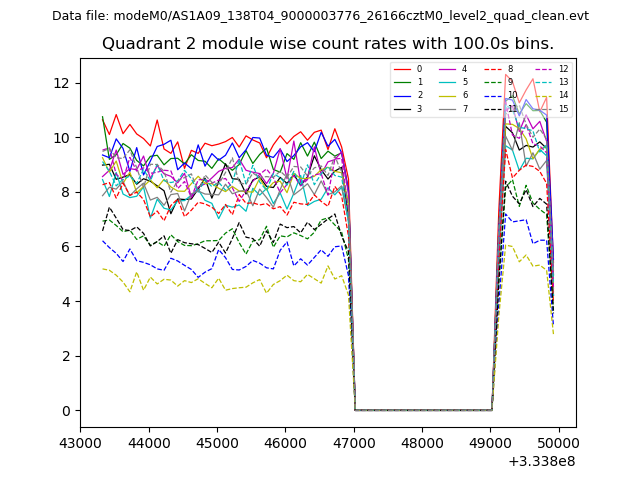
| Module-wise count rates for Quadrant B Data is divided into 100 sec bins |
 |
 |
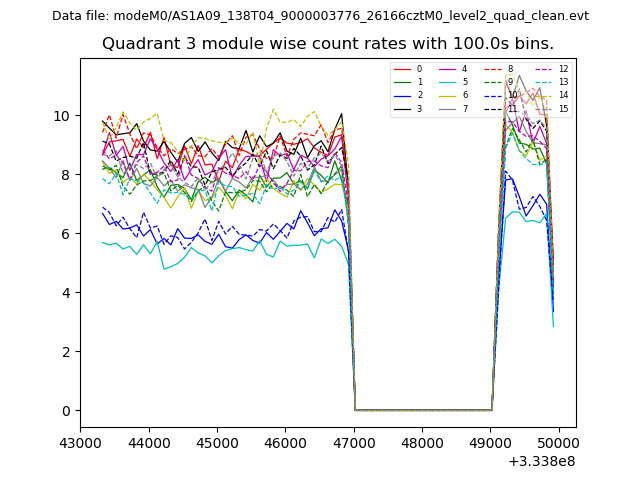
| Module-wise count rates for Quadrant C Data is divided into 100 sec bins |
 |
 |
| Module-wise count rates for Quadrant D Data is divided into 100 sec bins |
 |
 |
| Parameter | Plot |
|---|---|
| CZT HV Monitor | 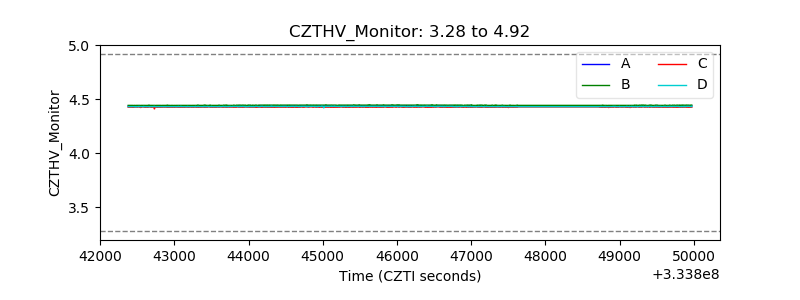 |
| D_VDD | 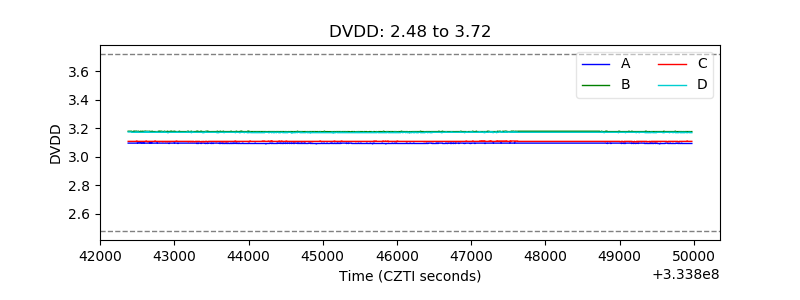 |
| Temperature 1 | 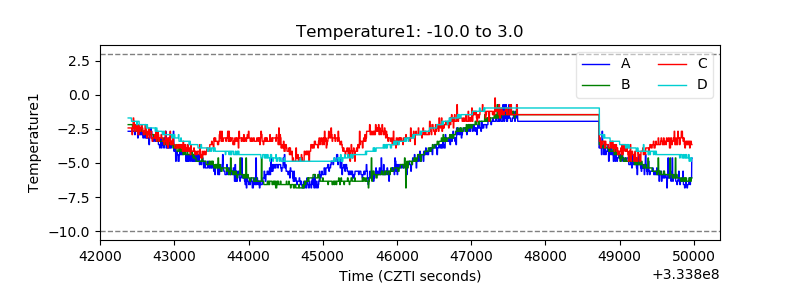 |
| Veto HV Monitor |  |
| Veto LLD |  |
| Alpha Counter | 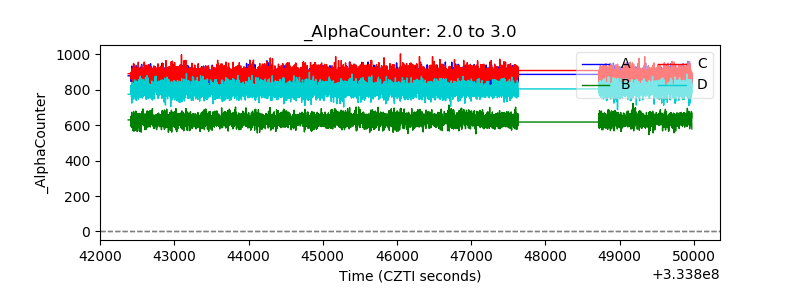 |
| _CPM_Rate | 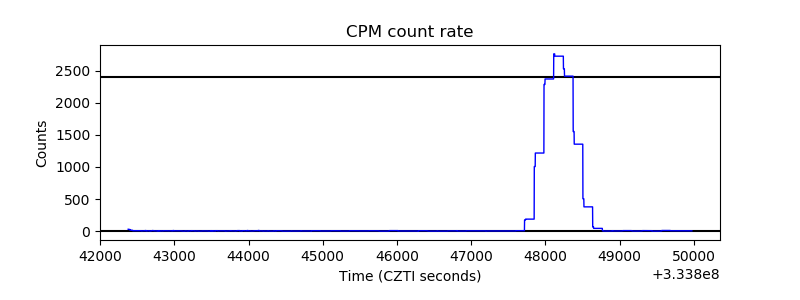 |
| CZT Counter | 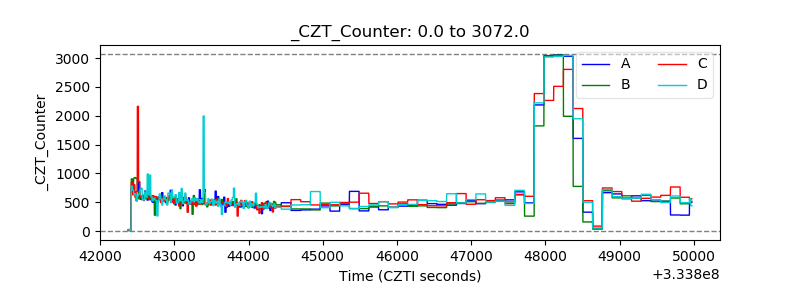 |
| +2.5 Volts monitor | 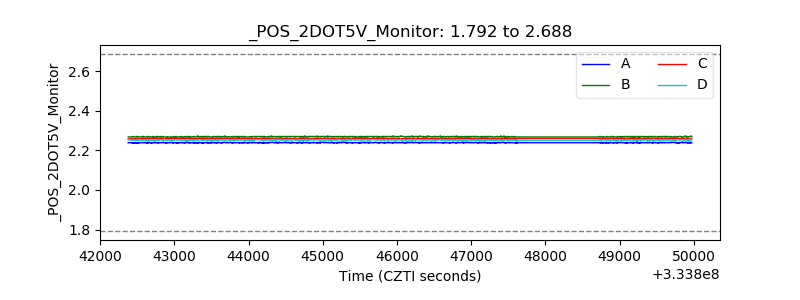 |
| +5 Volts monitor |  |
| _ROLL_ROT | 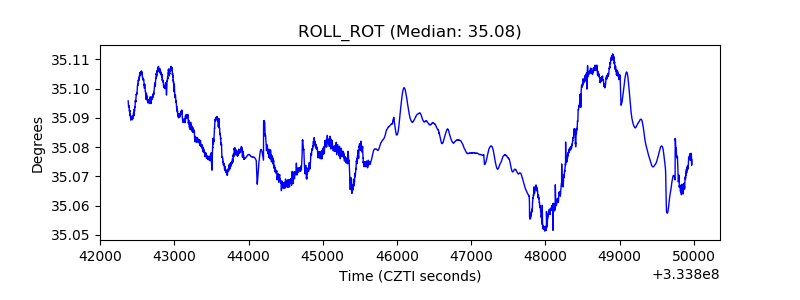 |
| _Roll_DEC | 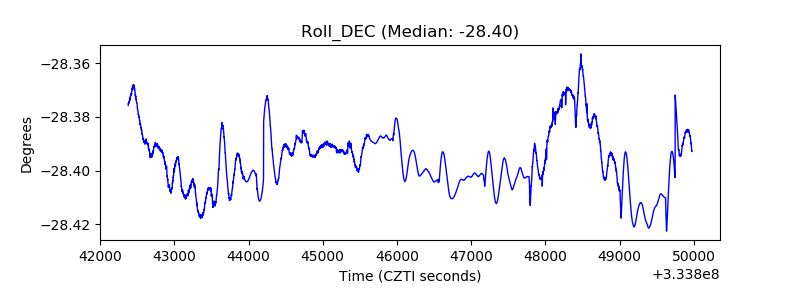 |
| _Roll_RA |  |
| Veto Counter | 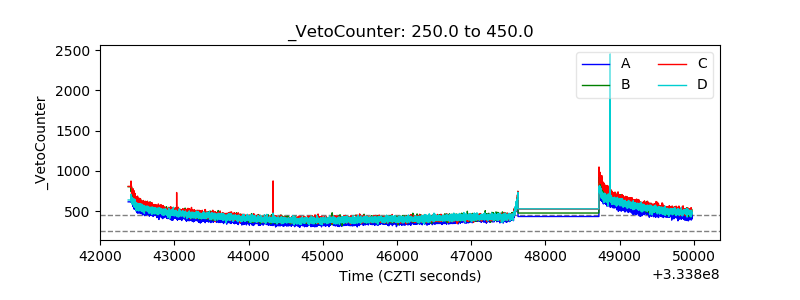 |