| Param | Original file | Final file |
|---|---|---|
| Filename | modeM0/AS1A09_138T04_9000003776_26169cztM0_level2.evt | modeM0/AS1A09_138T04_9000003776_26169cztM0_level2_quad_clean.evt |
| Size (bytes) | 476,432,640 | 119,018,880 |
| Size | 454.4 MB | 113.5 MB |
| Events in quadrant A | 3,285,831 | 788,853 |
| Events in quadrant B | 3,332,797 | 820,639 |
| Events in quadrant C | 3,956,388 | 783,047 |
| Events in quadrant D | 3,431,740 | 778,297 |
| Mode M9 | |||
|---|---|---|---|
| Quadrant | BADHDUFLAG | Total packets | Discarded packets |
| A | 0 | 13 | 0 |
| B | 0 | 14 | 0 |
| C | 0 | 14 | 0 |
| D | 0 | 14 | 0 |
| Mode M0 | |||
|---|---|---|---|
| Quadrant | BADHDUFLAG | Total packets | Discarded packets |
| A | 0 | 13593 | 0 |
| B | 0 | 13780 | 0 |
| C | 0 | 15744 | 0 |
| D | 0 | 14183 | 0 |
| Quadrant | Total seconds | Saturated seconds | Saturation percentage |
|---|---|---|---|
| A | 6219 | 23 | 0.369834% |
| B | 6219 | 41 | 0.659270% |
| C | 6219 | 235 | 3.778743% |
| D | 6219 | 30 | 0.482393% |
Noise dominated data is calculated using 1-second bins in cleaned event files. If a bin has >2000 counts, and if more than 50% of those come from <1% of pixels, then it is considered to be noise-dominated and hence unusable.
| Quadrant | # 1 sec bins | Bins with >0 counts | Bins with >2000 counts | High rate bins dominated by noise | Noise dominated (total time) | Noise dominated (detector-on time) | Marked lightcurve |
|---|---|---|---|---|---|---|---|
| A | 7539 | 6218 | 0 | 0 | 0.00% | 0.00% | 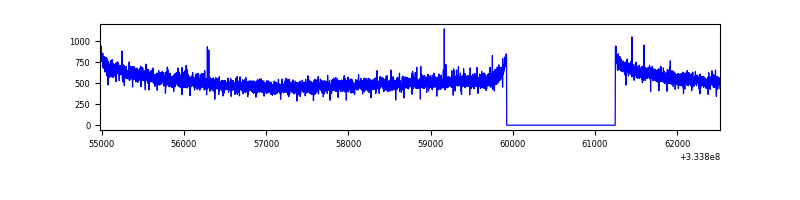 |
| B | 7539 | 6218 | 2 | 2 | 0.03% | 0.03% | 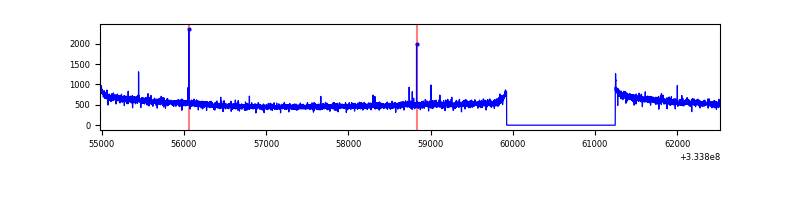 |
| C | 7539 | 6218 | 68 | 68 | 0.90% | 1.09% | 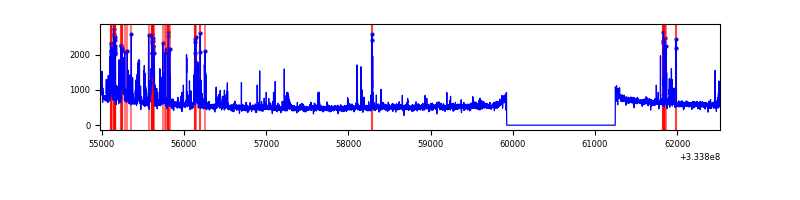 |
| D | 7539 | 6218 | 5 | 5 | 0.07% | 0.08% | 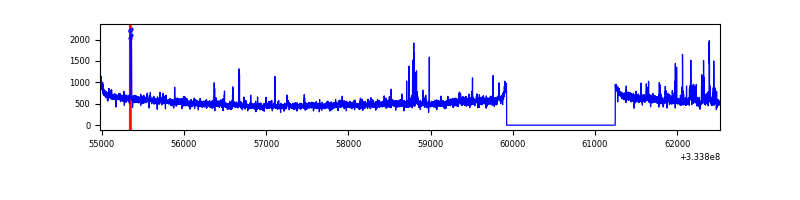 |
Top three noisy pixels from each quadrant. If the there are fewer than three noisy pixels in the level2.evt file, extra rows are filled as -1
| Pixel properties | Quadrant properties | ||||||
|---|---|---|---|---|---|---|---|
| Quadrant | DetID | PixID | Counts | Sigma | Mean | Median | Sigma |
| A | 6 | 16 | 18961 | 109.55 | 845 | 830 | 165.5 |
| A | 13 | 254 | 10783 | 60.14 | 845 | 830 | 165.5 |
| A | 0 | 13 | 9835 | 54.41 | 845 | 830 | 165.5 |
| B | 12 | 111 | 18527 | 112.01 | 847 | 826 | 158.0 |
| B | 11 | 111 | 16636 | 100.04 | 847 | 826 | 158.0 |
| B | 14 | 111 | 15027 | 89.86 | 847 | 826 | 158.0 |
| C | 2 | 16 | 534921 | 2760.22 | 833 | 841 | 193.5 |
| C | 14 | 238 | 134460 | 690.57 | 833 | 841 | 193.5 |
| C | 3 | 233 | 39537 | 199.99 | 833 | 841 | 193.5 |
| D | 1 | 52 | 184272 | 922.45 | 843 | 826 | 198.9 |
| D | 2 | 234 | 25028 | 121.7 | 843 | 826 | 198.9 |
| D | 13 | 238 | 19477 | 93.79 | 843 | 826 | 198.9 |
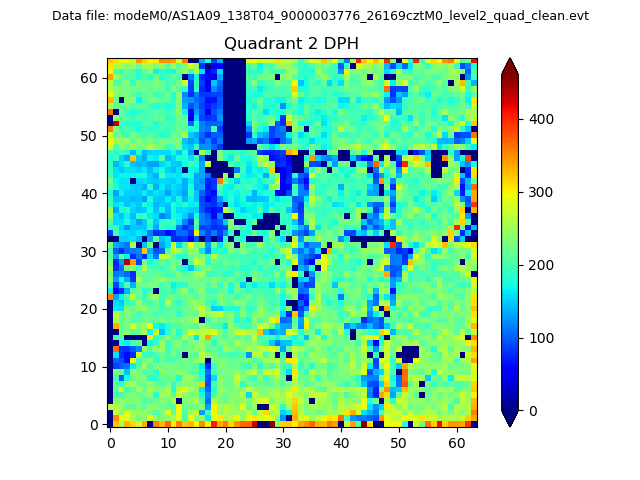
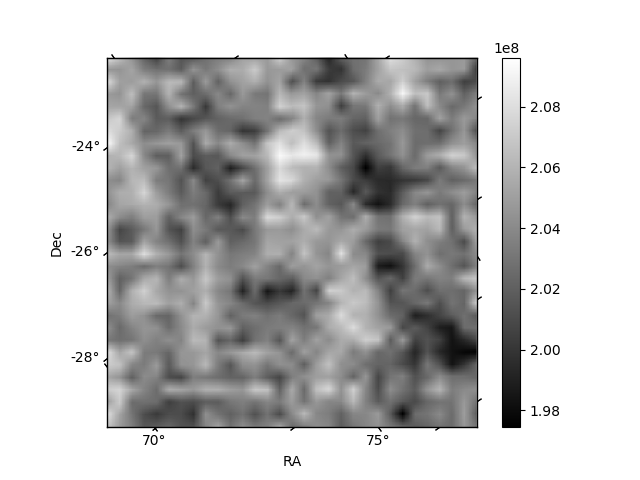
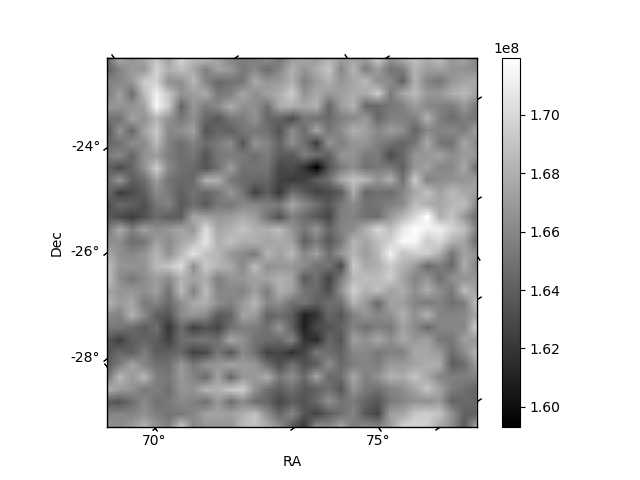
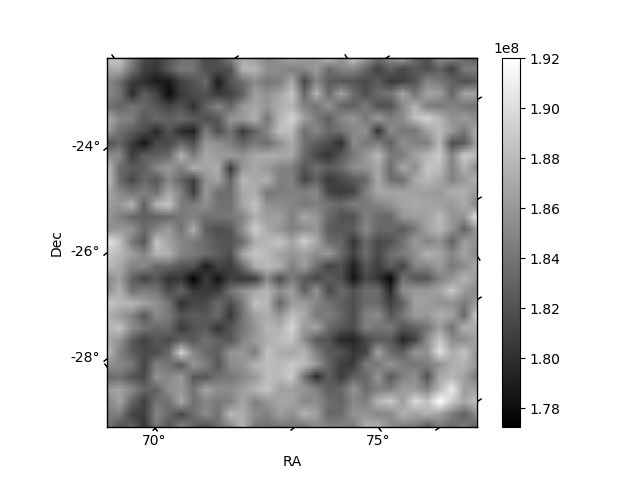
Histogram calculated using DETX and DETY for each event in the final _common_clean file
| Quadrant A |  |
 |
Quadrant B |
|---|---|---|---|
| Quadrant D | 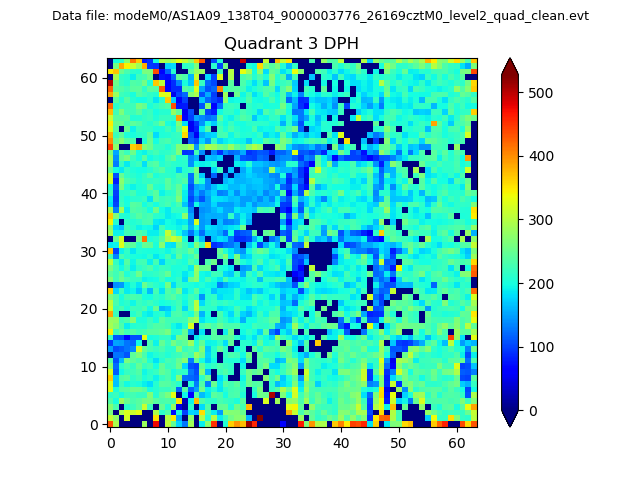 |
 |
Quadrant C |
| Plot type | Count rate plots | Images |
|---|---|---|
| Comparison with Poisson distribution Blue bars denote a histogram of data divided into 1 sec bins. Red curve is a Poisson curve with rate = median count rate of data. |
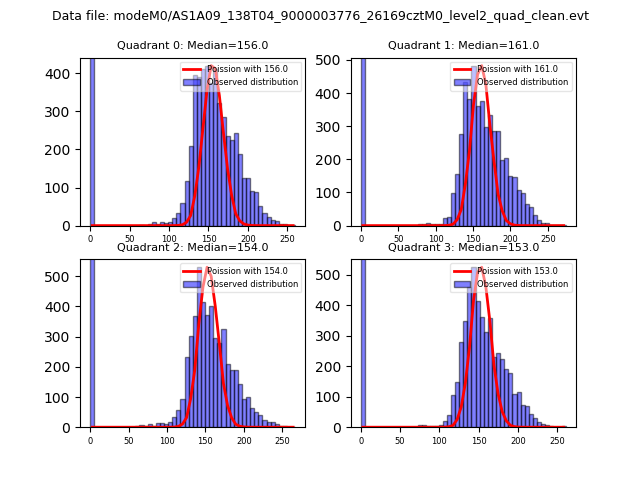 |
 |
| Quadrant-wise count rates Data is divided into 100 sec bins |
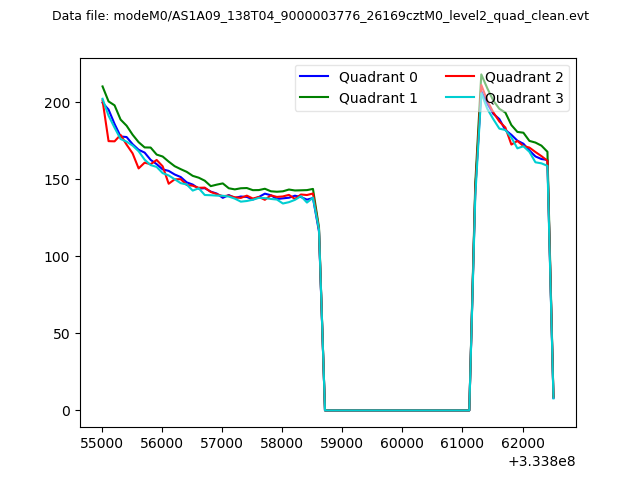 |
|
| Module-wise count rates for Quadrant A Data is divided into 100 sec bins |
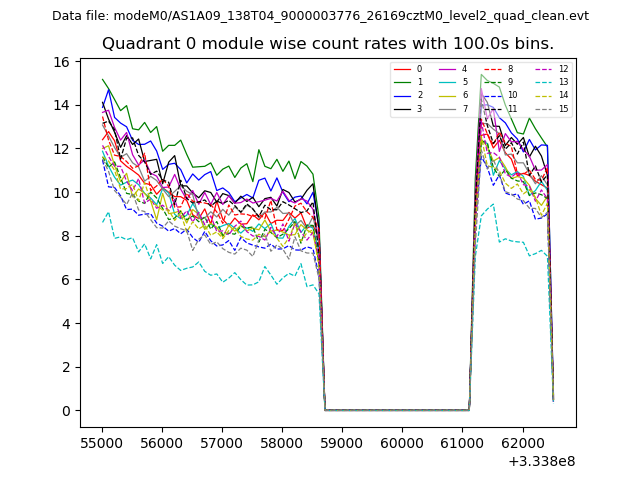 |
 |
| Module-wise count rates for Quadrant B Data is divided into 100 sec bins |
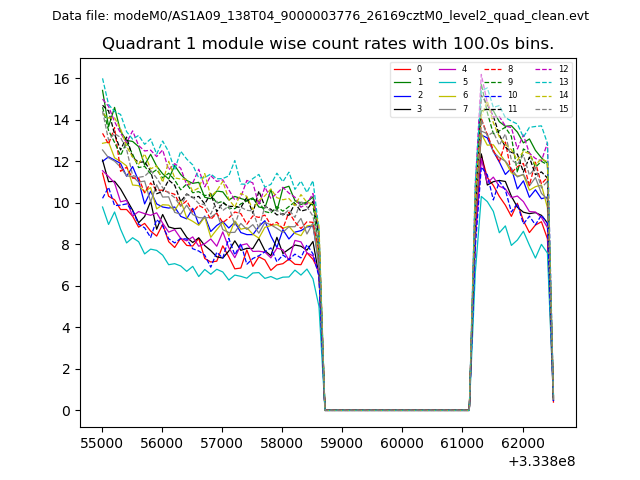 |
 |
| Module-wise count rates for Quadrant C Data is divided into 100 sec bins |
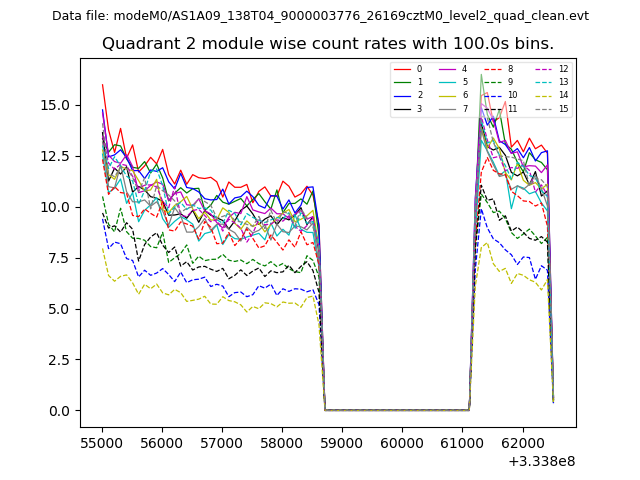 |
 |
| Module-wise count rates for Quadrant D Data is divided into 100 sec bins |
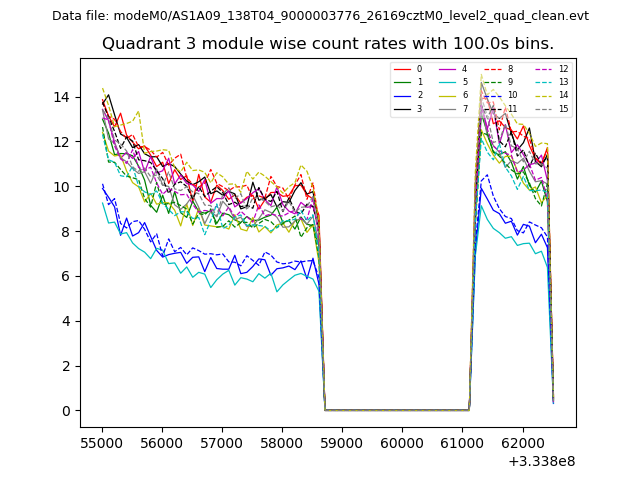 |
 |
| Parameter | Plot |
|---|---|
| CZT HV Monitor | 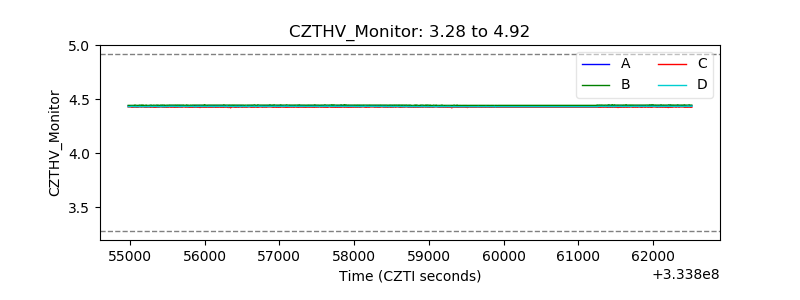 |
| D_VDD | 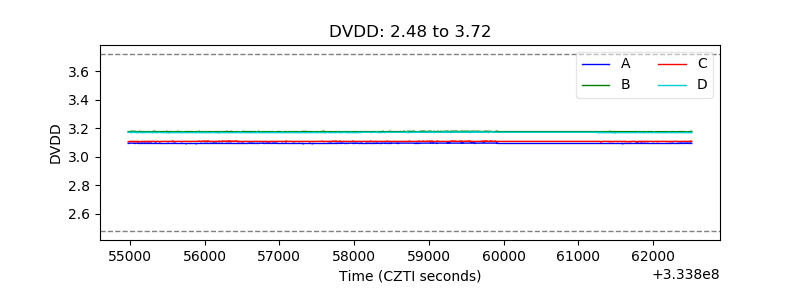 |
| Temperature 1 | 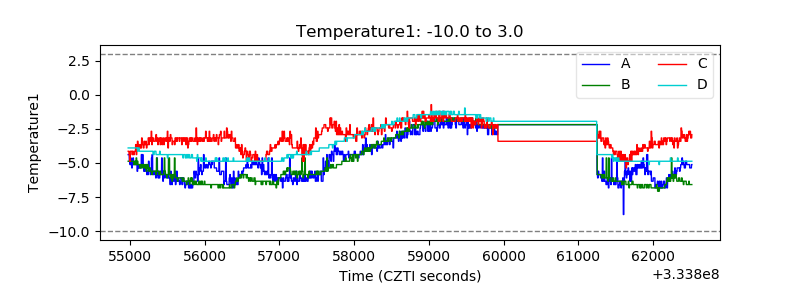 |
| Veto HV Monitor | 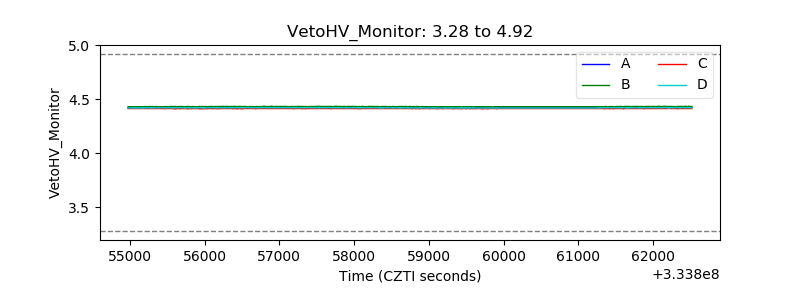 |
| Veto LLD | 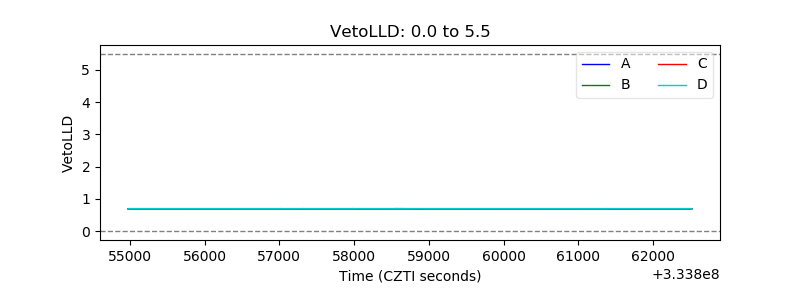 |
| Alpha Counter | 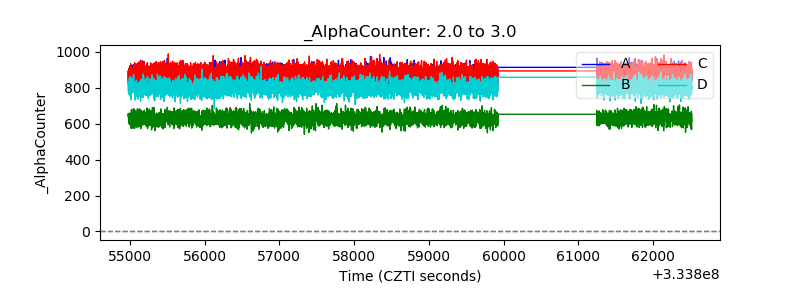 |
| _CPM_Rate |  |
| CZT Counter | 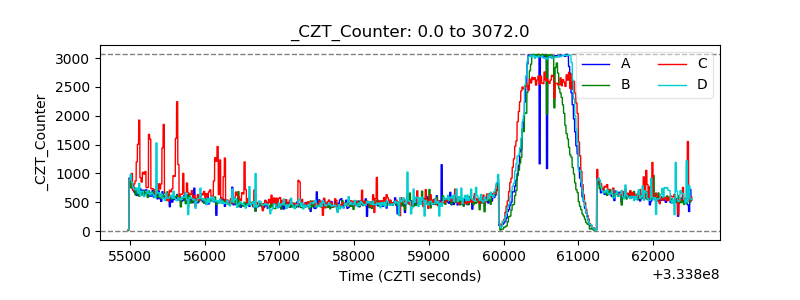 |
| +2.5 Volts monitor | 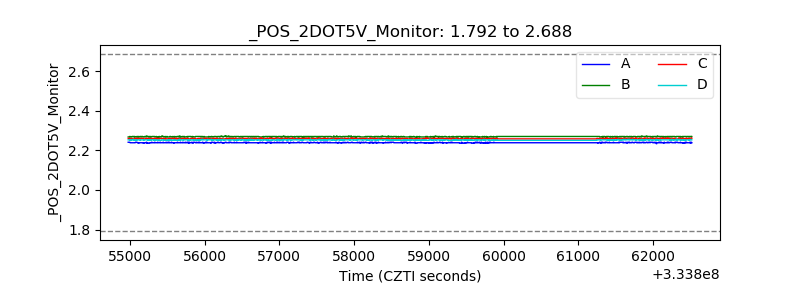 |
| +5 Volts monitor | 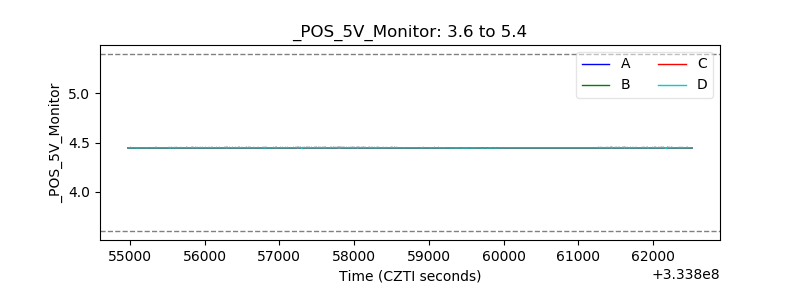 |
| _ROLL_ROT | 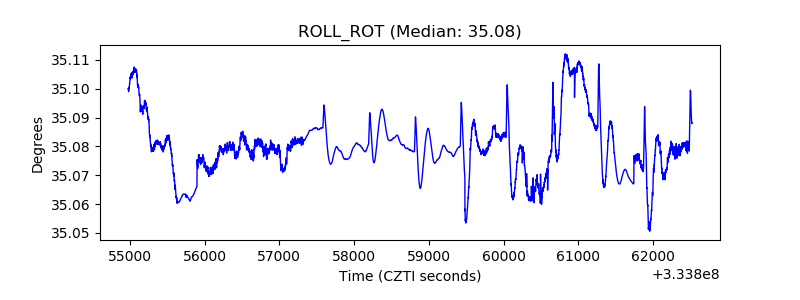 |
| _Roll_DEC |  |
| _Roll_RA | 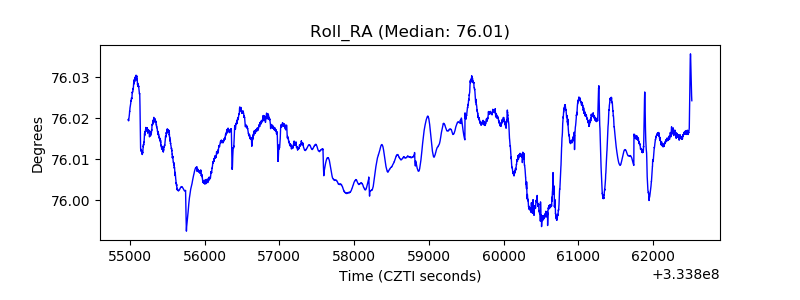 |
| Veto Counter | 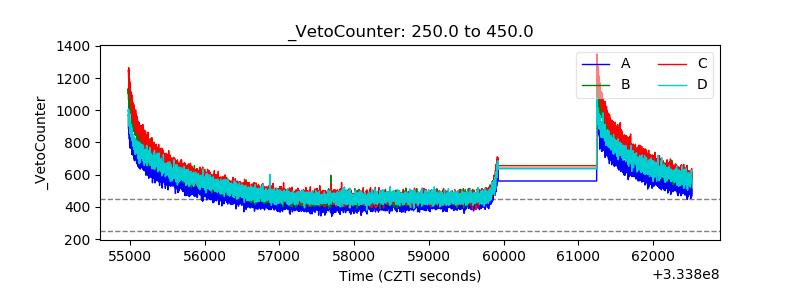 |