| Param | Original file | Final file |
|---|---|---|
| Filename | modeM0/AS1A09_138T04_9000003776_26170cztM0_level2.evt | modeM0/AS1A09_138T04_9000003776_26170cztM0_level2_quad_clean.evt |
| Size (bytes) | 476,049,600 | 113,590,080 |
| Size | 454.0 MB | 108.3 MB |
| Events in quadrant A | 3,240,403 | 749,158 |
| Events in quadrant B | 3,308,830 | 779,159 |
| Events in quadrant C | 3,869,451 | 747,131 |
| Events in quadrant D | 3,583,965 | 738,398 |
| Mode M9 | |||
|---|---|---|---|
| Quadrant | BADHDUFLAG | Total packets | Discarded packets |
| A | 0 | 14 | 0 |
| B | 0 | 14 | 0 |
| C | 0 | 14 | 0 |
| D | 0 | 14 | 0 |
| Mode M0 | |||
|---|---|---|---|
| Quadrant | BADHDUFLAG | Total packets | Discarded packets |
| A | 0 | 13292 | 0 |
| B | 0 | 13565 | 0 |
| C | 0 | 15478 | 0 |
| D | 0 | 14543 | 0 |
| Quadrant | Total seconds | Saturated seconds | Saturation percentage |
|---|---|---|---|
| A | 6109 | 18 | 0.294647% |
| B | 6109 | 34 | 0.556556% |
| C | 6109 | 191 | 3.126535% |
| D | 6109 | 35 | 0.572925% |
Noise dominated data is calculated using 1-second bins in cleaned event files. If a bin has >2000 counts, and if more than 50% of those come from <1% of pixels, then it is considered to be noise-dominated and hence unusable.
| Quadrant | # 1 sec bins | Bins with >0 counts | Bins with >2000 counts | High rate bins dominated by noise | Noise dominated (total time) | Noise dominated (detector-on time) | Marked lightcurve |
|---|---|---|---|---|---|---|---|
| A | 7514 | 6110 | 0 | 0 | 0.00% | 0.00% | 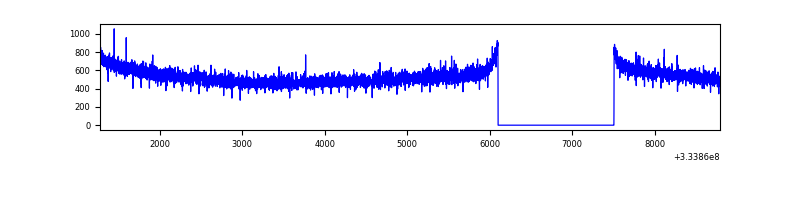 |
| B | 7514 | 6109 | 1 | 1 | 0.01% | 0.02% | 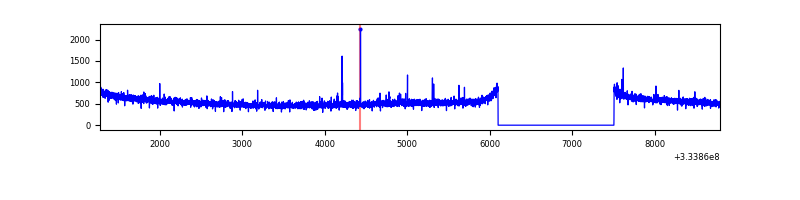 |
| C | 7514 | 6109 | 81 | 81 | 1.08% | 1.33% | 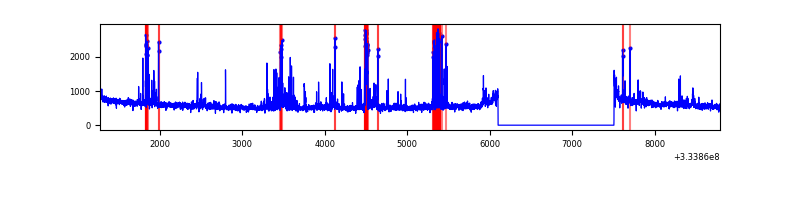 |
| D | 7514 | 6109 | 20 | 20 | 0.27% | 0.33% | 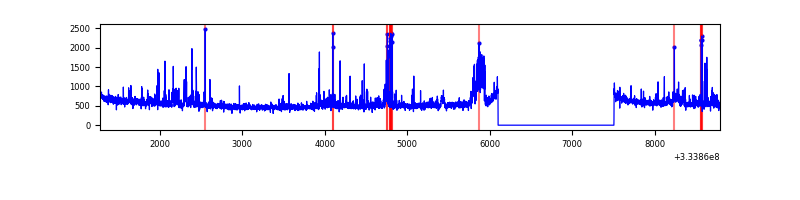 |
Top three noisy pixels from each quadrant. If the there are fewer than three noisy pixels in the level2.evt file, extra rows are filled as -1
| Pixel properties | Quadrant properties | ||||||
|---|---|---|---|---|---|---|---|
| Quadrant | DetID | PixID | Counts | Sigma | Mean | Median | Sigma |
| A | 13 | 254 | 10183 | 56.87 | 837 | 823 | 164.6 |
| A | 0 | 226 | 7098 | 38.13 | 837 | 823 | 164.6 |
| A | 3 | 137 | 7077 | 38.0 | 837 | 823 | 164.6 |
| B | 12 | 111 | 18230 | 111.82 | 841 | 822 | 155.7 |
| B | 11 | 111 | 15906 | 96.89 | 841 | 822 | 155.7 |
| B | 14 | 111 | 14721 | 89.28 | 841 | 822 | 155.7 |
| C | 2 | 16 | 443904 | 2321.04 | 827 | 835 | 190.9 |
| C | 14 | 238 | 136513 | 710.76 | 827 | 835 | 190.9 |
| C | 3 | 233 | 64522 | 333.63 | 827 | 835 | 190.9 |
| D | 1 | 52 | 402290 | 2045.06 | 837 | 821 | 196.3 |
| D | 2 | 234 | 24881 | 122.56 | 837 | 821 | 196.3 |
| D | 8 | 195 | 12028 | 57.09 | 837 | 821 | 196.3 |
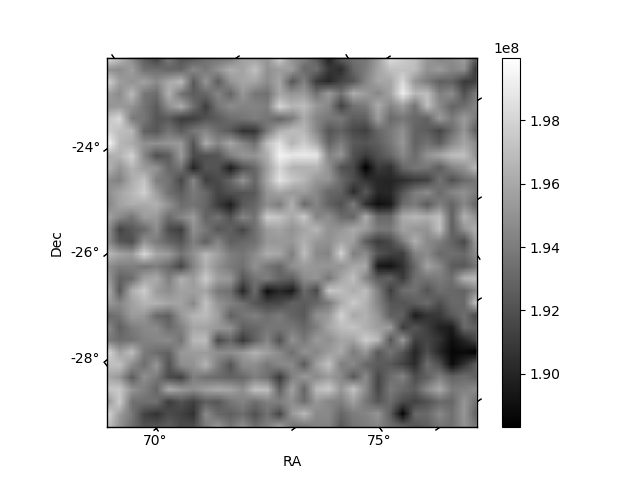
Histogram calculated using DETX and DETY for each event in the final _common_clean file
| Quadrant A | 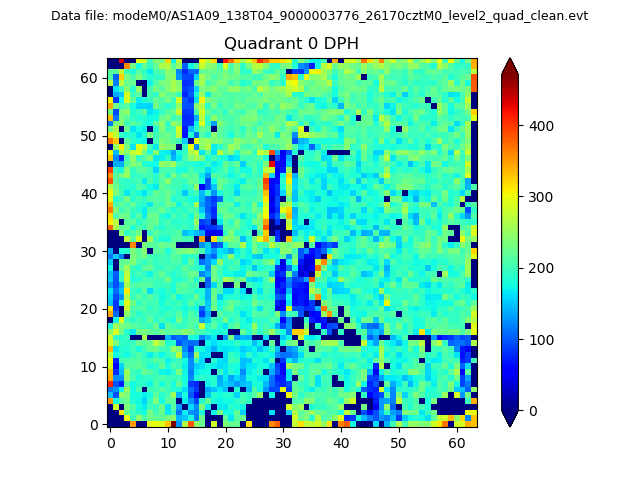 |
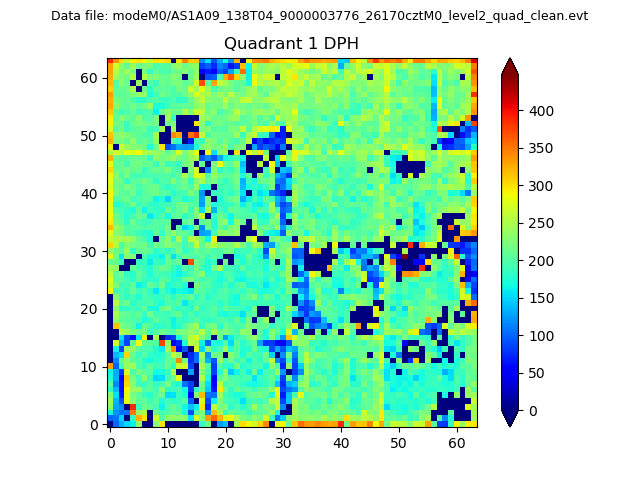 |
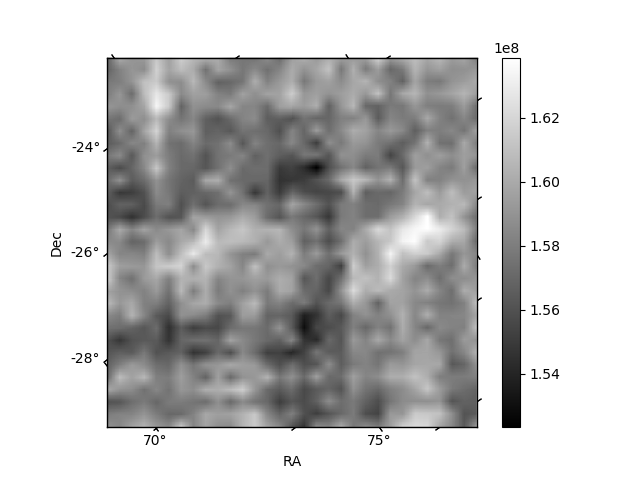
Quadrant B |
|---|---|---|---|
| Quadrant D | 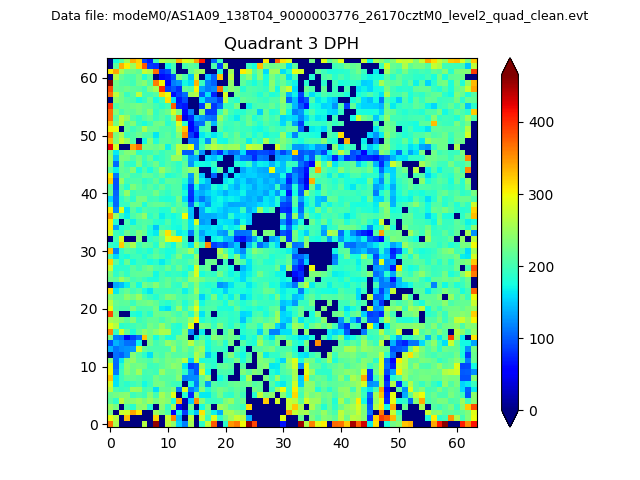 |
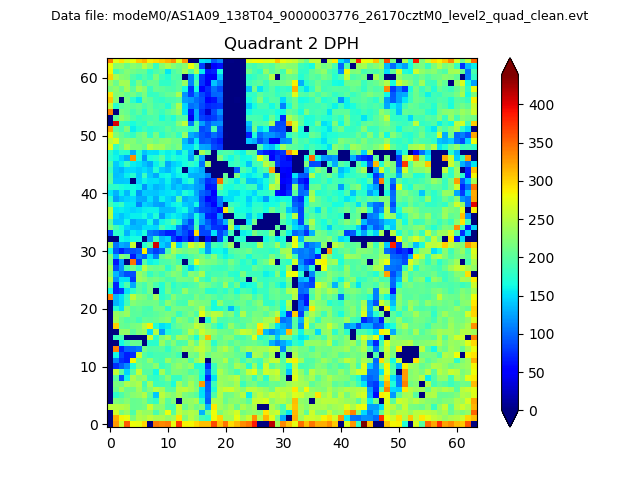 |
Quadrant C |
| Plot type | Count rate plots | Images |
|---|---|---|
| Comparison with Poisson distribution Blue bars denote a histogram of data divided into 1 sec bins. Red curve is a Poisson curve with rate = median count rate of data. |
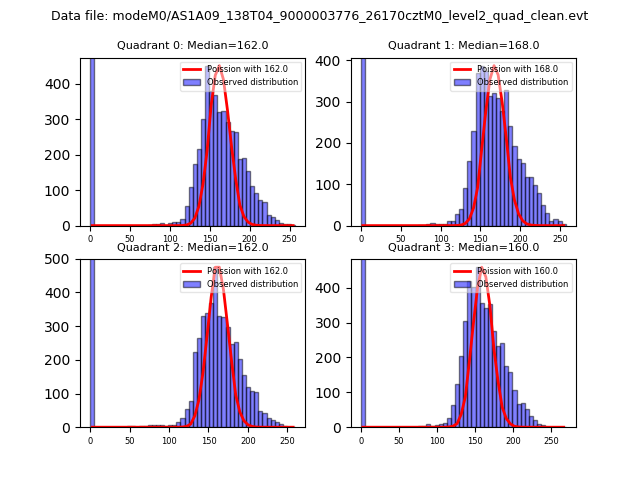 |
 |
| Quadrant-wise count rates Data is divided into 100 sec bins |
 |
|
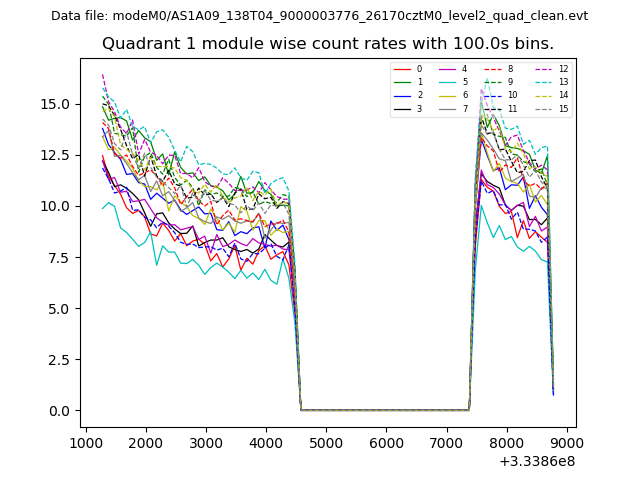
| Module-wise count rates for Quadrant A Data is divided into 100 sec bins |
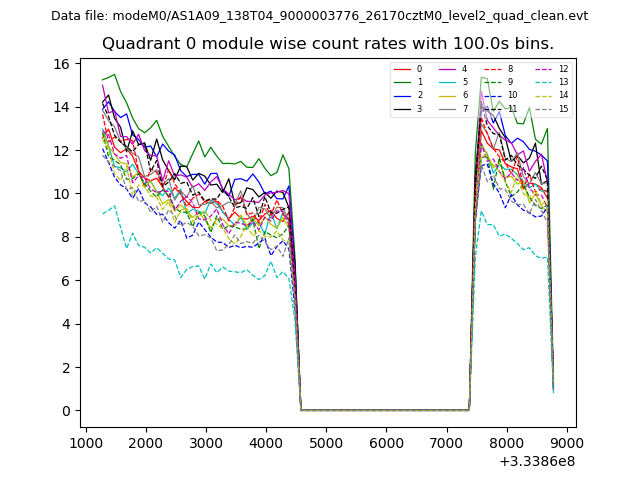 |
 |
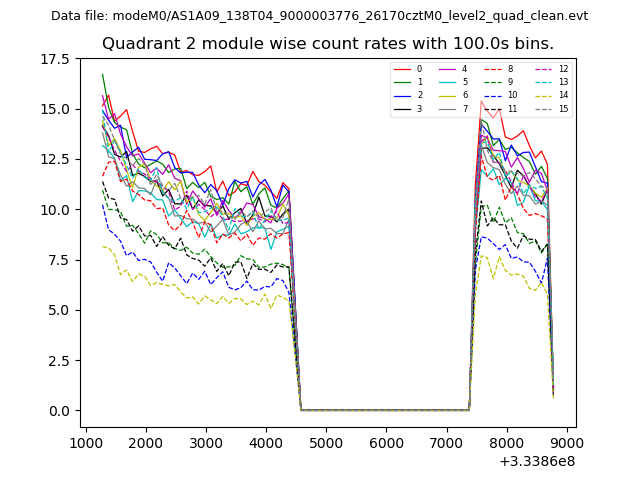
| Module-wise count rates for Quadrant B Data is divided into 100 sec bins |
 |
 |
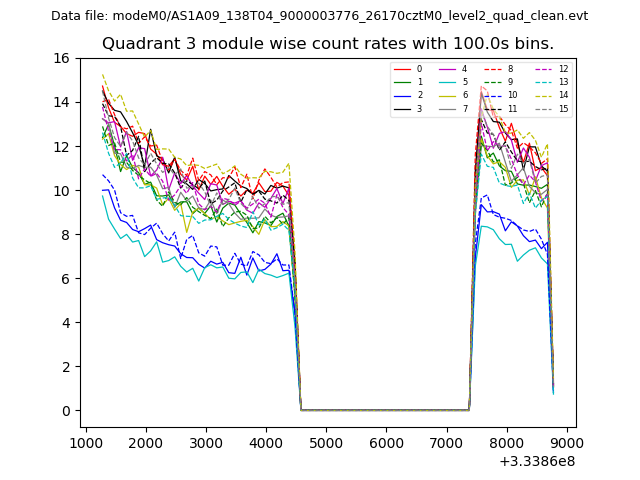
| Module-wise count rates for Quadrant C Data is divided into 100 sec bins |
 |
 |
| Module-wise count rates for Quadrant D Data is divided into 100 sec bins |
 |
 |
| Parameter | Plot |
|---|---|
| CZT HV Monitor | 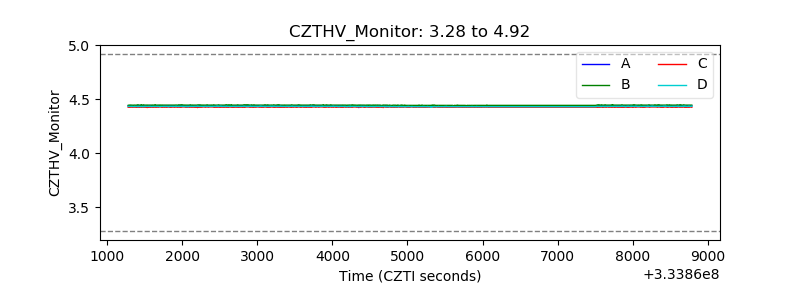 |
| D_VDD | 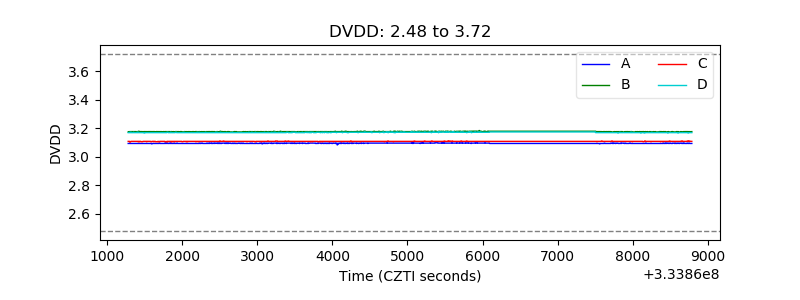 |
| Temperature 1 | 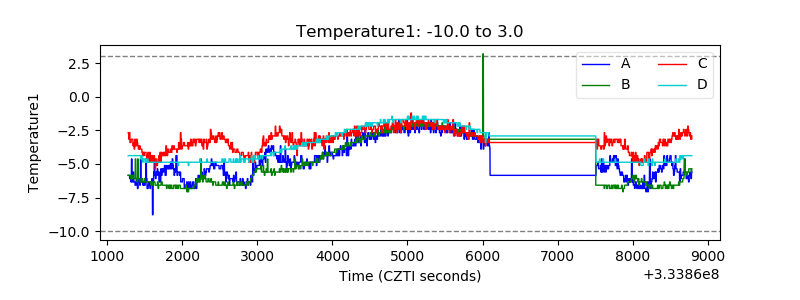 |
| Veto HV Monitor | 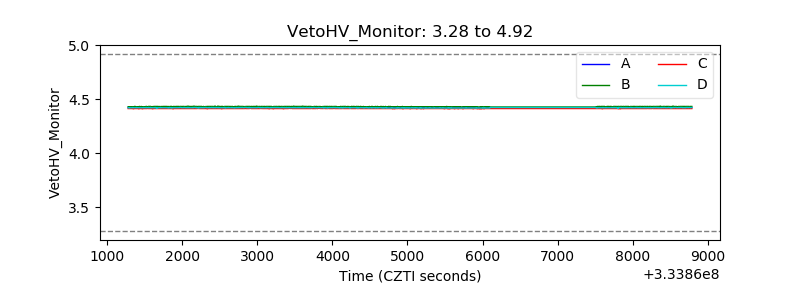 |
| Veto LLD | 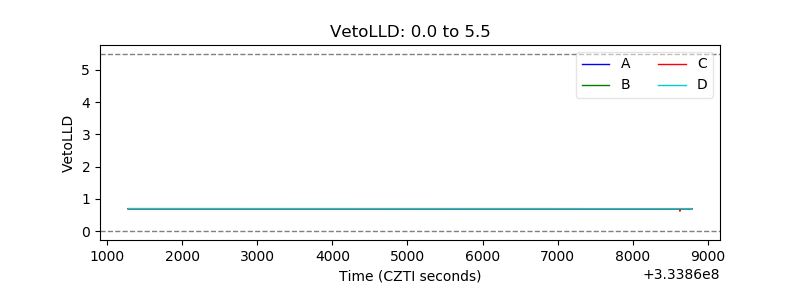 |
| Alpha Counter |  |
| _CPM_Rate | 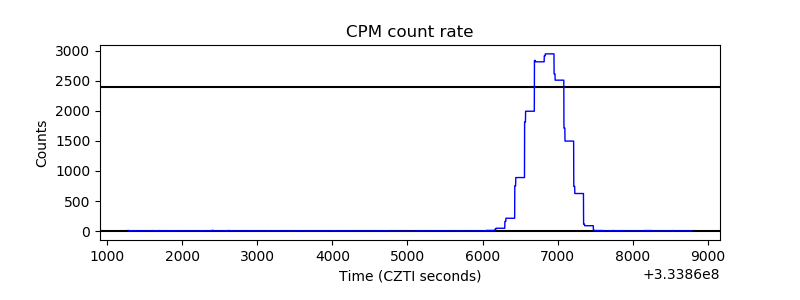 |
| CZT Counter | 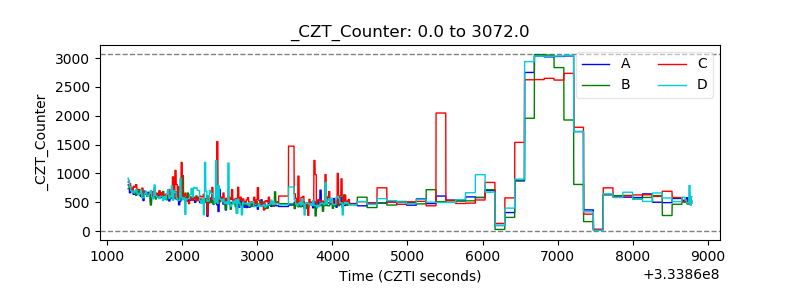 |
| +2.5 Volts monitor |  |
| +5 Volts monitor |  |
| _ROLL_ROT | 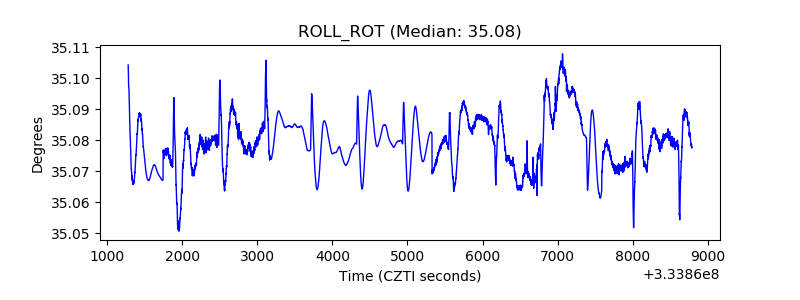 |
| _Roll_DEC | 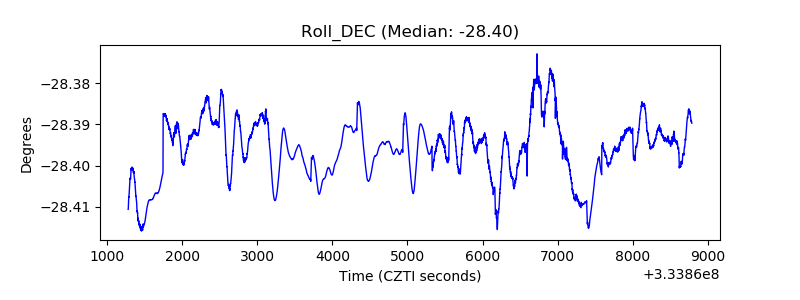 |
| _Roll_RA | 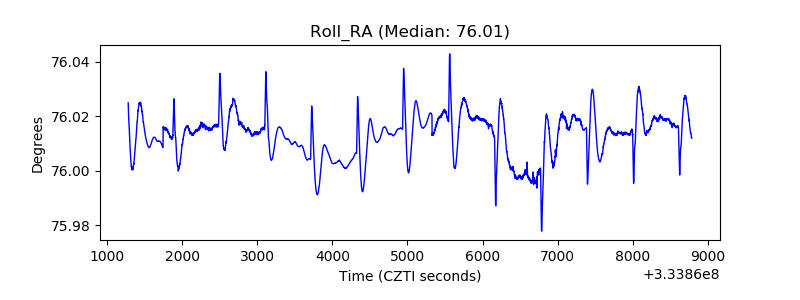 |
| Veto Counter | 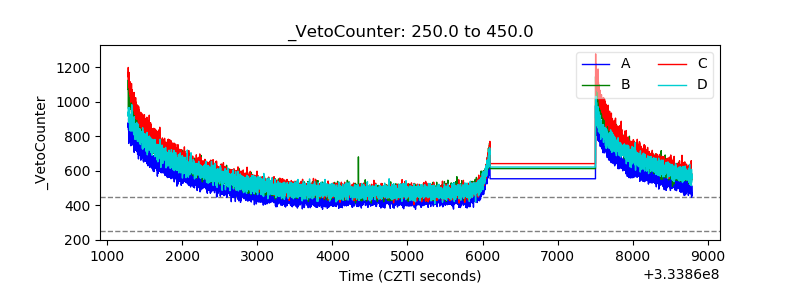 |