| Param | Original file | Final file |
|---|---|---|
| Filename | modeM0/AS1A09_138T04_9000003776_26171cztM0_level2.evt | modeM0/AS1A09_138T04_9000003776_26171cztM0_level2_quad_clean.evt |
| Size (bytes) | 195,373,440 | 61,801,920 |
| Size | 186.3 MB | 58.9 MB |
| Events in quadrant A | 1,333,598 | 419,688 |
| Events in quadrant B | 1,365,336 | 435,871 |
| Events in quadrant C | 1,489,964 | 417,331 |
| Events in quadrant D | 1,548,623 | 411,742 |
| Mode M9 | |||
|---|---|---|---|
| Quadrant | BADHDUFLAG | Total packets | Discarded packets |
| A | 0 | 1 | 0 |
| B | 0 | 1 | 0 |
| C | 0 | 1 | 0 |
| D | 0 | 1 | 0 |
| Mode M0 | |||
|---|---|---|---|
| Quadrant | BADHDUFLAG | Total packets | Discarded packets |
| A | 0 | 5518 | 0 |
| B | 0 | 5645 | 0 |
| C | 0 | 6058 | 0 |
| D | 0 | 6216 | 0 |
| Quadrant | Total seconds | Saturated seconds | Saturation percentage |
|---|---|---|---|
| A | 2580 | 4 | 0.155039% |
| B | 2577 | 1 | 0.038805% |
| C | 2570 | 37 | 1.439689% |
| D | 2571 | 10 | 0.388954% |
Noise dominated data is calculated using 1-second bins in cleaned event files. If a bin has >2000 counts, and if more than 50% of those come from <1% of pixels, then it is considered to be noise-dominated and hence unusable.
| Quadrant | # 1 sec bins | Bins with >0 counts | Bins with >2000 counts | High rate bins dominated by noise | Noise dominated (total time) | Noise dominated (detector-on time) | Marked lightcurve |
|---|---|---|---|---|---|---|---|
| A | 3038 | 2674 | 0 | 0 | 0.00% | 0.00% | 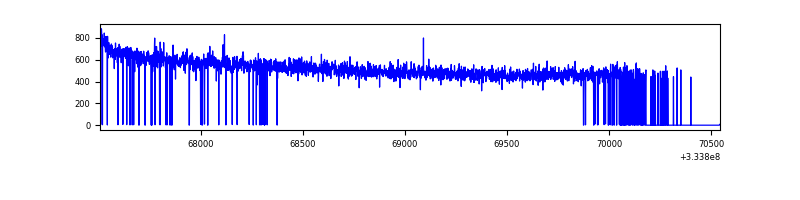 |
| B | 2795 | 2671 | 0 | 0 | 0.00% | 0.00% | 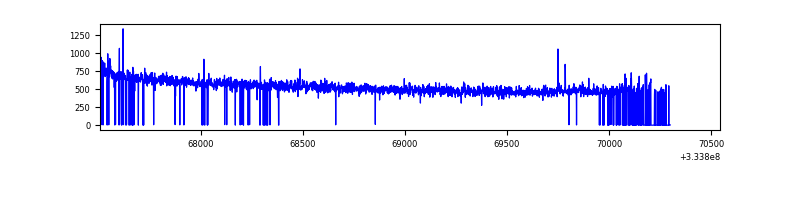 |
| C | 2824 | 2665 | 4 | 4 | 0.14% | 0.15% | 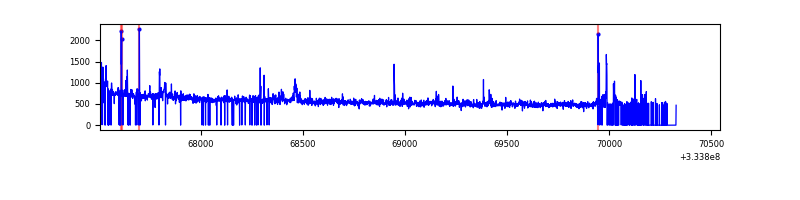 |
| D | 2881 | 2671 | 16 | 16 | 0.56% | 0.60% | 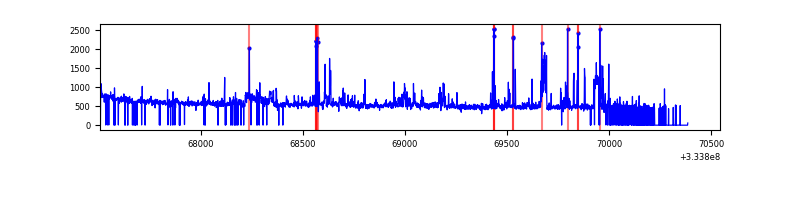 |
Top three noisy pixels from each quadrant. If the there are fewer than three noisy pixels in the level2.evt file, extra rows are filled as -1
| Pixel properties | Quadrant properties | ||||||
|---|---|---|---|---|---|---|---|
| Quadrant | DetID | PixID | Counts | Sigma | Mean | Median | Sigma |
| A | 13 | 254 | 3760 | 49.38 | 345 | 341 | 69.2 |
| A | 0 | 226 | 2927 | 37.35 | 345 | 341 | 69.2 |
| A | 3 | 137 | 2826 | 35.89 | 345 | 341 | 69.2 |
| B | 0 | 230 | 9222 | 136.51 | 347 | 341 | 65.1 |
| B | 12 | 111 | 7289 | 106.8 | 347 | 341 | 65.1 |
| B | 11 | 111 | 6598 | 96.17 | 347 | 341 | 65.1 |
| C | 2 | 16 | 64148 | 786.72 | 344 | 348 | 81.1 |
| C | 14 | 238 | 57603 | 706.01 | 344 | 348 | 81.1 |
| C | 3 | 233 | 23914 | 290.59 | 344 | 348 | 81.1 |
| D | 1 | 52 | 237420 | 2890.0 | 346 | 339 | 82.0 |
| D | 2 | 234 | 9936 | 116.99 | 346 | 339 | 82.0 |
| D | 14 | 35 | 5837 | 67.02 | 346 | 339 | 82.0 |
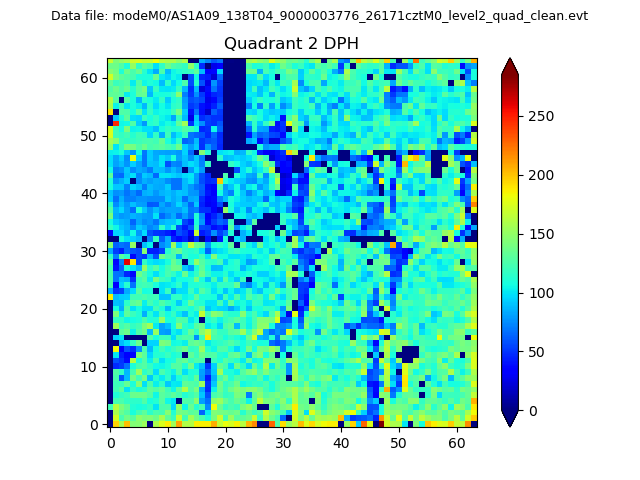
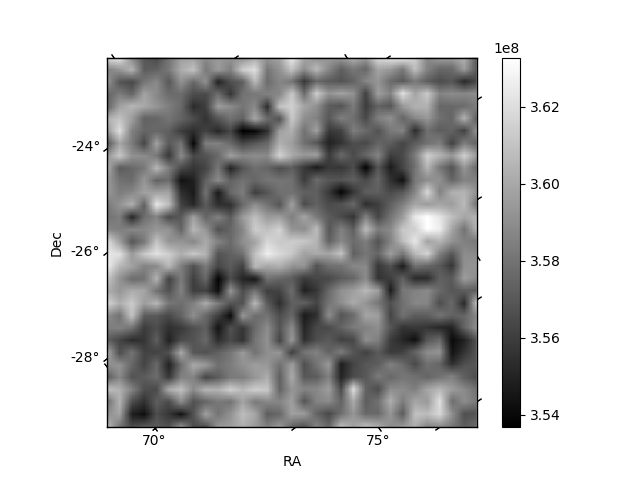
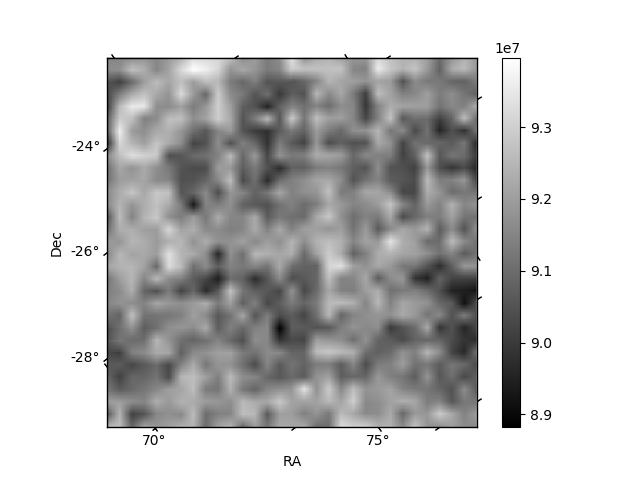
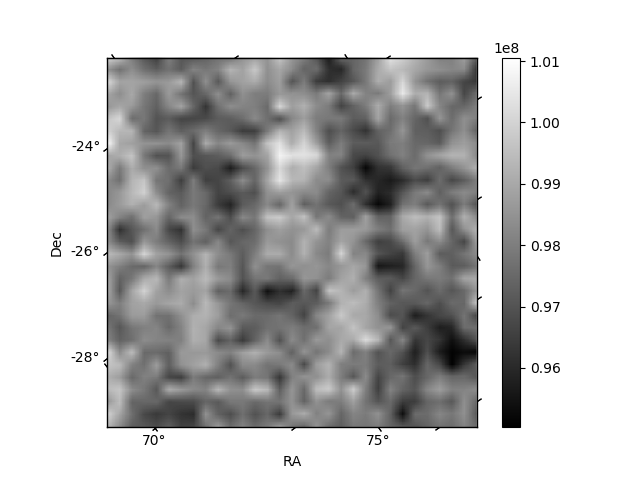
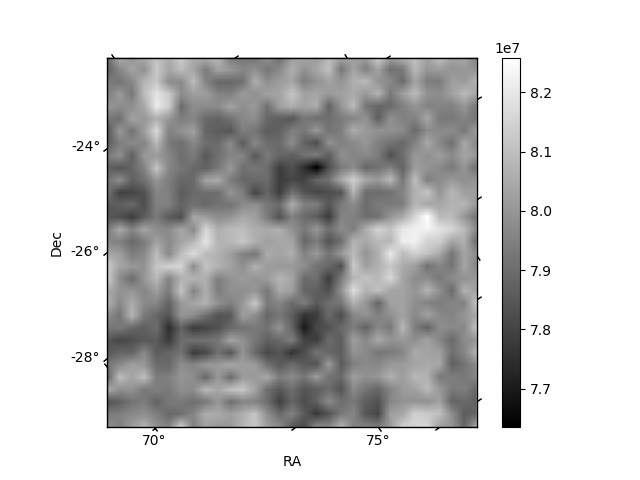
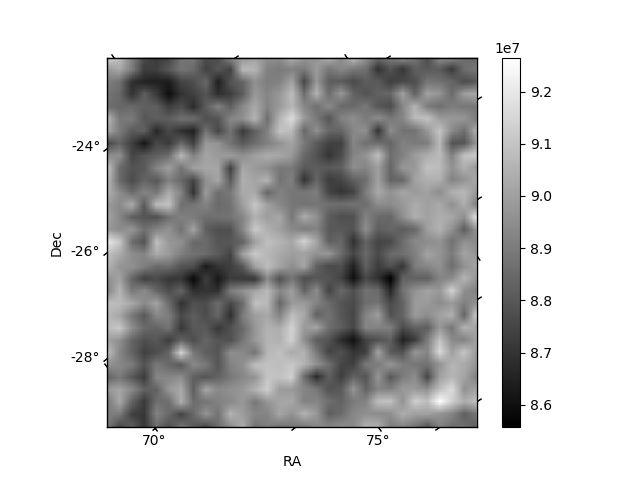
Histogram calculated using DETX and DETY for each event in the final _common_clean file
| Quadrant A | 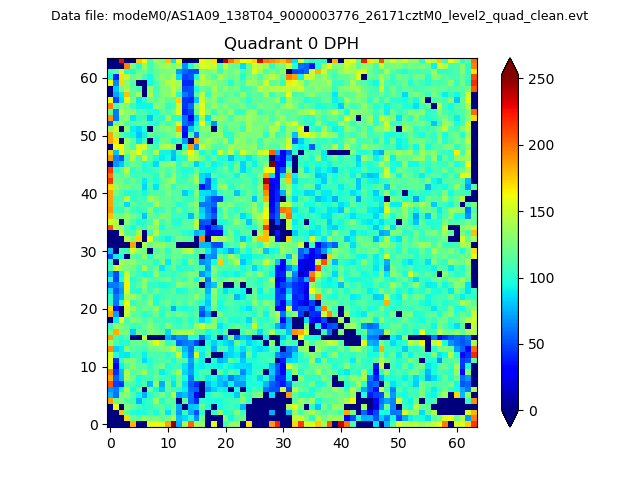 |
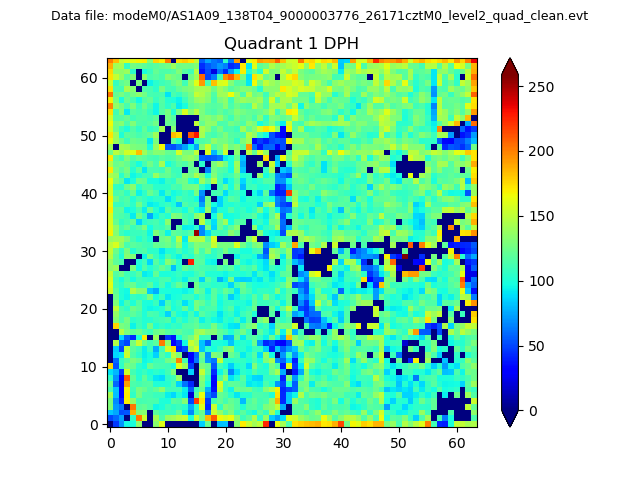 |
Quadrant B |
|---|---|---|---|
| Quadrant D | 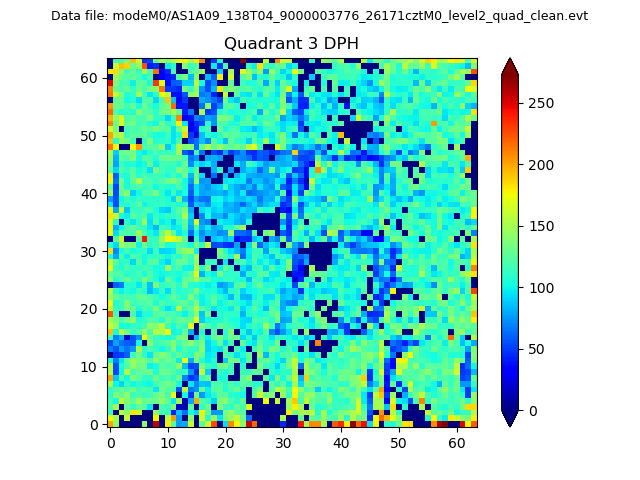 |
 |
Quadrant C |
| Plot type | Count rate plots | Images |
|---|---|---|
| Comparison with Poisson distribution Blue bars denote a histogram of data divided into 1 sec bins. Red curve is a Poisson curve with rate = median count rate of data. |
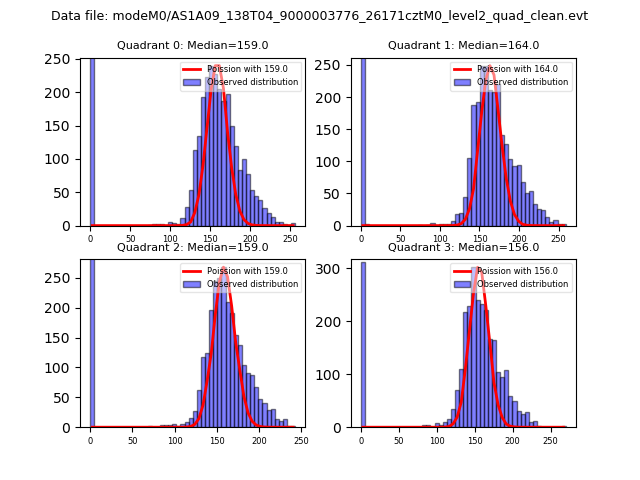 |
 |
| Quadrant-wise count rates Data is divided into 100 sec bins |
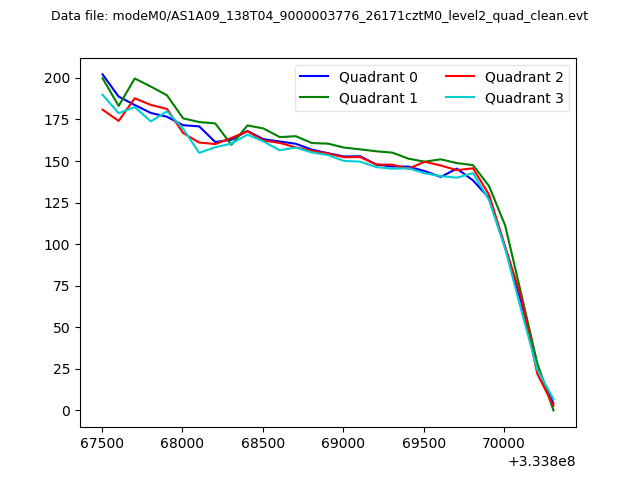 |
|
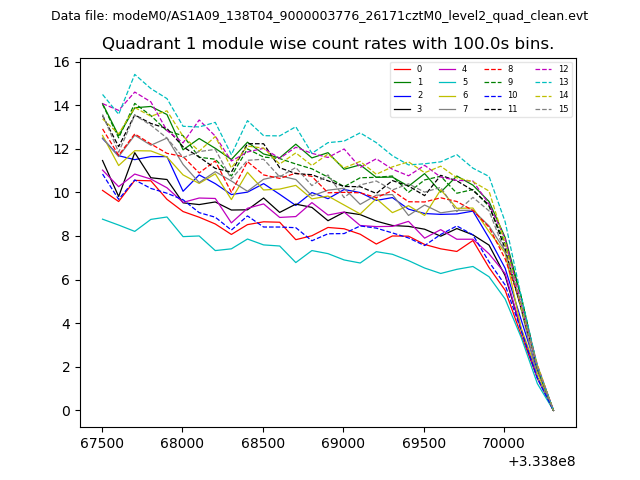
| Module-wise count rates for Quadrant A Data is divided into 100 sec bins |
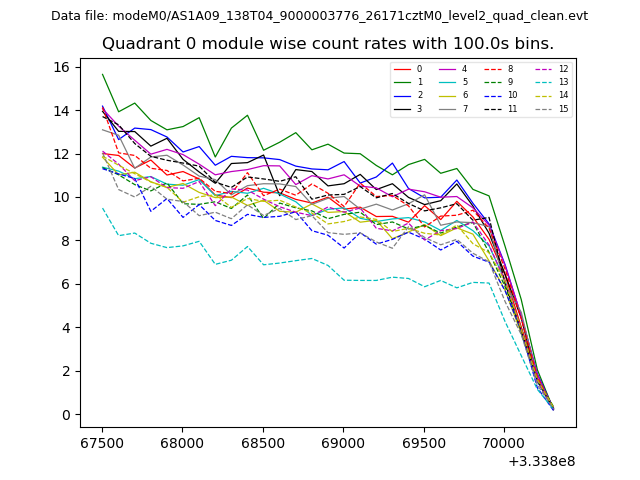 |
 |
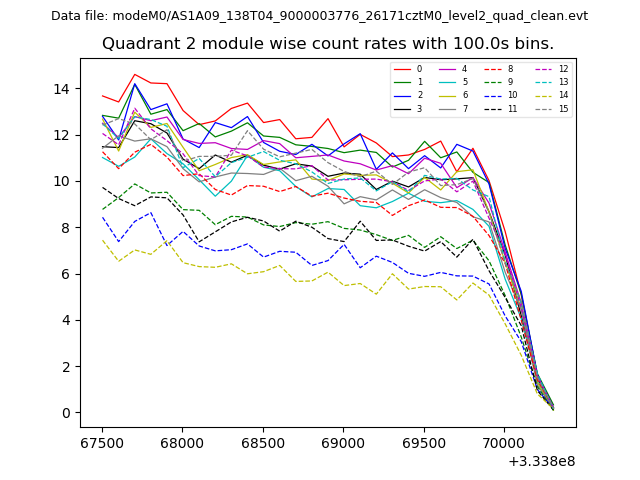
| Module-wise count rates for Quadrant B Data is divided into 100 sec bins |
 |
 |
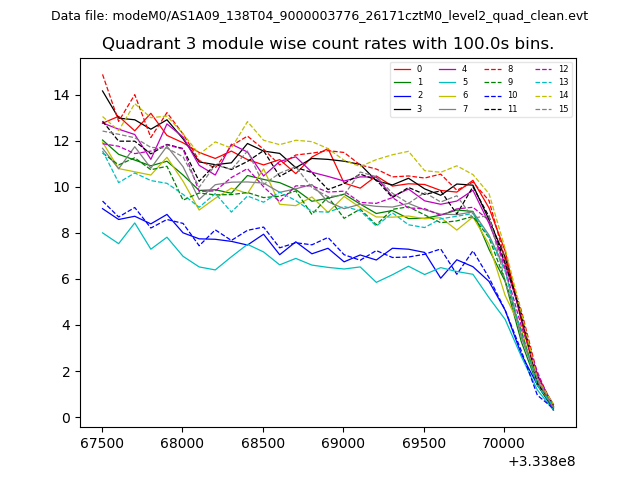
| Module-wise count rates for Quadrant C Data is divided into 100 sec bins |
 |
 |
| Module-wise count rates for Quadrant D Data is divided into 100 sec bins |
 |
 |
| Parameter | Plot |
|---|---|
| CZT HV Monitor | 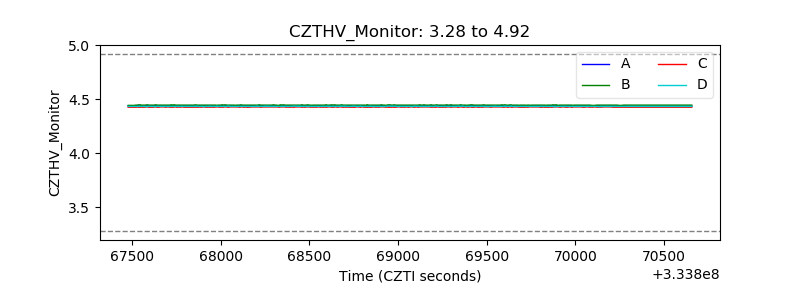 |
| D_VDD | 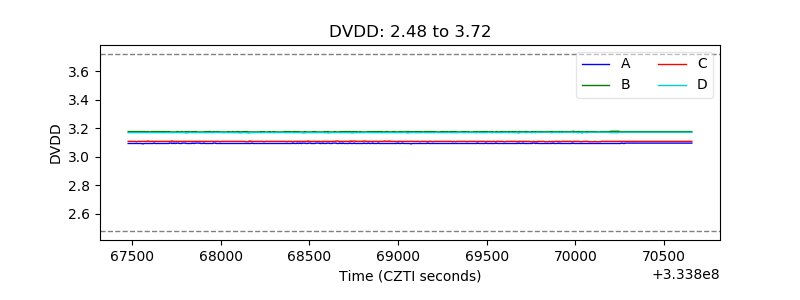 |
| Temperature 1 | 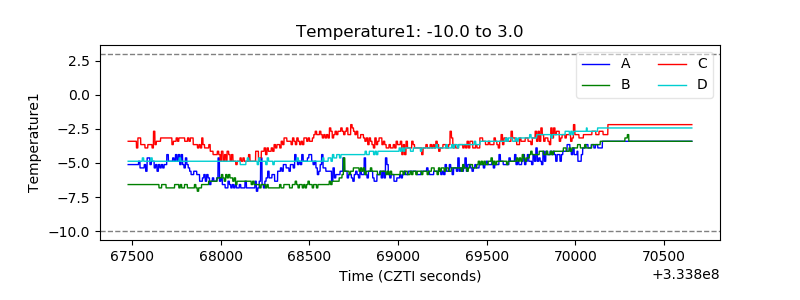 |
| Veto HV Monitor |  |
| Veto LLD | 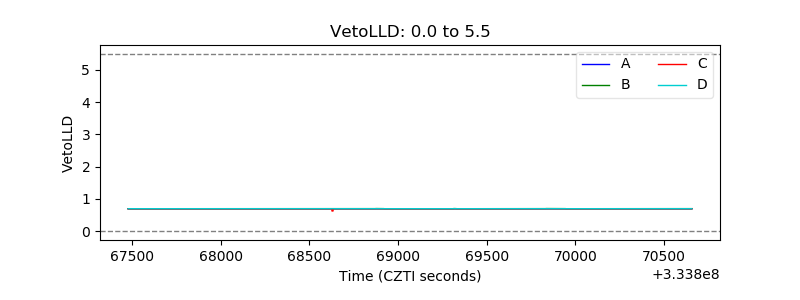 |
| Alpha Counter | 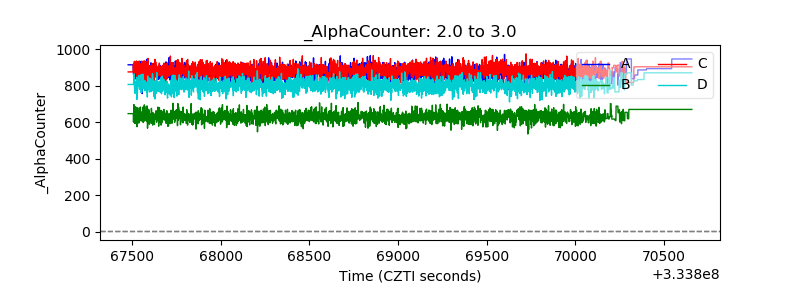 |
| _CPM_Rate | 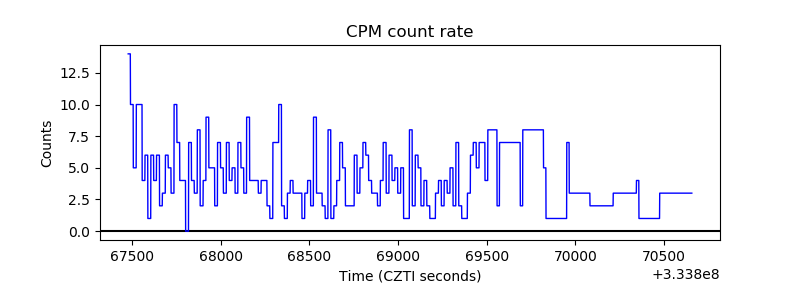 |
| CZT Counter | 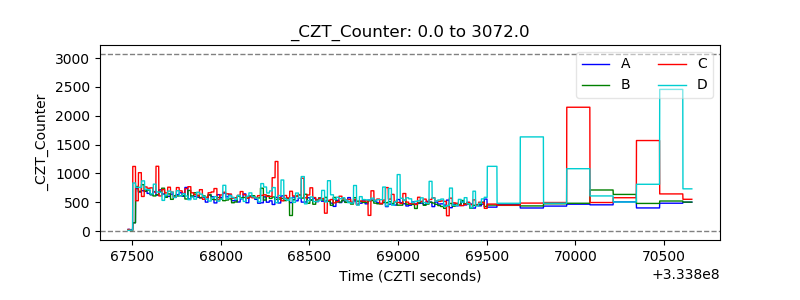 |
| +2.5 Volts monitor | 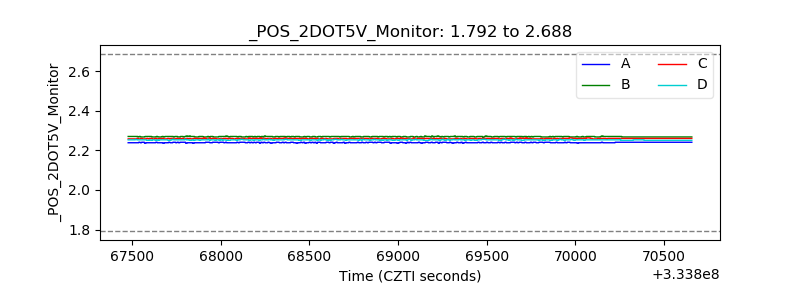 |
| +5 Volts monitor |  |
| _ROLL_ROT | 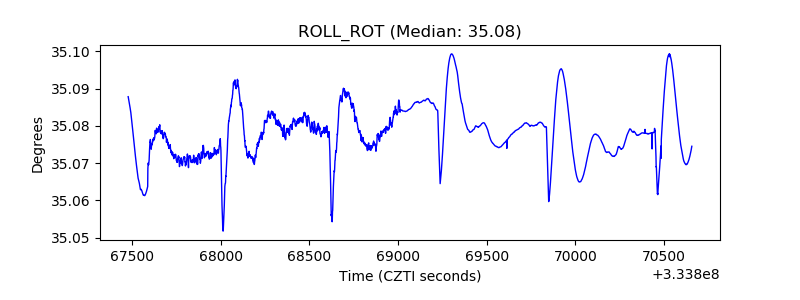 |
| _Roll_DEC | 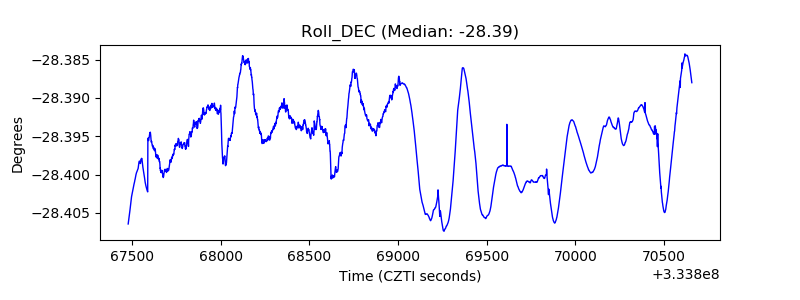 |
| _Roll_RA | 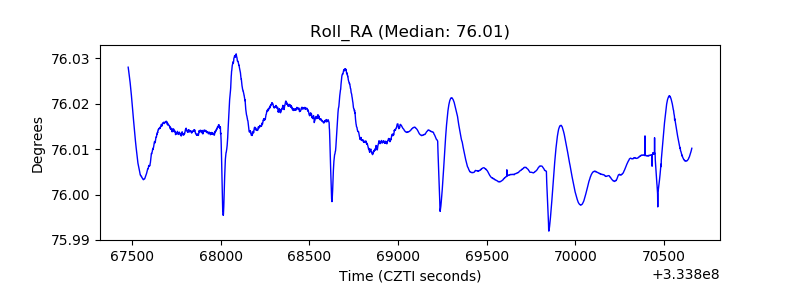 |
| Veto Counter | 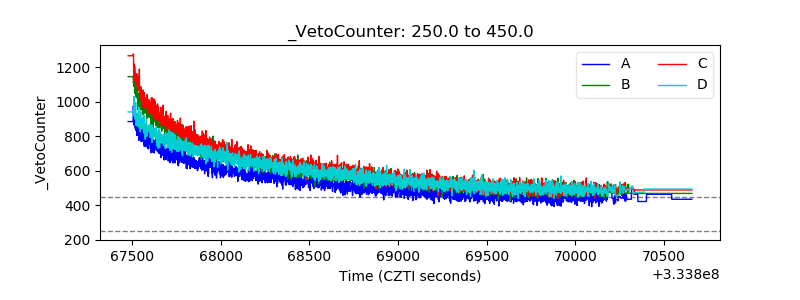 |