| Param | Original file | Final file |
|---|---|---|
| Filename | modeM0/AS1A09_138T04_9000003776_26172cztM0_level2.evt | modeM0/AS1A09_138T04_9000003776_26172cztM0_level2_quad_clean.evt |
| Size (bytes) | 846,846,720 | 161,464,320 |
| Size | 807.6 MB | 154.0 MB |
| Events in quadrant A | 5,590,190 | 1,034,979 |
| Events in quadrant B | 5,651,742 | 1,067,167 |
| Events in quadrant C | 6,838,671 | 1,014,821 |
| Events in quadrant D | 6,826,049 | 1,015,716 |
| Mode M9 | |||
|---|---|---|---|
| Quadrant | BADHDUFLAG | Total packets | Discarded packets |
| A | 0 | 26 | 0 |
| B | 0 | 26 | 0 |
| C | 0 | 26 | 0 |
| D | 0 | 26 | 0 |
| Mode M0 | |||
|---|---|---|---|
| Quadrant | BADHDUFLAG | Total packets | Discarded packets |
| A | 0 | 23013 | 0 |
| B | 0 | 23213 | 0 |
| C | 0 | 26973 | 0 |
| D | 0 | 27147 | 0 |
| Quadrant | Total seconds | Saturated seconds | Saturation percentage |
|---|---|---|---|
| A | 10941 | 90 | 0.822594% |
| B | 10942 | 139 | 1.270334% |
| C | 10942 | 413 | 3.774447% |
| D | 10942 | 208 | 1.900932% |
Noise dominated data is calculated using 1-second bins in cleaned event files. If a bin has >2000 counts, and if more than 50% of those come from <1% of pixels, then it is considered to be noise-dominated and hence unusable.
| Quadrant | # 1 sec bins | Bins with >0 counts | Bins with >2000 counts | High rate bins dominated by noise | Noise dominated (total time) | Noise dominated (detector-on time) | Marked lightcurve |
|---|---|---|---|---|---|---|---|
| A | 13541 | 10942 | 0 | 0 | 0.00% | 0.00% | 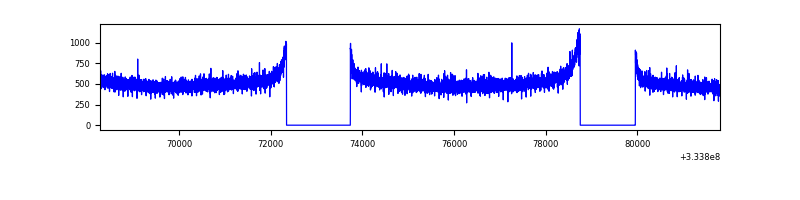 |
| B | 13542 | 10943 | 1 | 1 | 0.01% | 0.01% | 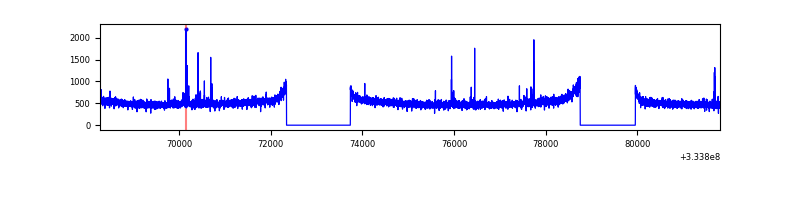 |
| C | 13542 | 10944 | 156 | 156 | 1.15% | 1.43% | 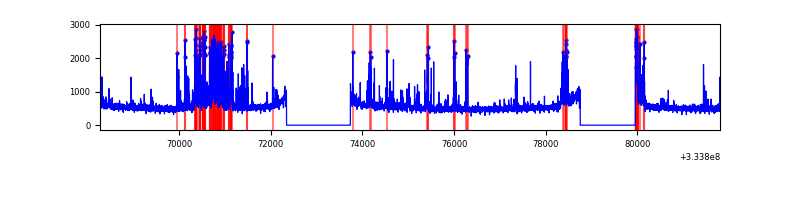 |
| D | 13542 | 10944 | 120 | 120 | 0.89% | 1.10% | 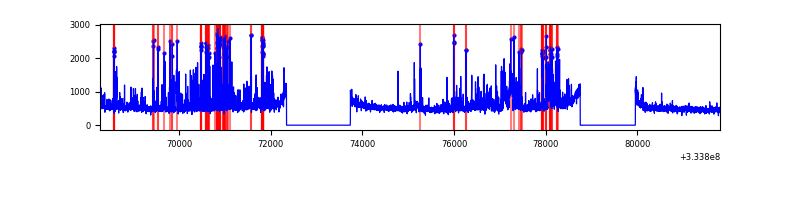 |
Top three noisy pixels from each quadrant. If the there are fewer than three noisy pixels in the level2.evt file, extra rows are filled as -1
| Pixel properties | Quadrant properties | ||||||
|---|---|---|---|---|---|---|---|
| Quadrant | DetID | PixID | Counts | Sigma | Mean | Median | Sigma |
| A | 13 | 254 | 16374 | 52.67 | 1443 | 1416 | 284.0 |
| A | 6 | 16 | 14251 | 45.2 | 1443 | 1416 | 284.0 |
| A | 3 | 137 | 12727 | 39.83 | 1443 | 1416 | 284.0 |
| B | 12 | 111 | 31701 | 112.05 | 1429 | 1393 | 270.5 |
| B | 0 | 230 | 30780 | 108.64 | 1429 | 1393 | 270.5 |
| B | 11 | 111 | 28934 | 101.82 | 1429 | 1393 | 270.5 |
| C | 2 | 16 | 1075394 | 3318.07 | 1388 | 1402 | 323.7 |
| C | 14 | 238 | 224322 | 688.7 | 1388 | 1402 | 323.7 |
| C | 3 | 233 | 120172 | 366.94 | 1388 | 1402 | 323.7 |
| D | 1 | 52 | 1346729 | 4024.84 | 1424 | 1392 | 334.3 |
| D | 12 | 233 | 65126 | 190.67 | 1424 | 1392 | 334.3 |
| D | 2 | 234 | 43080 | 124.72 | 1424 | 1392 | 334.3 |
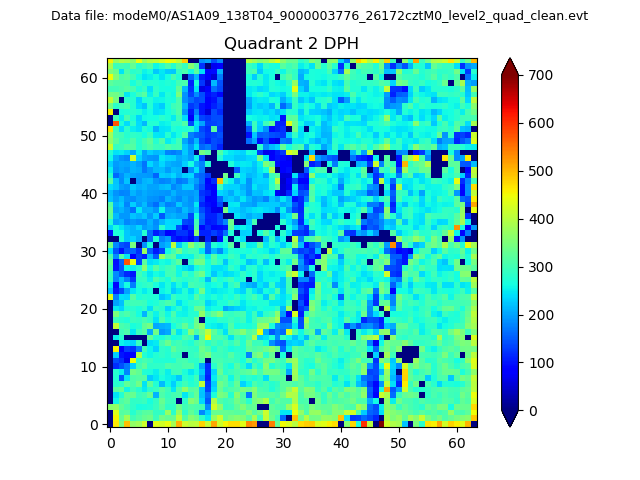
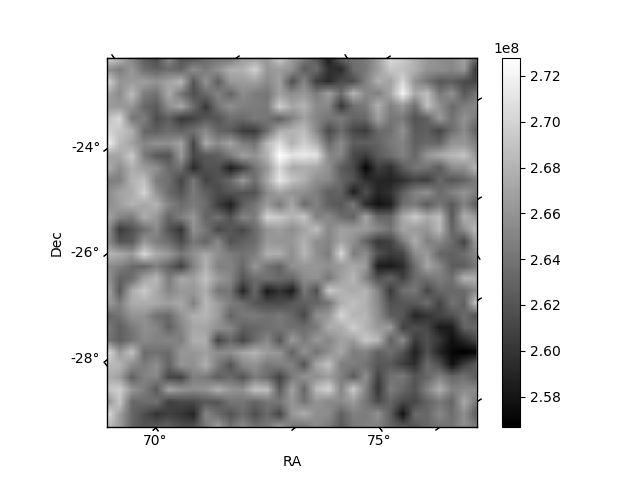
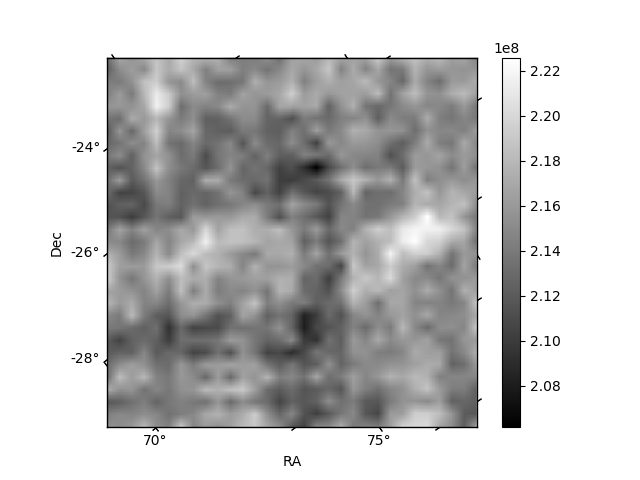
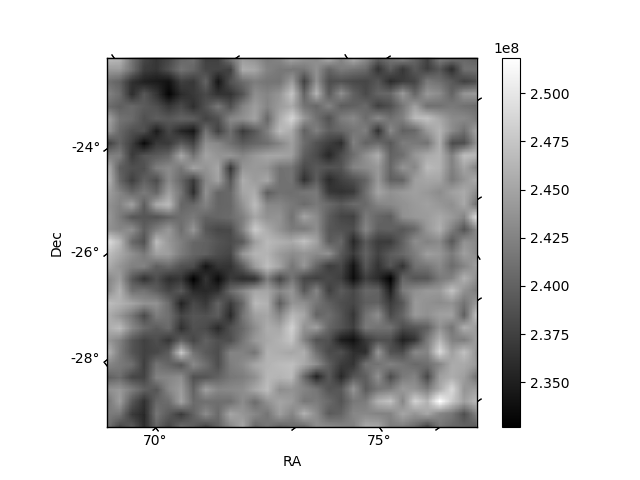
Histogram calculated using DETX and DETY for each event in the final _common_clean file
| Quadrant A | 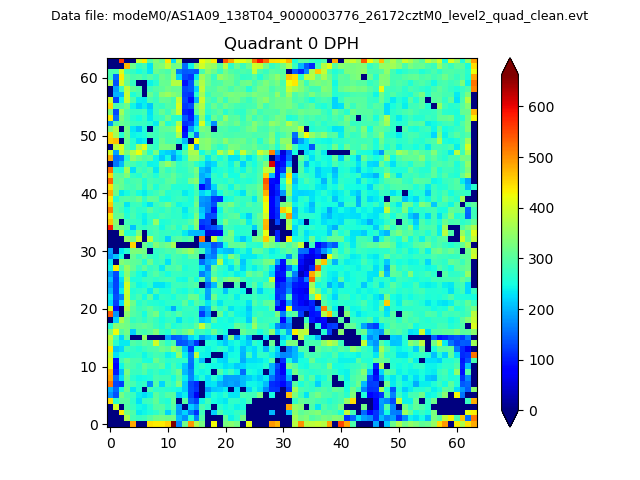 |
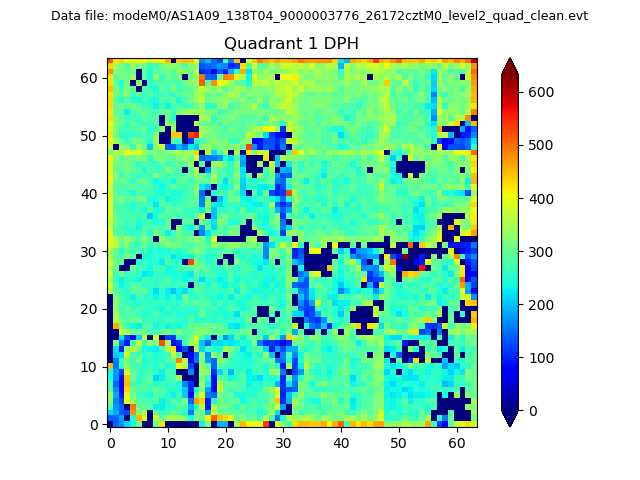 |
Quadrant B |
|---|---|---|---|
| Quadrant D | 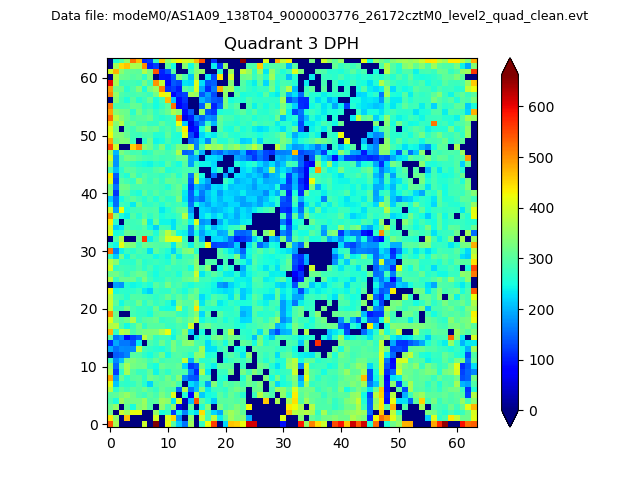 |
 |
Quadrant C |
| Plot type | Count rate plots | Images |
|---|---|---|
| Comparison with Poisson distribution Blue bars denote a histogram of data divided into 1 sec bins. Red curve is a Poisson curve with rate = median count rate of data. |
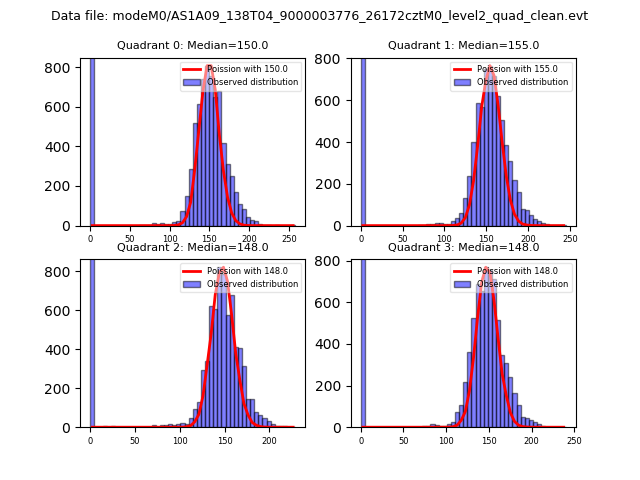 |
 |
| Quadrant-wise count rates Data is divided into 100 sec bins |
 |
|
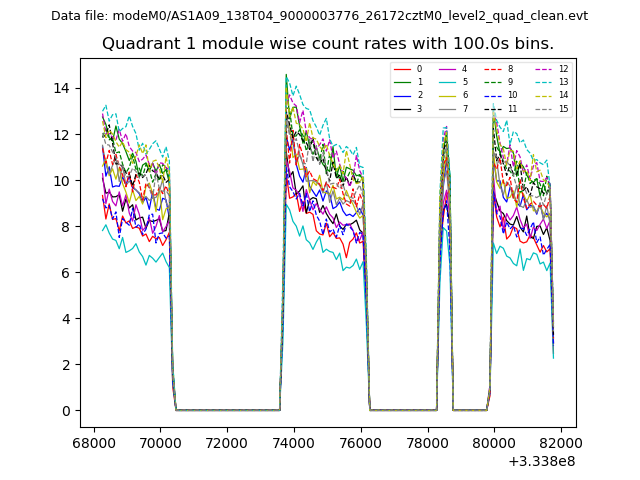
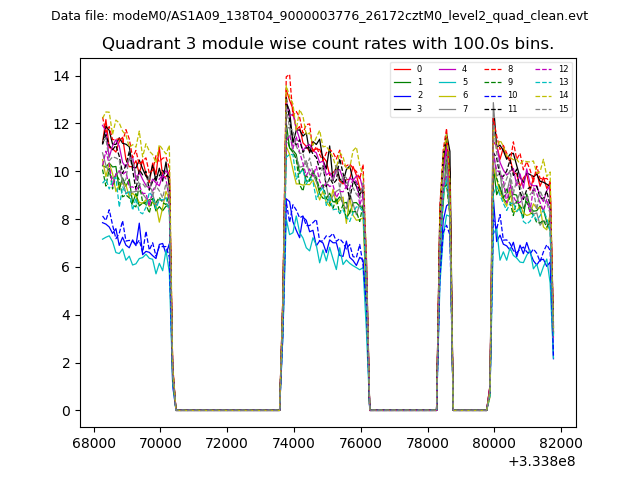
| Module-wise count rates for Quadrant A Data is divided into 100 sec bins |
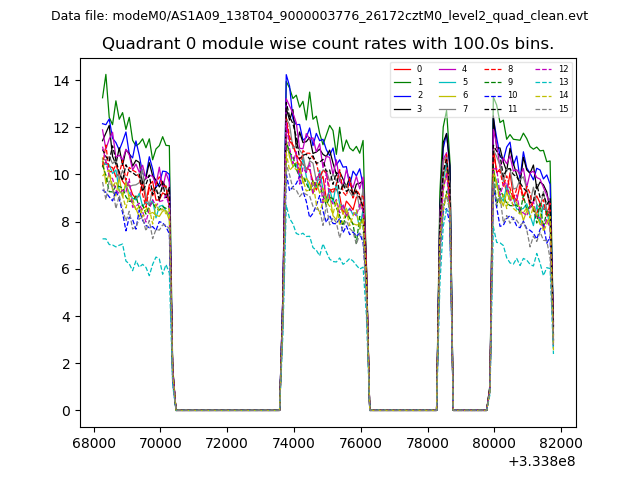 |
 |
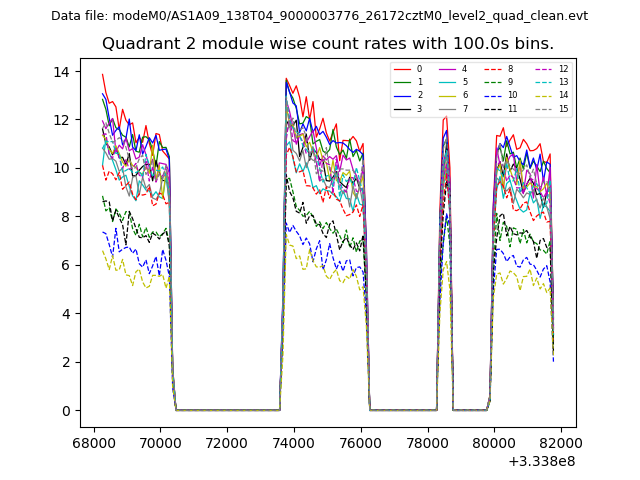
| Module-wise count rates for Quadrant B Data is divided into 100 sec bins |
 |
 |
| Module-wise count rates for Quadrant C Data is divided into 100 sec bins |
 |
 |
| Module-wise count rates for Quadrant D Data is divided into 100 sec bins |
 |
 |
| Parameter | Plot |
|---|---|
| CZT HV Monitor | 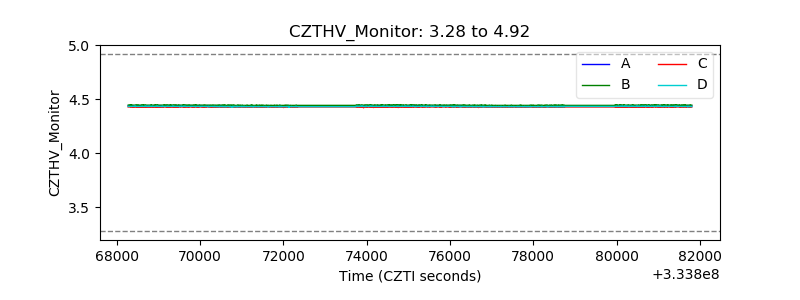 |
| D_VDD | 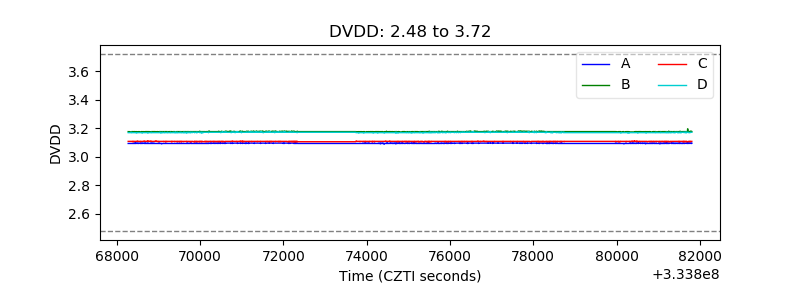 |
| Temperature 1 | 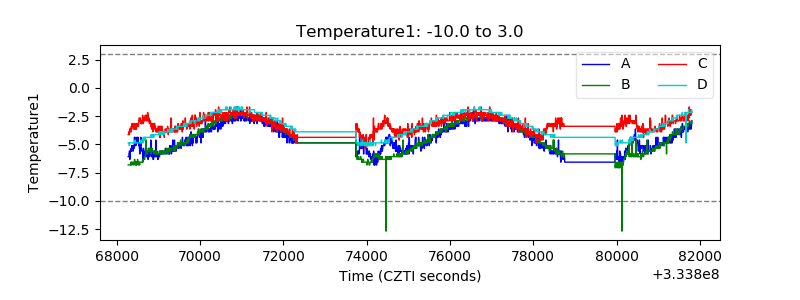 |
| Veto HV Monitor |  |
| Veto LLD | 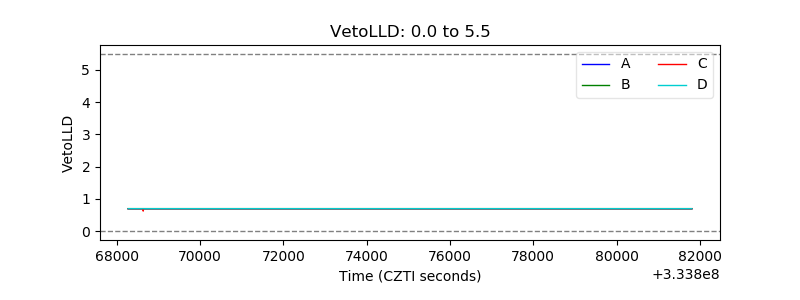 |
| Alpha Counter | 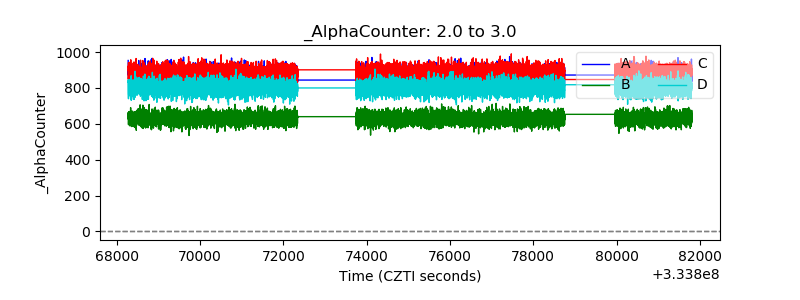 |
| _CPM_Rate | 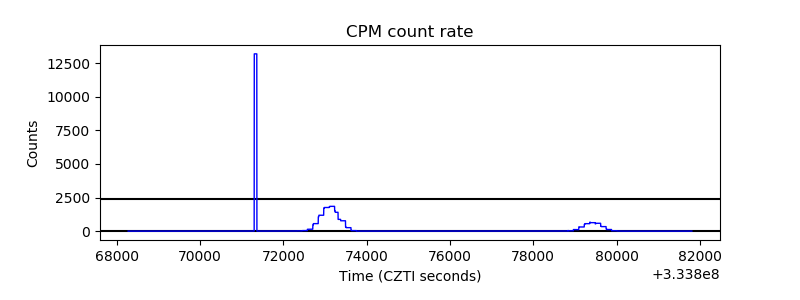 |
| CZT Counter | 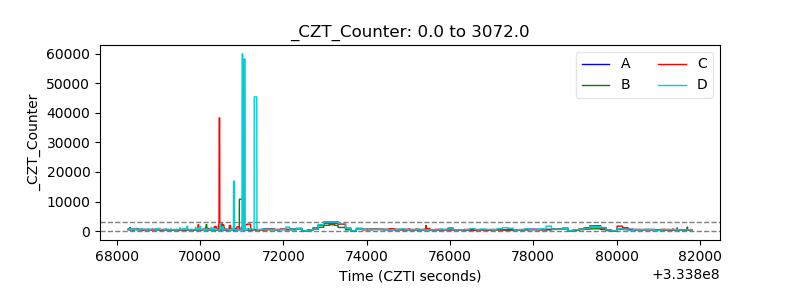 |
| +2.5 Volts monitor | 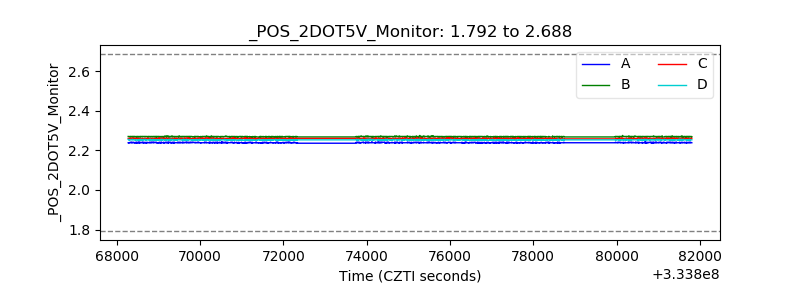 |
| +5 Volts monitor |  |
| _ROLL_ROT | 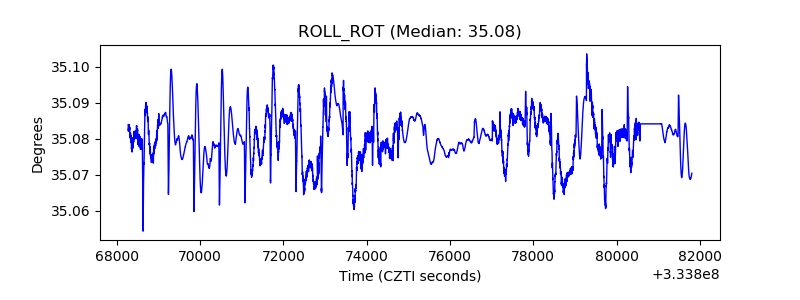 |
| _Roll_DEC | 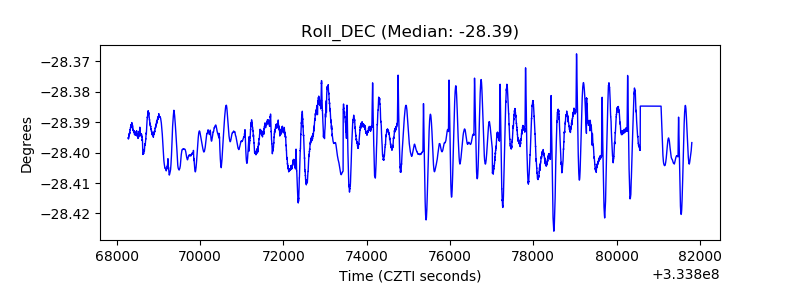 |
| _Roll_RA | 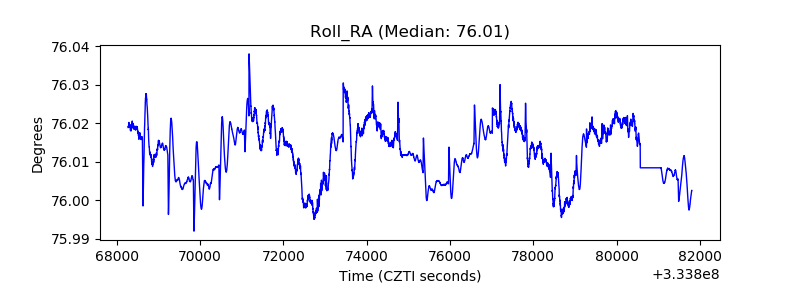 |
| Veto Counter | 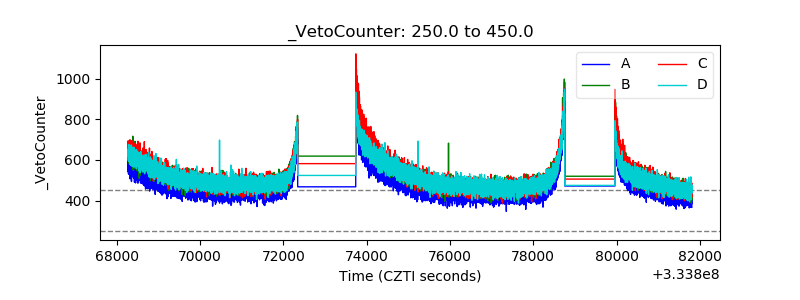 |