| Param | Original file | Final file |
|---|---|---|
| Filename | modeM0/AS1A09_138T04_9000003776_26173cztM0_level2.evt | modeM0/AS1A09_138T04_9000003776_26173cztM0_level2_quad_clean.evt |
| Size (bytes) | 434,545,920 | 85,397,760 |
| Size | 414.4 MB | 81.4 MB |
| Events in quadrant A | 2,947,480 | 545,230 |
| Events in quadrant B | 3,002,187 | 561,010 |
| Events in quadrant C | 3,249,503 | 530,220 |
| Events in quadrant D | 3,545,821 | 523,176 |
| Mode M9 | |||
|---|---|---|---|
| Quadrant | BADHDUFLAG | Total packets | Discarded packets |
| A | 0 | 10 | 0 |
| B | 0 | 10 | 0 |
| C | 0 | 10 | 0 |
| D | 0 | 10 | 0 |
| Mode M0 | |||
|---|---|---|---|
| Quadrant | BADHDUFLAG | Total packets | Discarded packets |
| A | 0 | 12485 | 0 |
| B | 0 | 12619 | 0 |
| C | 0 | 13322 | 0 |
| D | 0 | 14344 | 0 |
| Quadrant | Total seconds | Saturated seconds | Saturation percentage |
|---|---|---|---|
| A | 6108 | 43 | 0.703995% |
| B | 6108 | 51 | 0.834971% |
| C | 6108 | 122 | 1.997380% |
| D | 6108 | 144 | 2.357564% |
Noise dominated data is calculated using 1-second bins in cleaned event files. If a bin has >2000 counts, and if more than 50% of those come from <1% of pixels, then it is considered to be noise-dominated and hence unusable.
| Quadrant | # 1 sec bins | Bins with >0 counts | Bins with >2000 counts | High rate bins dominated by noise | Noise dominated (total time) | Noise dominated (detector-on time) | Marked lightcurve |
|---|---|---|---|---|---|---|---|
| A | 7033 | 6110 | 0 | 0 | 0.00% | 0.00% | 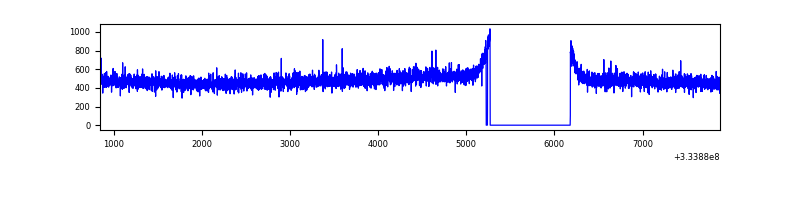 |
| B | 7033 | 6109 | 0 | 0 | 0.00% | 0.00% | 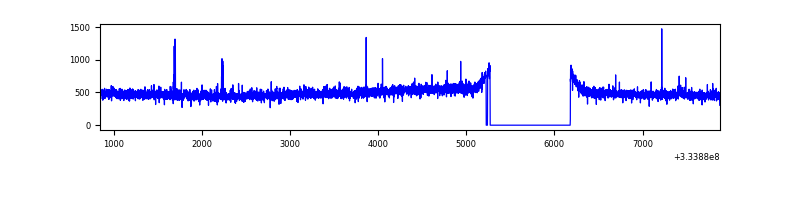 |
| C | 7033 | 6109 | 20 | 20 | 0.28% | 0.33% | 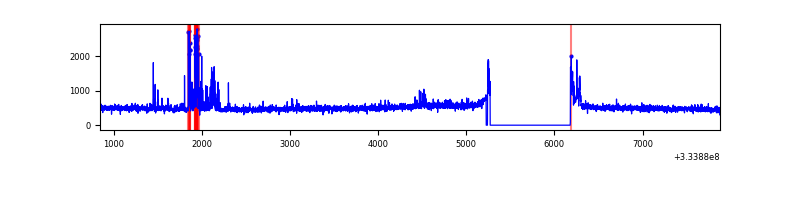 |
| D | 7033 | 6110 | 118 | 118 | 1.68% | 1.93% | 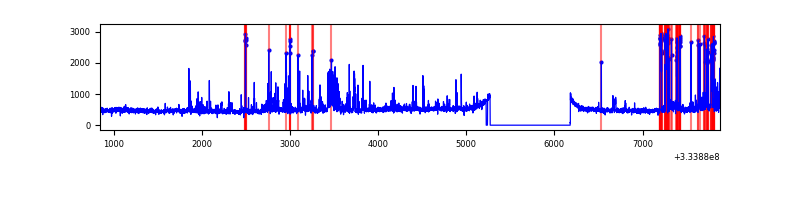 |
Top three noisy pixels from each quadrant. If the there are fewer than three noisy pixels in the level2.evt file, extra rows are filled as -1
| Pixel properties | Quadrant properties | ||||||
|---|---|---|---|---|---|---|---|
| Quadrant | DetID | PixID | Counts | Sigma | Mean | Median | Sigma |
| A | 13 | 254 | 8780 | 52.52 | 763 | 748 | 152.9 |
| A | 3 | 137 | 6771 | 39.38 | 763 | 748 | 152.9 |
| A | 0 | 226 | 6557 | 37.98 | 763 | 748 | 152.9 |
| B | 0 | 230 | 39226 | 265.2 | 753 | 731 | 145.2 |
| B | 12 | 111 | 17506 | 115.57 | 753 | 731 | 145.2 |
| B | 11 | 111 | 15770 | 103.61 | 753 | 731 | 145.2 |
| C | 2 | 16 | 207336 | 1204.36 | 732 | 738 | 171.5 |
| C | 14 | 238 | 117184 | 678.82 | 732 | 738 | 171.5 |
| C | 3 | 233 | 73177 | 422.28 | 732 | 738 | 171.5 |
| D | 1 | 52 | 582809 | 3281.9 | 743 | 725 | 177.4 |
| D | 12 | 233 | 102975 | 576.5 | 743 | 725 | 177.4 |
| D | 2 | 234 | 25680 | 140.7 | 743 | 725 | 177.4 |
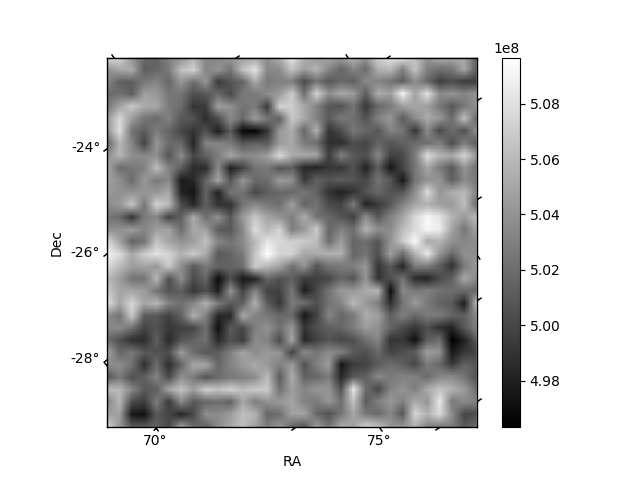
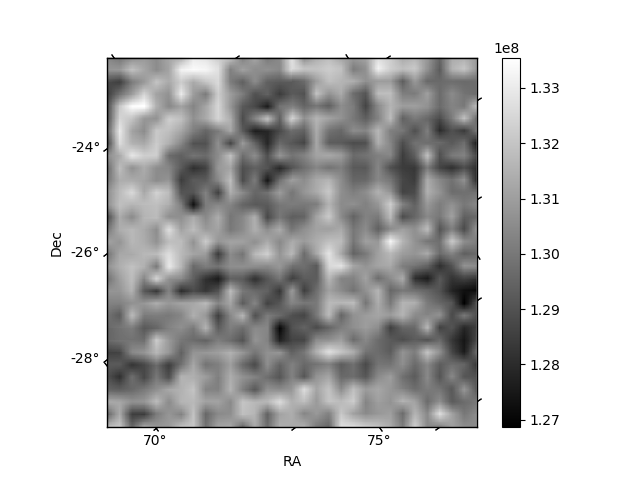
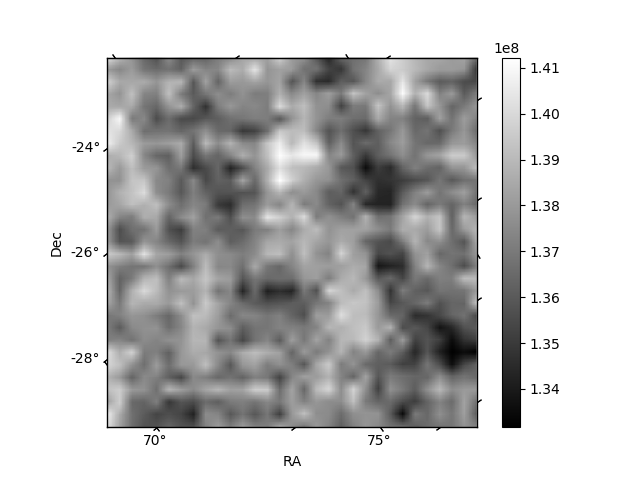
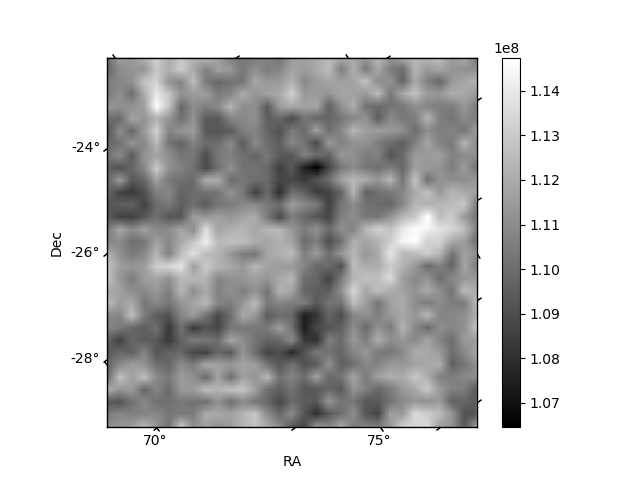
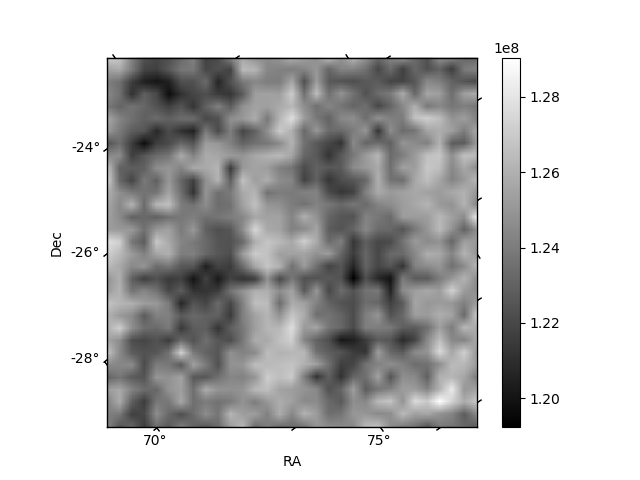
Histogram calculated using DETX and DETY for each event in the final _common_clean file
| Quadrant A | 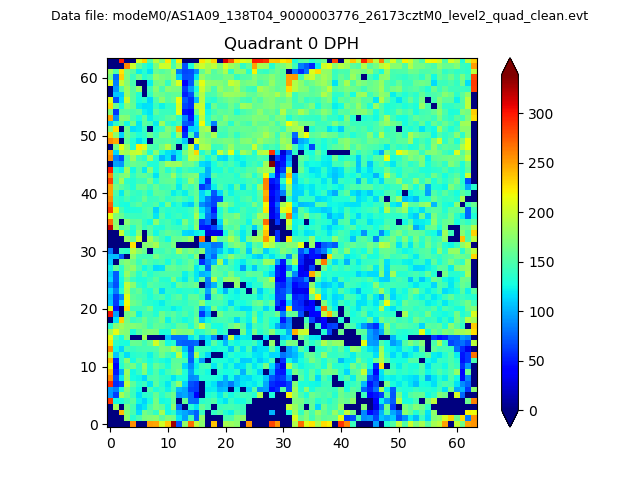 |
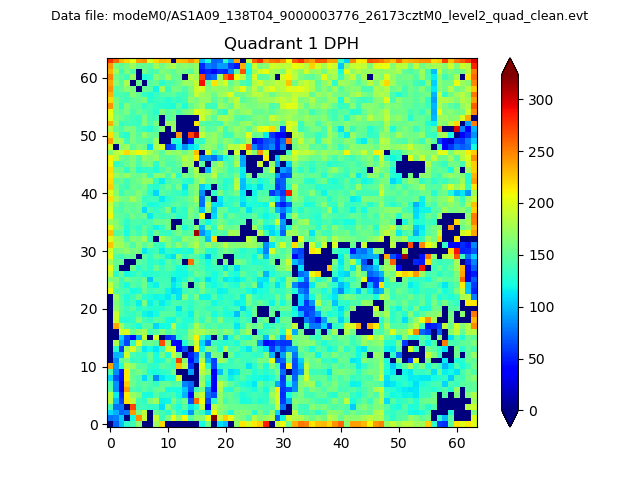 |
Quadrant B |
|---|---|---|---|
| Quadrant D |  |
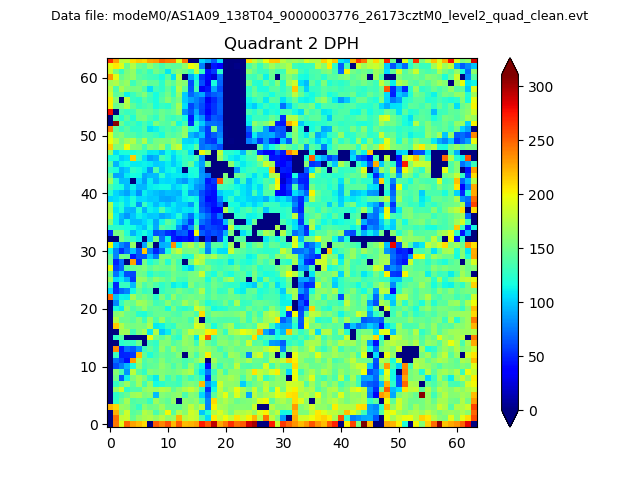 |
Quadrant C |
| Plot type | Count rate plots | Images |
|---|---|---|
| Comparison with Poisson distribution Blue bars denote a histogram of data divided into 1 sec bins. Red curve is a Poisson curve with rate = median count rate of data. |
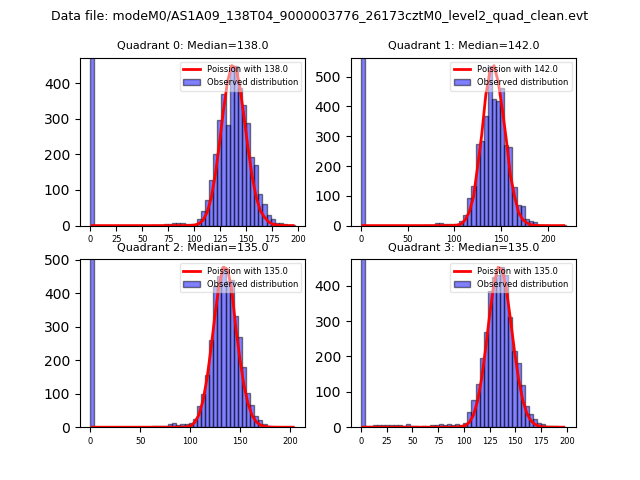 |
 |
| Quadrant-wise count rates Data is divided into 100 sec bins |
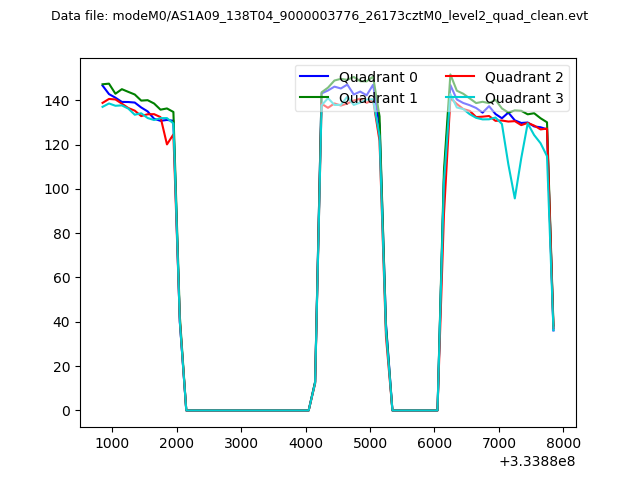 |
|
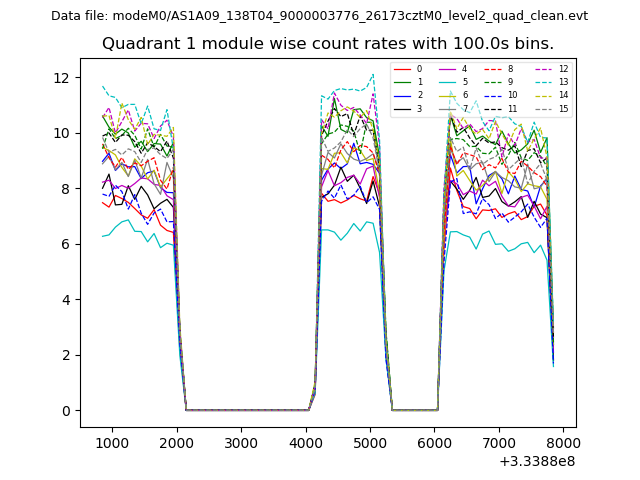
| Module-wise count rates for Quadrant A Data is divided into 100 sec bins |
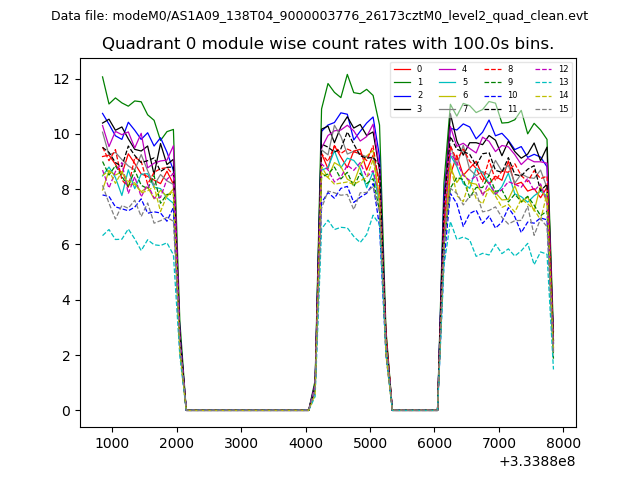 |
 |
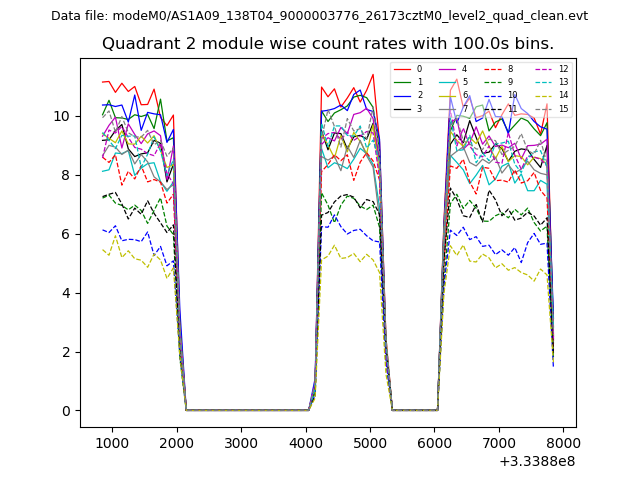
| Module-wise count rates for Quadrant B Data is divided into 100 sec bins |
 |
 |
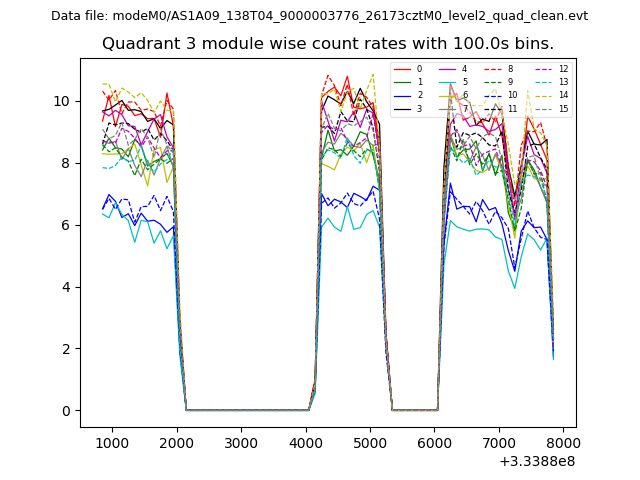
| Module-wise count rates for Quadrant C Data is divided into 100 sec bins |
 |
 |
| Module-wise count rates for Quadrant D Data is divided into 100 sec bins |
 |
 |
| Parameter | Plot |
|---|---|
| CZT HV Monitor | 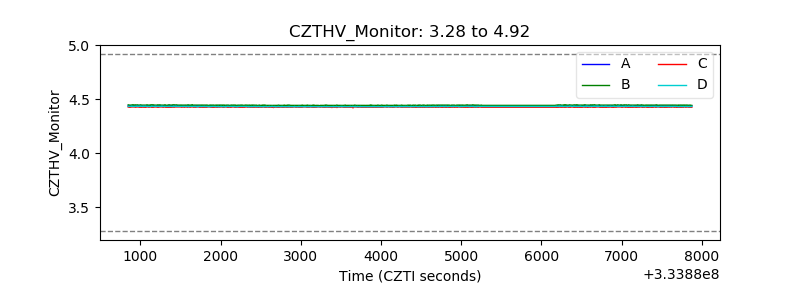 |
| D_VDD | 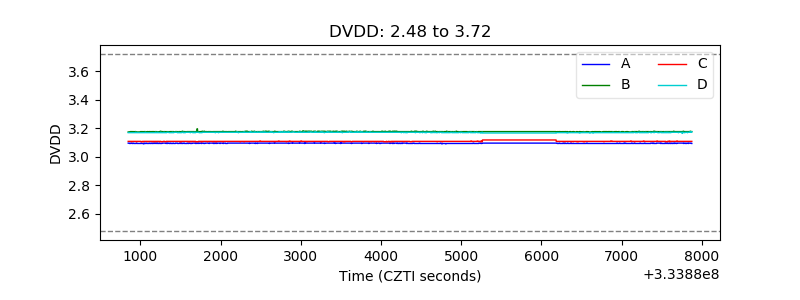 |
| Temperature 1 | 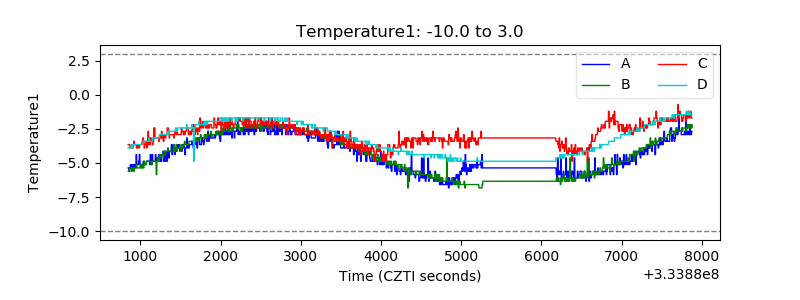 |
| Veto HV Monitor | 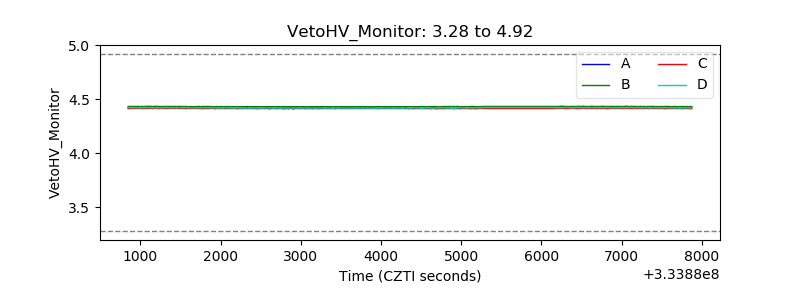 |
| Veto LLD | 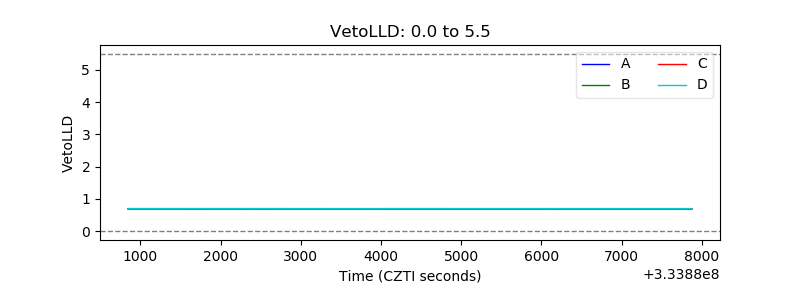 |
| Alpha Counter | 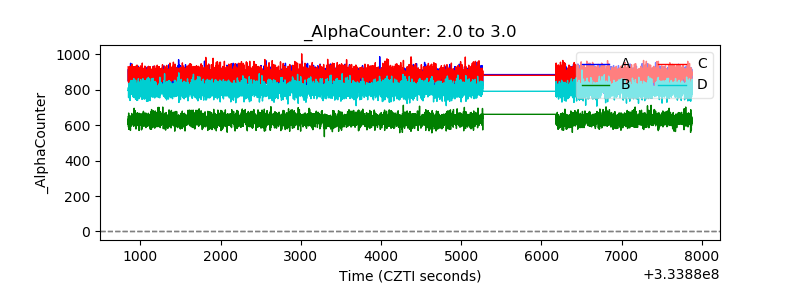 |
| _CPM_Rate |  |
| CZT Counter | 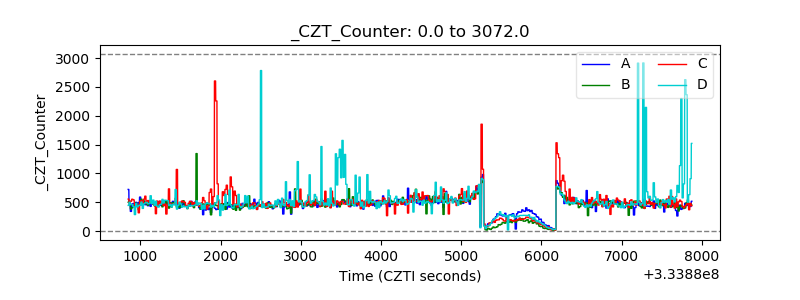 |
| +2.5 Volts monitor |  |
| +5 Volts monitor |  |
| _ROLL_ROT | 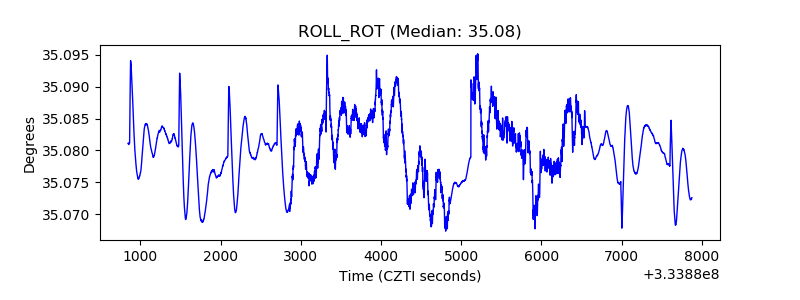 |
| _Roll_DEC | 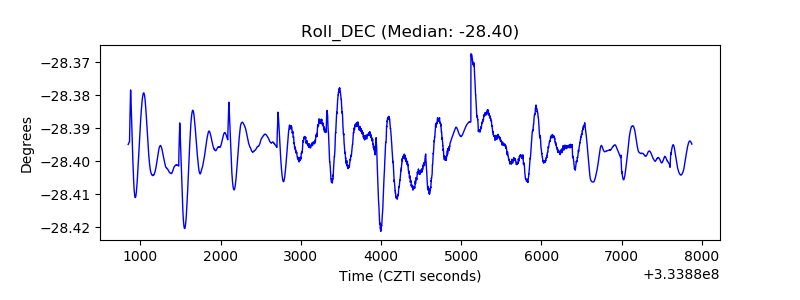 |
| _Roll_RA | 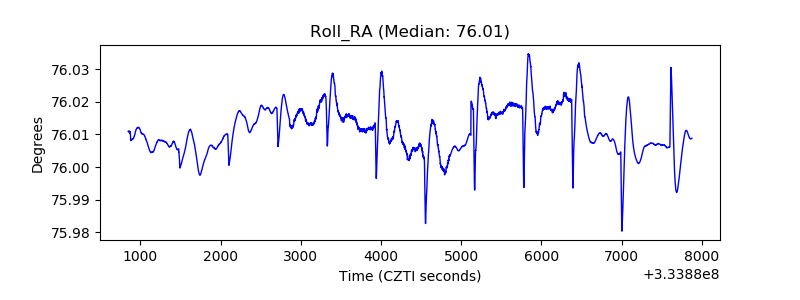 |
| Veto Counter | 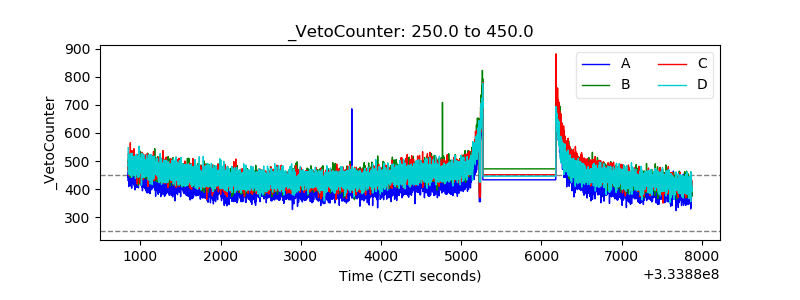 |