| Param | Original file | Final file |
|---|---|---|
| Filename | modeM0/AS1A09_138T04_9000003776_26175cztM0_level2.evt | modeM0/AS1A09_138T04_9000003776_26175cztM0_level2_quad_clean.evt |
| Size (bytes) | 525,784,320 | 86,927,040 |
| Size | 501.4 MB | 82.9 MB |
| Events in quadrant A | 3,379,637 | 542,705 |
| Events in quadrant B | 3,486,322 | 555,701 |
| Events in quadrant C | 3,415,820 | 532,843 |
| Events in quadrant D | 5,166,712 | 513,583 |
| Mode M9 | |||
|---|---|---|---|
| Quadrant | BADHDUFLAG | Total packets | Discarded packets |
| A | 0 | 1 | 0 |
| B | 0 | 1 | 0 |
| C | 0 | 1 | 0 |
| D | 0 | 1 | 0 |
| Mode M0 | |||
|---|---|---|---|
| Quadrant | BADHDUFLAG | Total packets | Discarded packets |
| A | 0 | 14478 | 0 |
| B | 0 | 14668 | 0 |
| C | 0 | 14510 | 0 |
| D | 0 | 19807 | 0 |
| Quadrant | Total seconds | Saturated seconds | Saturation percentage |
|---|---|---|---|
| A | 6992 | 231 | 3.303776% |
| B | 6992 | 244 | 3.489703% |
| C | 6992 | 245 | 3.504005% |
| D | 6992 | 605 | 8.652746% |
Noise dominated data is calculated using 1-second bins in cleaned event files. If a bin has >2000 counts, and if more than 50% of those come from <1% of pixels, then it is considered to be noise-dominated and hence unusable.
| Quadrant | # 1 sec bins | Bins with >0 counts | Bins with >2000 counts | High rate bins dominated by noise | Noise dominated (total time) | Noise dominated (detector-on time) | Marked lightcurve |
|---|---|---|---|---|---|---|---|
| A | 7122 | 6993 | 0 | 0 | 0.00% | 0.00% | 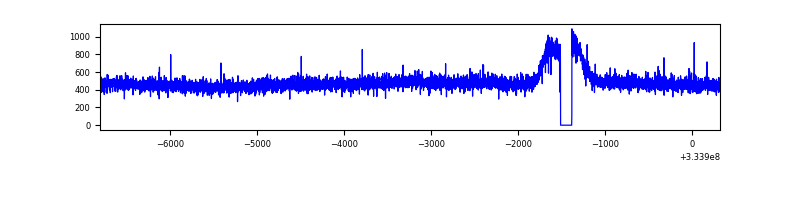 |
| B | 7122 | 6993 | 1 | 1 | 0.01% | 0.01% | 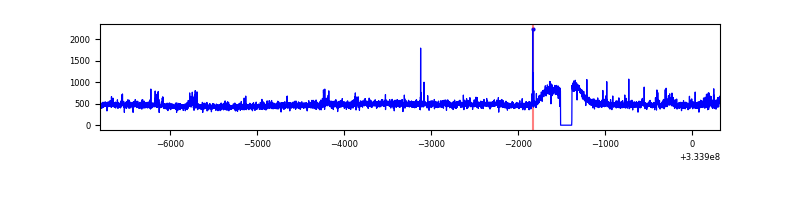 |
| C | 7121 | 6992 | 0 | 0 | 0.00% | 0.00% | 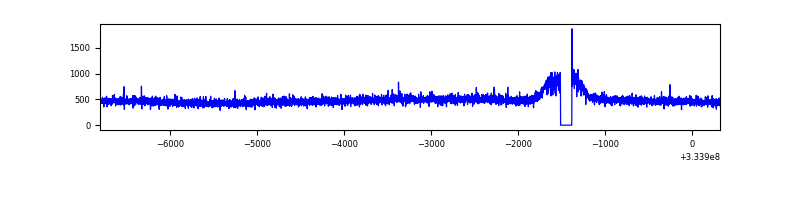 |
| D | 7122 | 6993 | 423 | 423 | 5.94% | 6.05% | 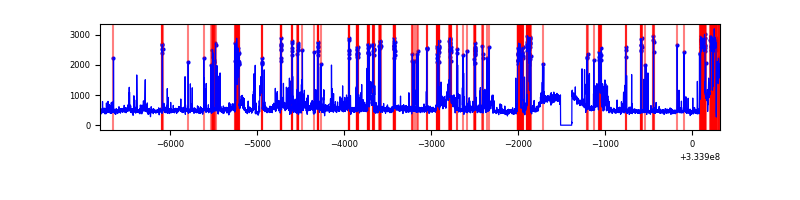 |
Top three noisy pixels from each quadrant. If the there are fewer than three noisy pixels in the level2.evt file, extra rows are filled as -1
| Pixel properties | Quadrant properties | ||||||
|---|---|---|---|---|---|---|---|
| Quadrant | DetID | PixID | Counts | Sigma | Mean | Median | Sigma |
| A | 13 | 254 | 10759 | 56.23 | 873 | 855 | 176.1 |
| A | 3 | 137 | 8321 | 42.39 | 873 | 855 | 176.1 |
| A | 0 | 226 | 7497 | 37.71 | 873 | 855 | 176.1 |
| B | 0 | 230 | 82247 | 483.75 | 862 | 839 | 168.3 |
| B | 12 | 111 | 20941 | 119.45 | 862 | 839 | 168.3 |
| B | 11 | 111 | 18705 | 106.16 | 862 | 839 | 168.3 |
| C | 14 | 238 | 132298 | 662.14 | 836 | 839 | 198.5 |
| C | 3 | 233 | 16616 | 79.47 | 836 | 839 | 198.5 |
| C | 13 | 61 | 5593 | 23.95 | 836 | 839 | 198.5 |
| D | 1 | 52 | 1893411 | 9532.63 | 832 | 811 | 198.5 |
| D | 12 | 233 | 82723 | 412.57 | 832 | 811 | 198.5 |
| D | 2 | 234 | 35243 | 173.43 | 832 | 811 | 198.5 |
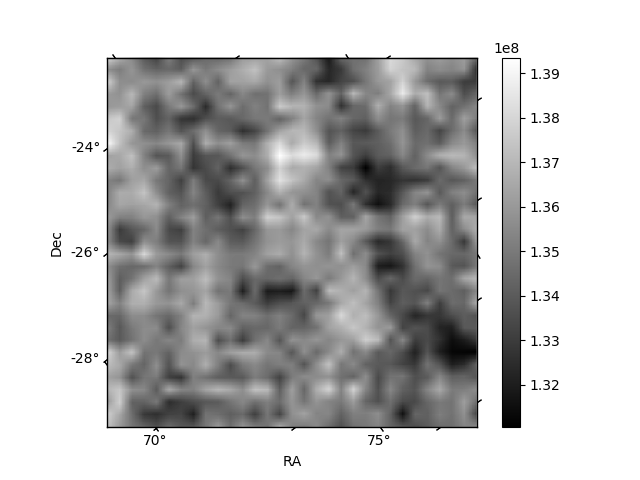
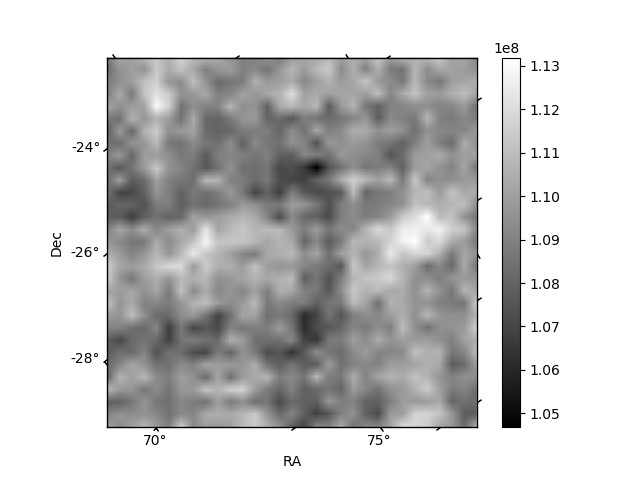
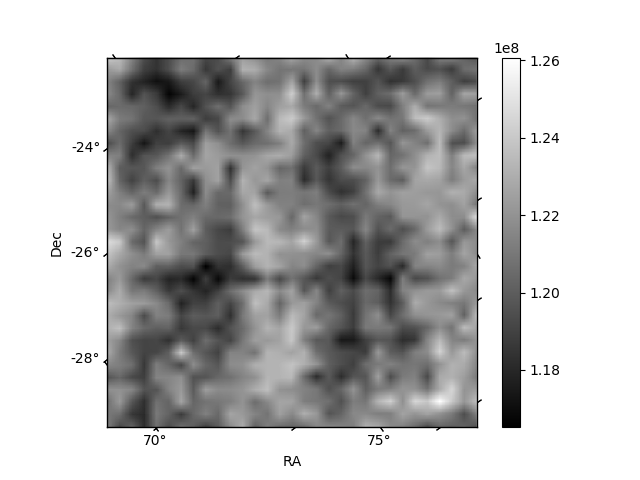
Histogram calculated using DETX and DETY for each event in the final _common_clean file
| Quadrant A |  |
 |
Quadrant B |
|---|---|---|---|
| Quadrant D | 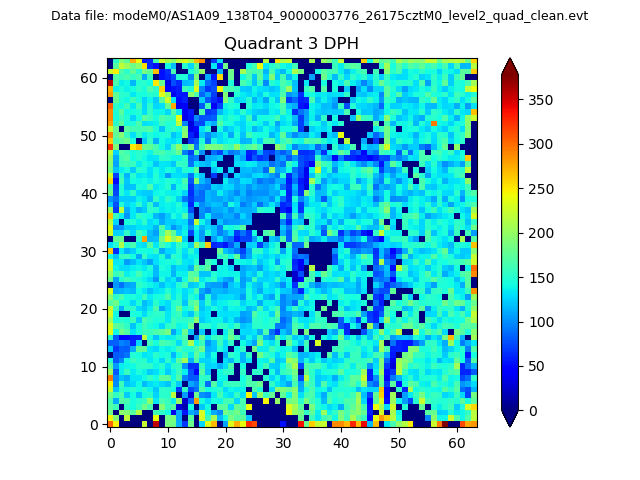 |
 |
Quadrant C |
| Plot type | Count rate plots | Images |
|---|---|---|
| Comparison with Poisson distribution Blue bars denote a histogram of data divided into 1 sec bins. Red curve is a Poisson curve with rate = median count rate of data. |
 |
 |
| Quadrant-wise count rates Data is divided into 100 sec bins |
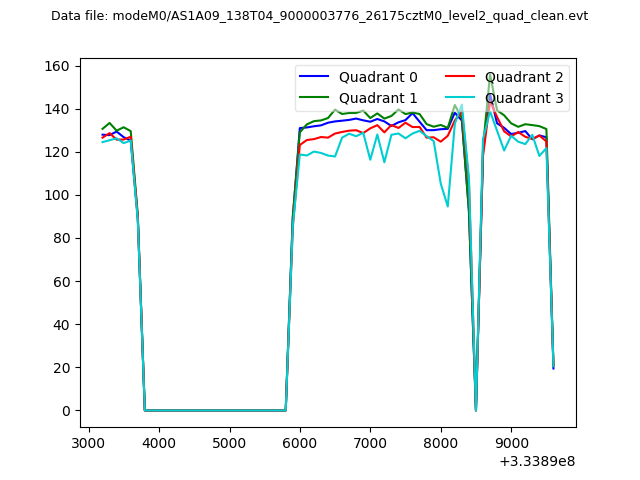 |
|
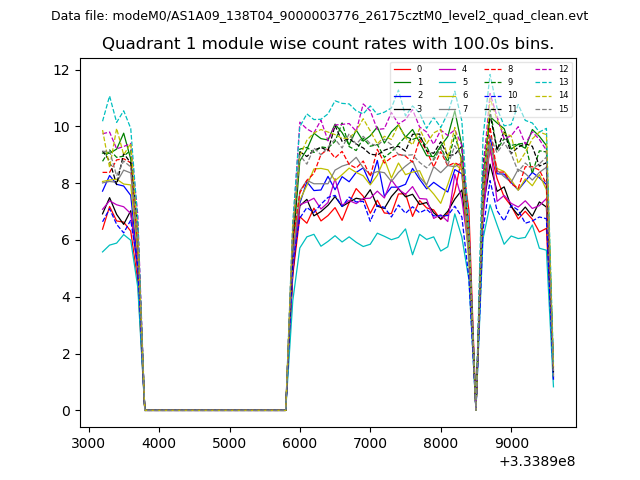
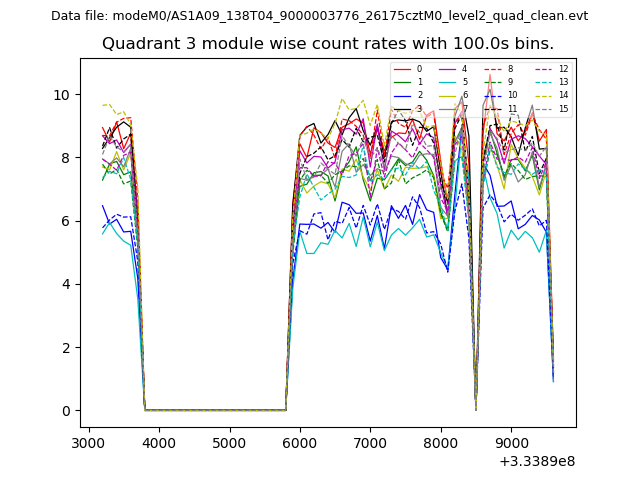
| Module-wise count rates for Quadrant A Data is divided into 100 sec bins |
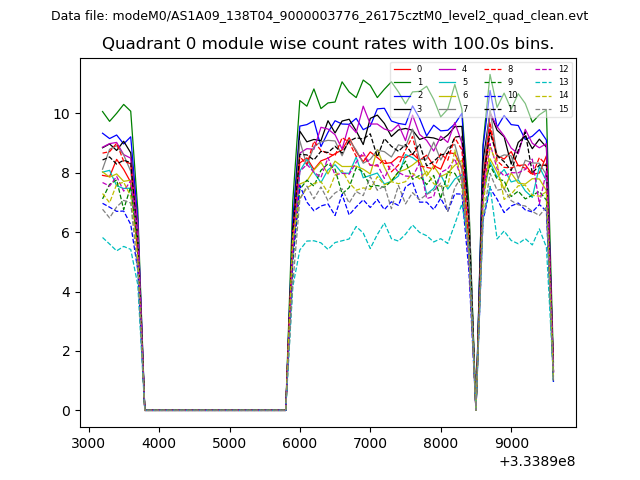 |
 |
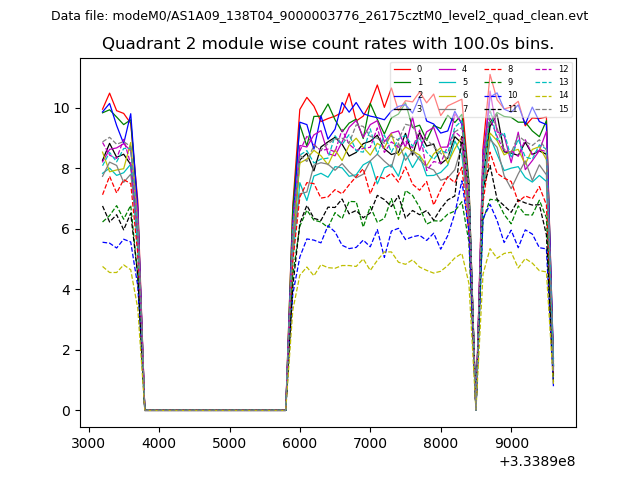
| Module-wise count rates for Quadrant B Data is divided into 100 sec bins |
 |
 |
| Module-wise count rates for Quadrant C Data is divided into 100 sec bins |
 |
 |
| Module-wise count rates for Quadrant D Data is divided into 100 sec bins |
 |
 |
| Parameter | Plot |
|---|---|
| CZT HV Monitor | 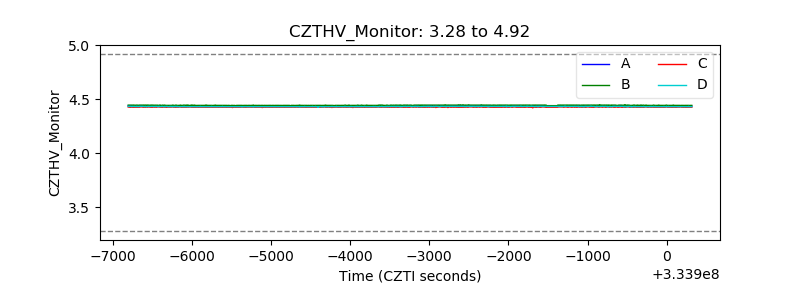 |
| D_VDD | 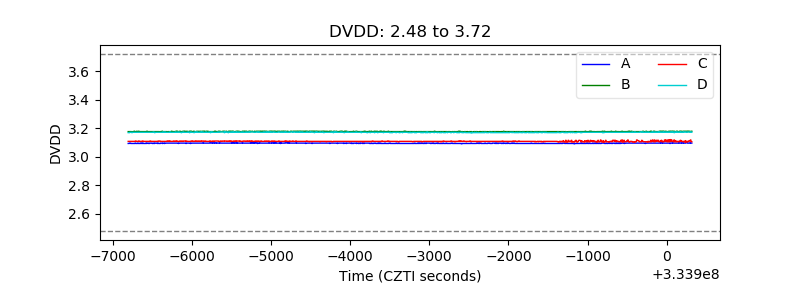 |
| Temperature 1 | 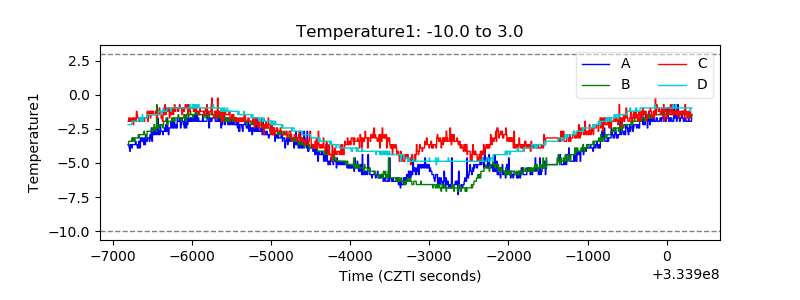 |
| Veto HV Monitor | 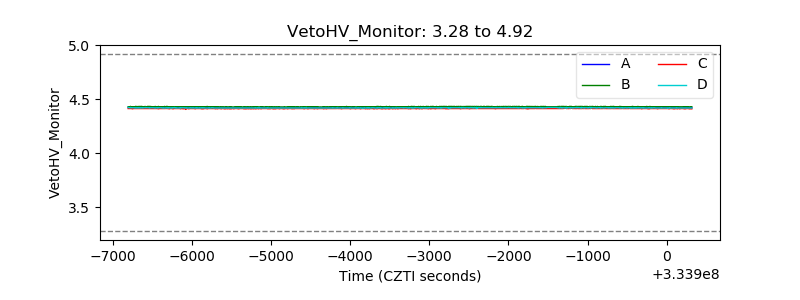 |
| Veto LLD | 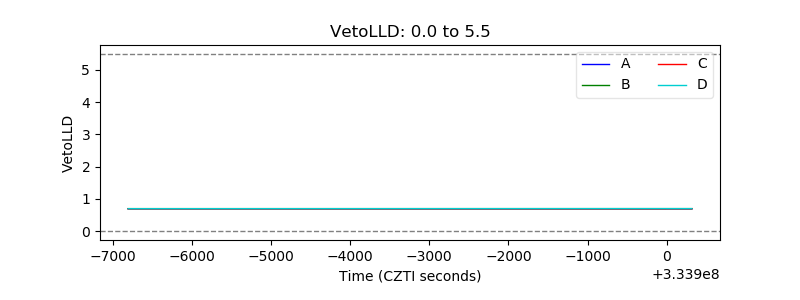 |
| Alpha Counter | 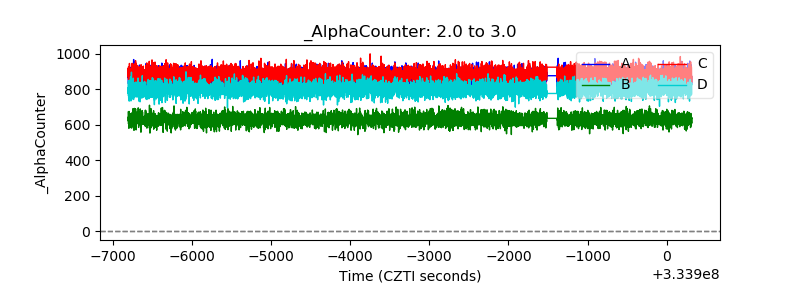 |
| _CPM_Rate | 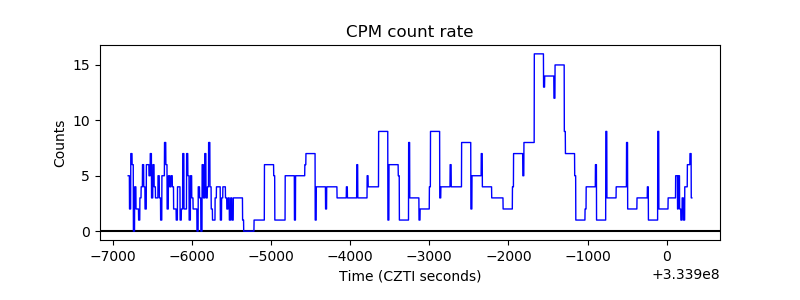 |
| CZT Counter |  |
| +2.5 Volts monitor |  |
| +5 Volts monitor | 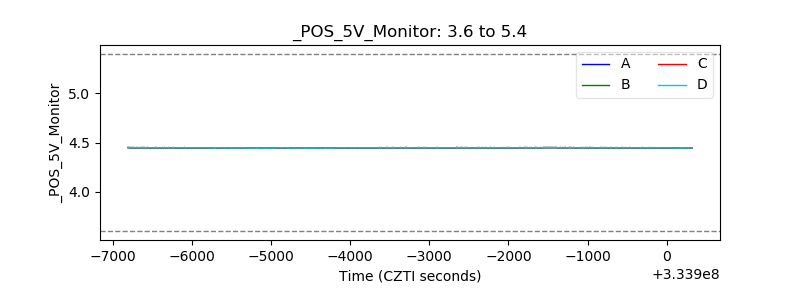 |
| _ROLL_ROT |  |
| _Roll_DEC | 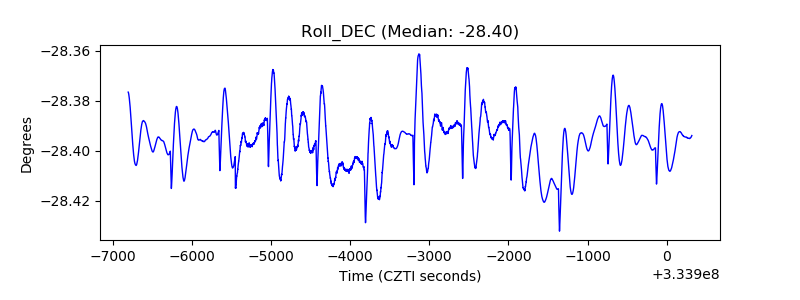 |
| _Roll_RA |  |
| Veto Counter | 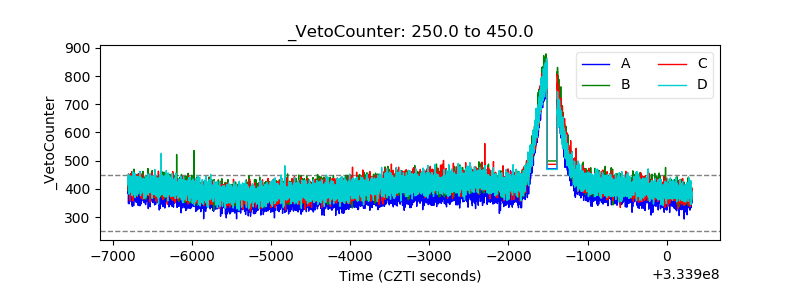 |