| Param | Original file | Final file |
|---|---|---|
| Filename | modeM0/AS1A09_138T04_9000003776_26176cztM0_level2.evt | modeM0/AS1A09_138T04_9000003776_26176cztM0_level2_quad_clean.evt |
| Size (bytes) | 591,874,560 | 86,129,280 |
| Size | 564.5 MB | 82.1 MB |
| Events in quadrant A | 3,487,127 | 542,316 |
| Events in quadrant B | 3,614,574 | 555,548 |
| Events in quadrant C | 3,566,164 | 529,865 |
| Events in quadrant D | 6,758,397 | 468,191 |
| Mode M9 | |||
|---|---|---|---|
| Quadrant | BADHDUFLAG | Total packets | Discarded packets |
| A | 0 | 4 | 0 |
| B | 0 | 4 | 0 |
| C | 0 | 4 | 0 |
| D | 0 | 4 | 0 |
| Mode M0 | |||
|---|---|---|---|
| Quadrant | BADHDUFLAG | Total packets | Discarded packets |
| A | 0 | 15040 | 0 |
| B | 0 | 15303 | 0 |
| C | 0 | 15145 | 0 |
| D | 0 | 25011 | 0 |
| Quadrant | Total seconds | Saturated seconds | Saturation percentage |
|---|---|---|---|
| A | 7356 | 74 | 1.005982% |
| B | 7357 | 94 | 1.277695% |
| C | 7357 | 81 | 1.100992% |
| D | 7357 | 1127 | 15.318744% |
Noise dominated data is calculated using 1-second bins in cleaned event files. If a bin has >2000 counts, and if more than 50% of those come from <1% of pixels, then it is considered to be noise-dominated and hence unusable.
| Quadrant | # 1 sec bins | Bins with >0 counts | Bins with >2000 counts | High rate bins dominated by noise | Noise dominated (total time) | Noise dominated (detector-on time) | Marked lightcurve |
|---|---|---|---|---|---|---|---|
| A | 7731 | 7357 | 0 | 0 | 0.00% | 0.00% | 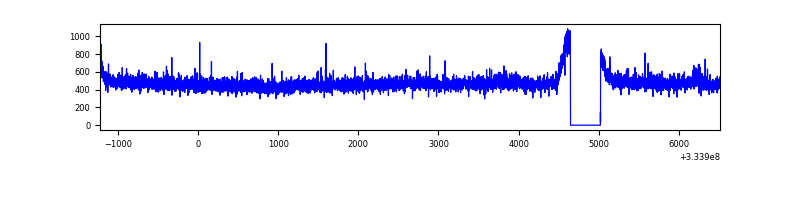 |
| B | 7732 | 7358 | 0 | 0 | 0.00% | 0.00% | 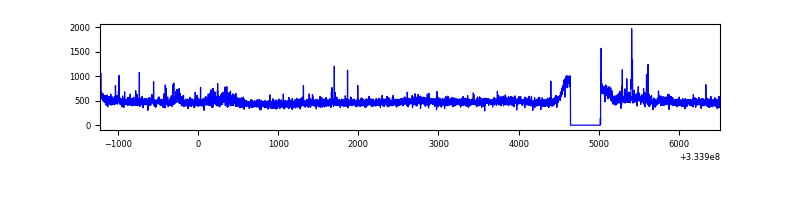 |
| C | 7732 | 7358 | 0 | 0 | 0.00% | 0.00% | 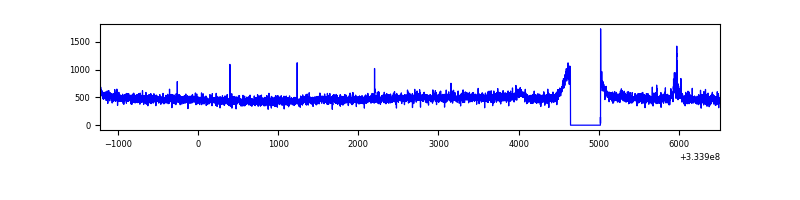 |
| D | 7732 | 7358 | 1086 | 1086 | 14.05% | 14.76% | 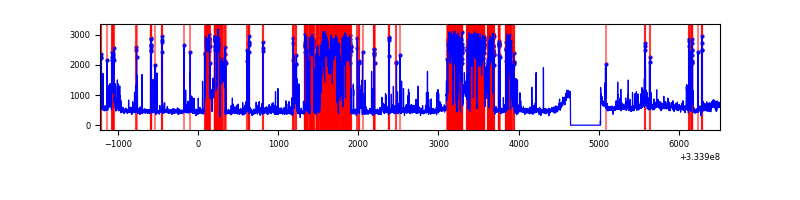 |
Top three noisy pixels from each quadrant. If the there are fewer than three noisy pixels in the level2.evt file, extra rows are filled as -1
| Pixel properties | Quadrant properties | ||||||
|---|---|---|---|---|---|---|---|
| Quadrant | DetID | PixID | Counts | Sigma | Mean | Median | Sigma |
| A | 13 | 254 | 12139 | 62.1 | 899 | 879 | 181.3 |
| A | 11 | 29 | 9127 | 45.49 | 899 | 879 | 181.3 |
| A | 6 | 16 | 8507 | 42.07 | 899 | 879 | 181.3 |
| B | 0 | 230 | 86372 | 500.14 | 889 | 868 | 171.0 |
| B | 0 | 190 | 27517 | 155.88 | 889 | 868 | 171.0 |
| B | 3 | 209 | 21512 | 120.75 | 889 | 868 | 171.0 |
| C | 14 | 238 | 136487 | 667.13 | 860 | 864 | 203.3 |
| C | 3 | 233 | 53581 | 259.31 | 860 | 864 | 203.3 |
| C | 8 | 128 | 11053 | 50.12 | 860 | 864 | 203.3 |
| D | 1 | 52 | 3577665 | 18722.39 | 799 | 779 | 191.0 |
| D | 12 | 233 | 119714 | 622.54 | 799 | 779 | 191.0 |
| D | 2 | 234 | 38154 | 195.63 | 799 | 779 | 191.0 |
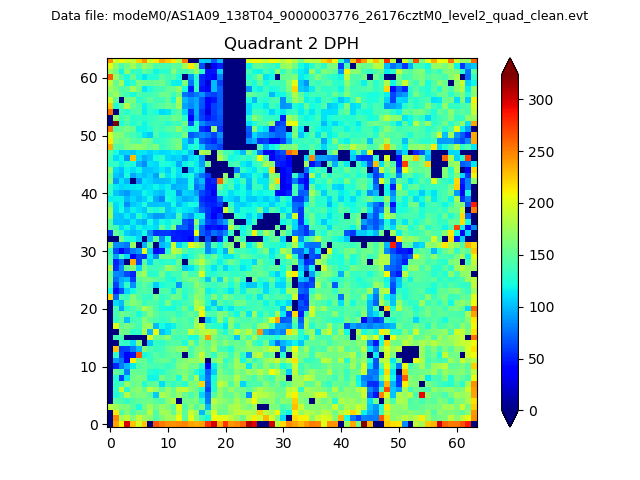
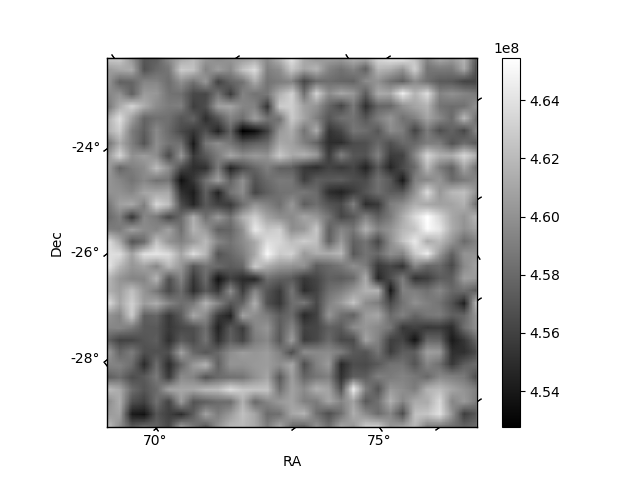
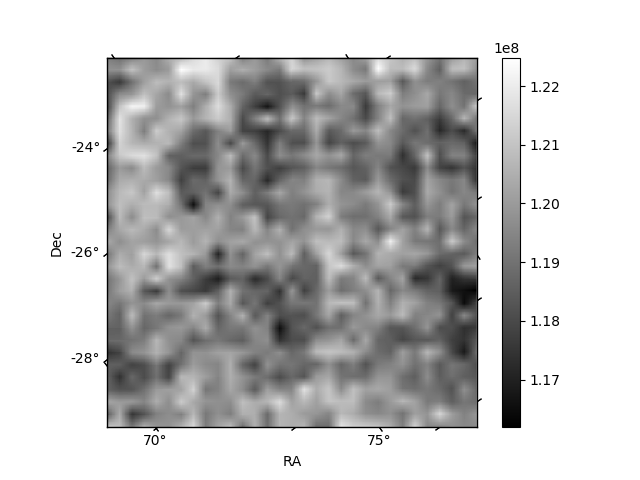
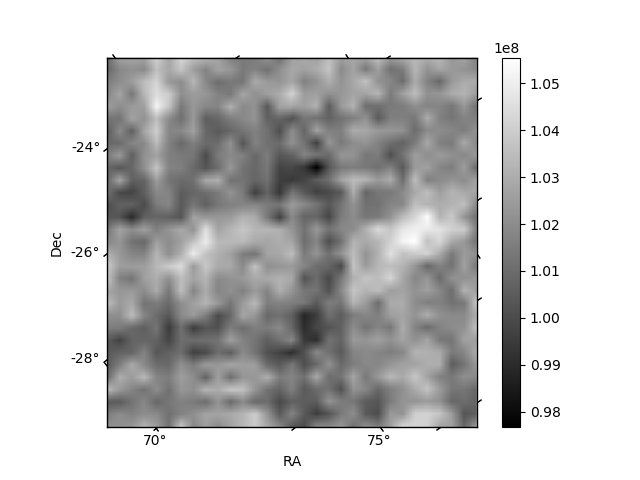
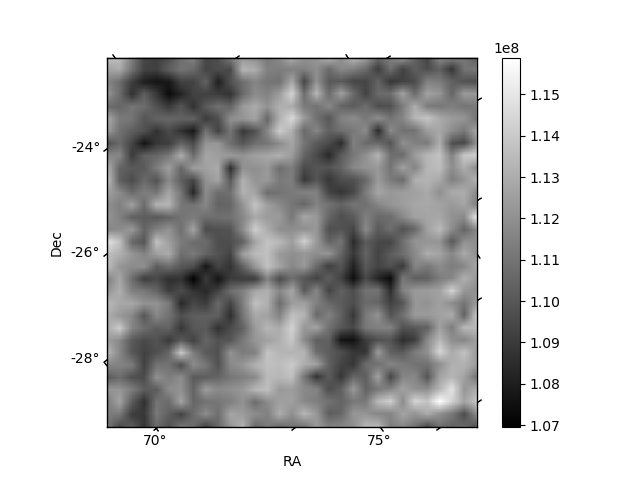
Histogram calculated using DETX and DETY for each event in the final _common_clean file
| Quadrant A | 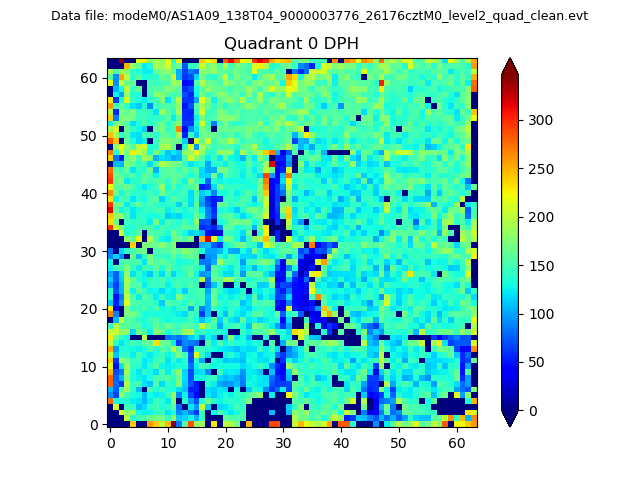 |
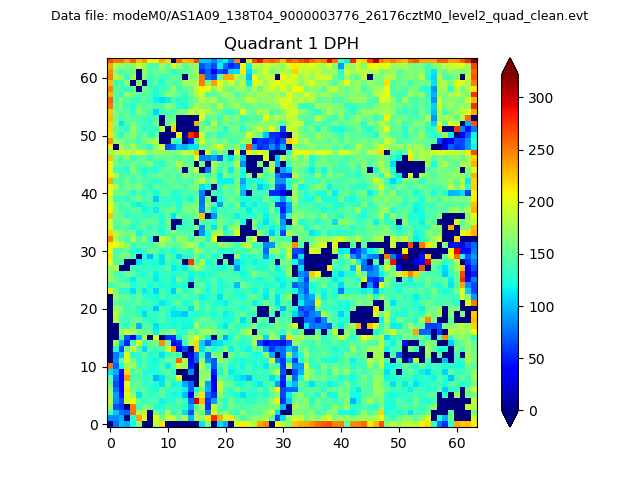 |
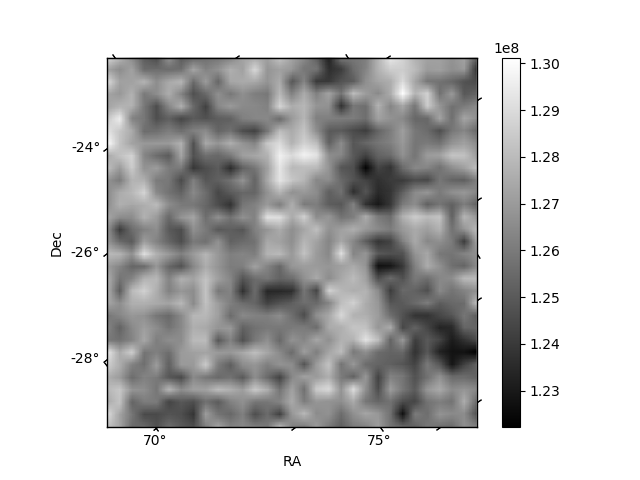
Quadrant B |
|---|---|---|---|
| Quadrant D | 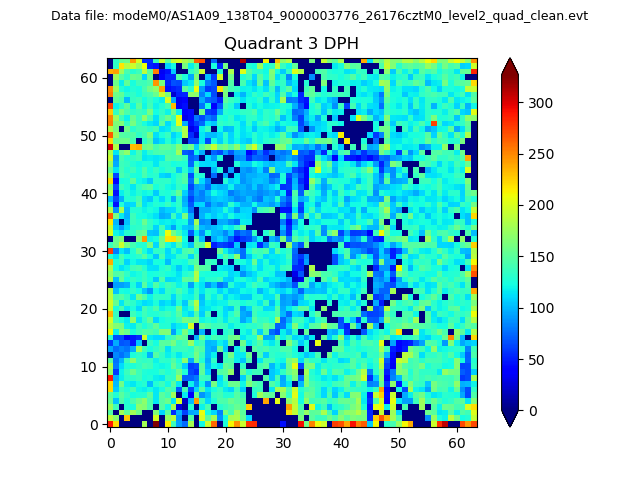 |
 |
Quadrant C |
| Plot type | Count rate plots | Images |
|---|---|---|
| Comparison with Poisson distribution Blue bars denote a histogram of data divided into 1 sec bins. Red curve is a Poisson curve with rate = median count rate of data. |
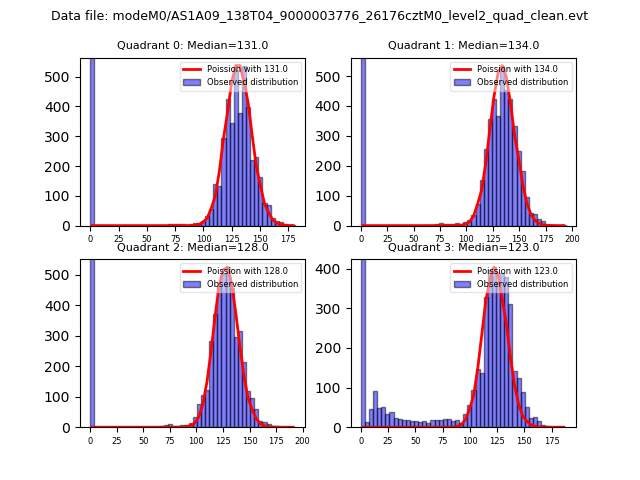 |
 |
| Quadrant-wise count rates Data is divided into 100 sec bins |
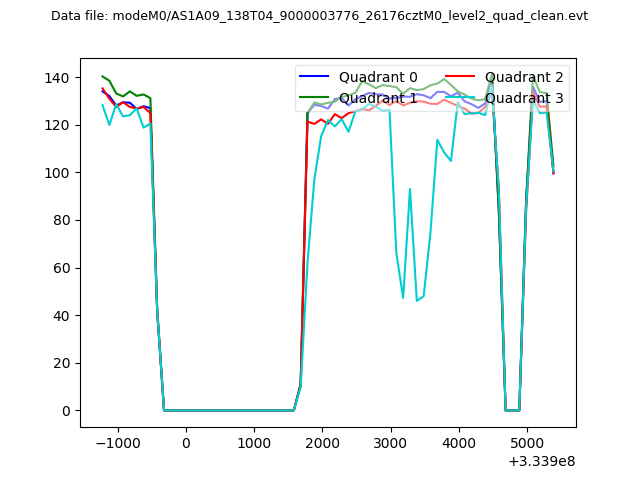 |
|
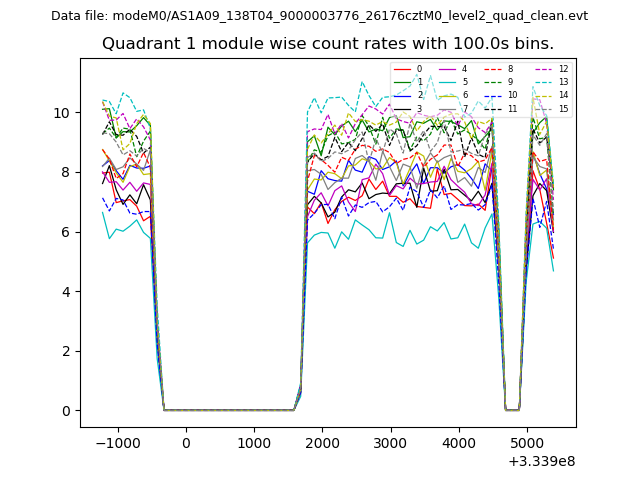
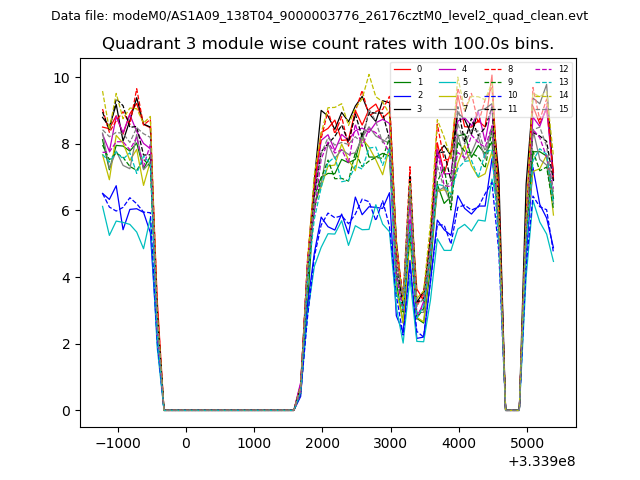
| Module-wise count rates for Quadrant A Data is divided into 100 sec bins |
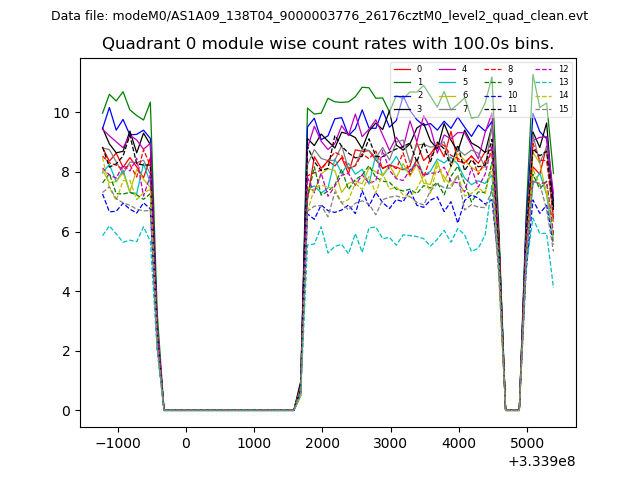 |
 |
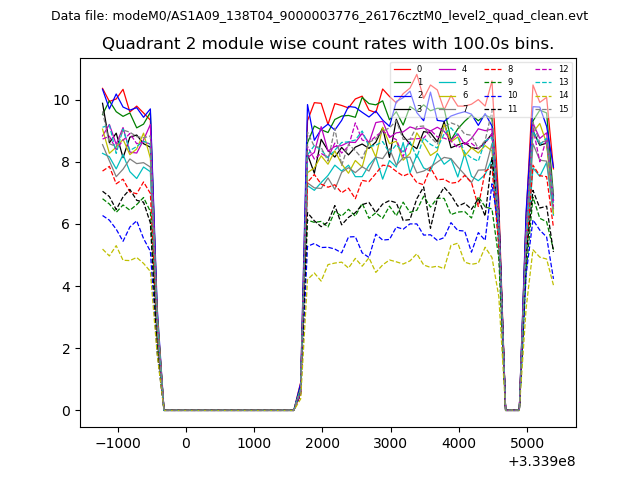
| Module-wise count rates for Quadrant B Data is divided into 100 sec bins |
 |
 |
| Module-wise count rates for Quadrant C Data is divided into 100 sec bins |
 |
 |
| Module-wise count rates for Quadrant D Data is divided into 100 sec bins |
 |
 |
| Parameter | Plot |
|---|---|
| CZT HV Monitor | 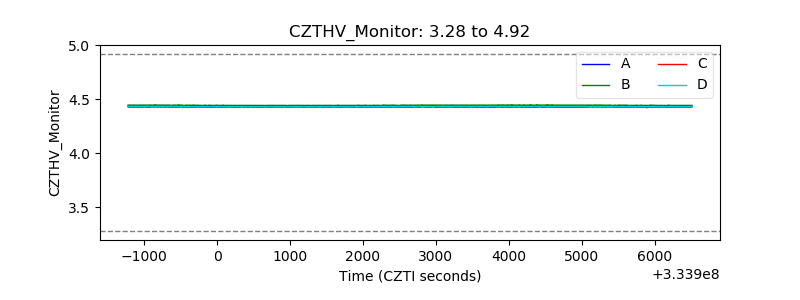 |
| D_VDD | 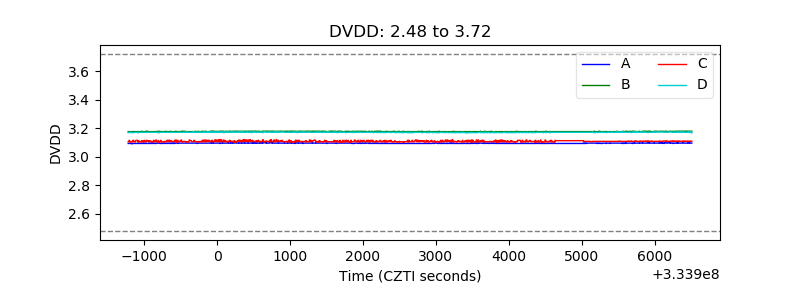 |
| Temperature 1 | 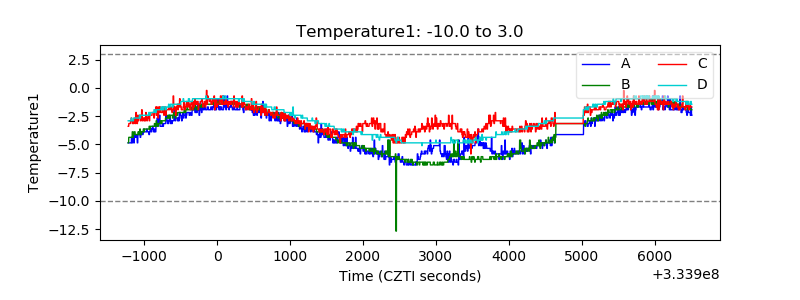 |
| Veto HV Monitor | 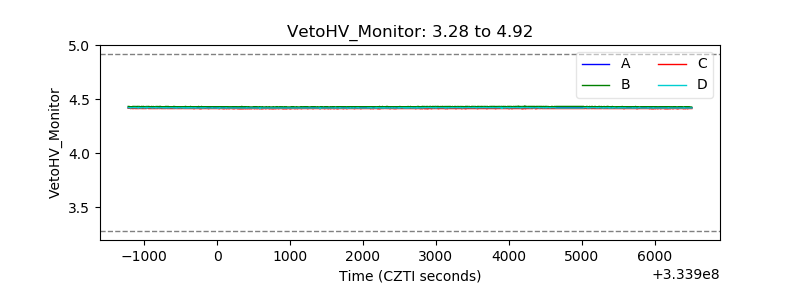 |
| Veto LLD | 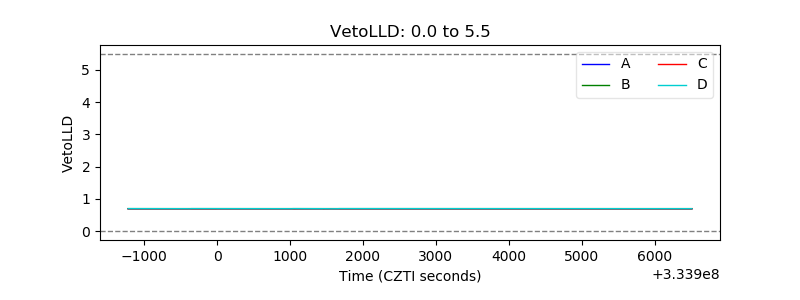 |
| Alpha Counter | 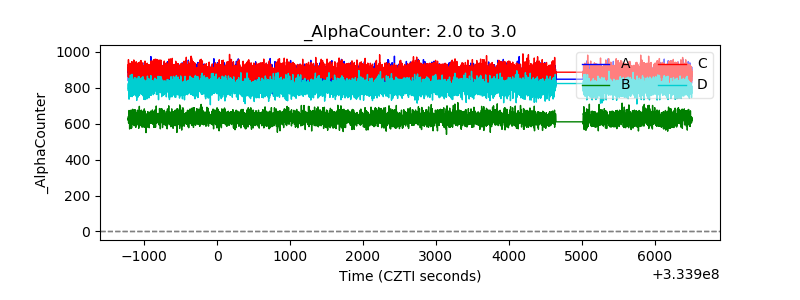 |
| _CPM_Rate | 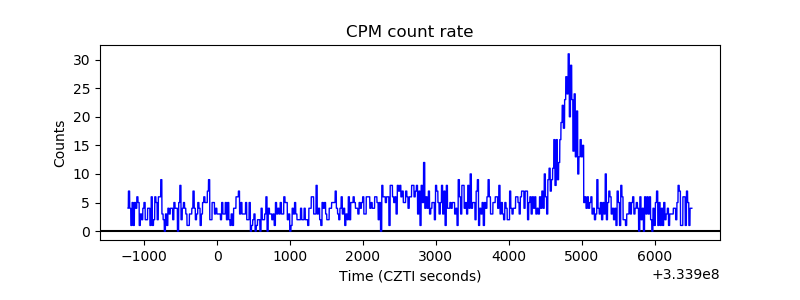 |
| CZT Counter | 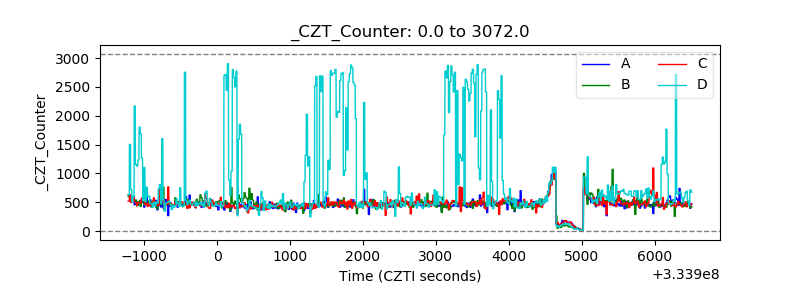 |
| +2.5 Volts monitor |  |
| +5 Volts monitor |  |
| _ROLL_ROT | 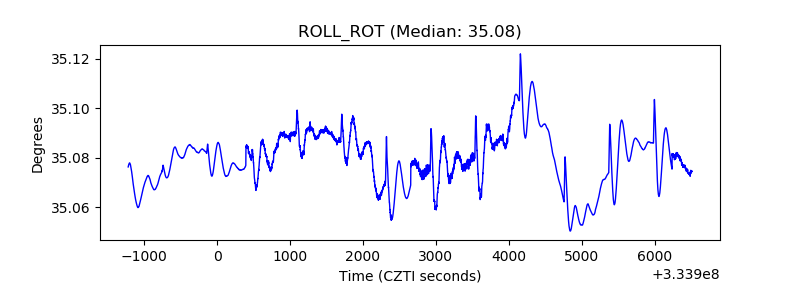 |
| _Roll_DEC | 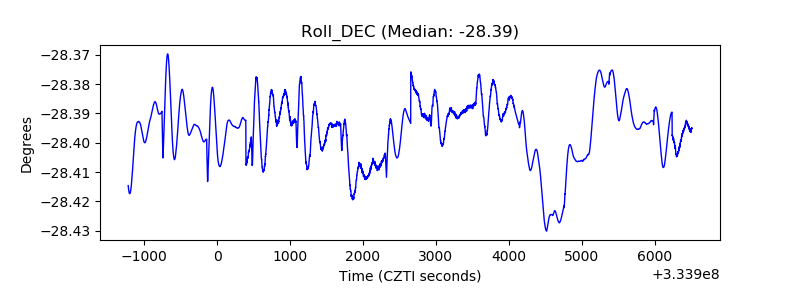 |
| _Roll_RA | 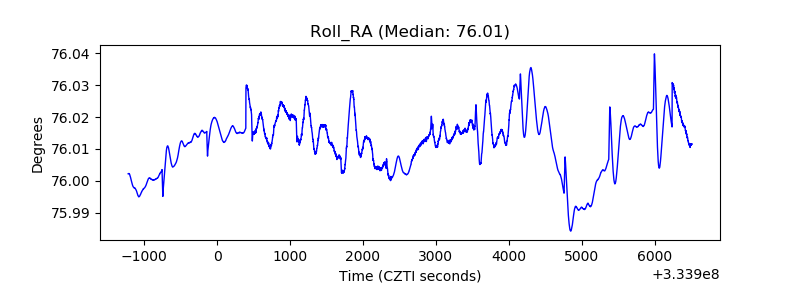 |
| Veto Counter | 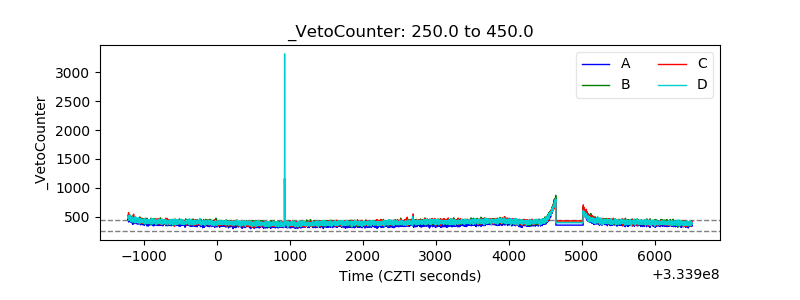 |