| Param | Original file | Final file |
|---|---|---|
| Filename | modeM0/AS1A09_138T04_9000003776_26178cztM0_level2.evt | modeM0/AS1A09_138T04_9000003776_26178cztM0_level2_quad_clean.evt |
| Size (bytes) | 817,395,840 | 143,614,080 |
| Size | 779.5 MB | 137.0 MB |
| Events in quadrant A | 5,323,004 | 906,271 |
| Events in quadrant B | 5,630,919 | 922,558 |
| Events in quadrant C | 5,458,039 | 877,544 |
| Events in quadrant D | 7,574,862 | 857,948 |
| Mode M9 | |||
|---|---|---|---|
| Quadrant | BADHDUFLAG | Total packets | Discarded packets |
| A | 0 | 7 | 0 |
| B | 0 | 7 | 0 |
| C | 0 | 7 | 0 |
| D | 0 | 7 | 0 |
| Mode M0 | |||
|---|---|---|---|
| Quadrant | BADHDUFLAG | Total packets | Discarded packets |
| A | 0 | 23128 | 0 |
| B | 0 | 23960 | 0 |
| C | 0 | 23296 | 0 |
| D | 0 | 29934 | 0 |
| Quadrant | Total seconds | Saturated seconds | Saturation percentage |
|---|---|---|---|
| A | 11346 | 114 | 1.004759% |
| B | 11347 | 206 | 1.815458% |
| C | 11347 | 156 | 1.374813% |
| D | 11347 | 457 | 4.027496% |
Noise dominated data is calculated using 1-second bins in cleaned event files. If a bin has >2000 counts, and if more than 50% of those come from <1% of pixels, then it is considered to be noise-dominated and hence unusable.
| Quadrant | # 1 sec bins | Bins with >0 counts | Bins with >2000 counts | High rate bins dominated by noise | Noise dominated (total time) | Noise dominated (detector-on time) | Marked lightcurve |
|---|---|---|---|---|---|---|---|
| A | 11846 | 11347 | 0 | 0 | 0.00% | 0.00% | 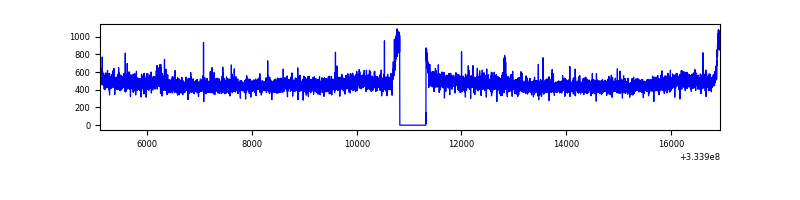 |
| B | 11847 | 11348 | 56 | 56 | 0.47% | 0.49% | 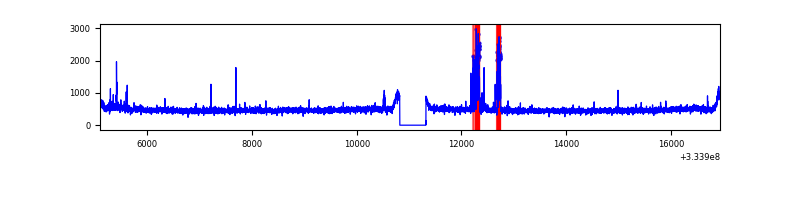 |
| C | 11847 | 11348 | 0 | 0 | 0.00% | 0.00% | 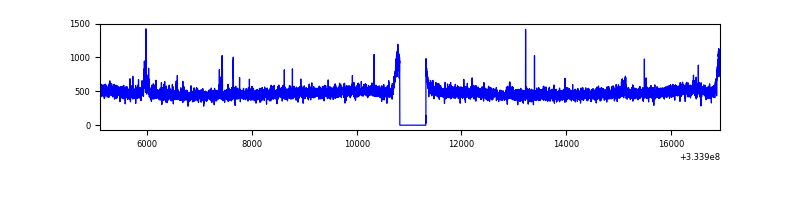 |
| D | 11847 | 11348 | 366 | 366 | 3.09% | 3.23% | 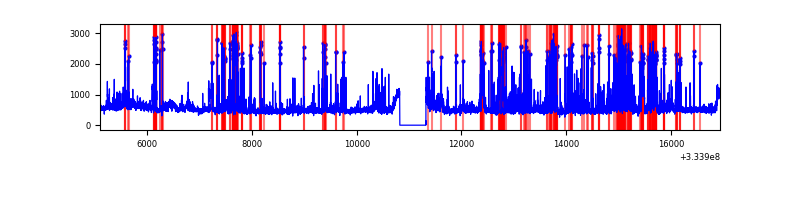 |
Top three noisy pixels from each quadrant. If the there are fewer than three noisy pixels in the level2.evt file, extra rows are filled as -1
| Pixel properties | Quadrant properties | ||||||
|---|---|---|---|---|---|---|---|
| Quadrant | DetID | PixID | Counts | Sigma | Mean | Median | Sigma |
| A | 13 | 254 | 18862 | 63.59 | 1372 | 1344 | 275.5 |
| A | 11 | 29 | 15171 | 50.19 | 1372 | 1344 | 275.5 |
| A | 3 | 137 | 12925 | 42.04 | 1372 | 1344 | 275.5 |
| B | 5 | 172 | 237749 | 909.41 | 1357 | 1324 | 260.0 |
| B | 0 | 230 | 46057 | 172.07 | 1357 | 1324 | 260.0 |
| B | 12 | 111 | 31680 | 116.76 | 1357 | 1324 | 260.0 |
| C | 14 | 238 | 209534 | 668.9 | 1319 | 1330 | 311.3 |
| C | 3 | 233 | 109279 | 346.81 | 1319 | 1330 | 311.3 |
| C | 13 | 61 | 8975 | 24.56 | 1319 | 1330 | 311.3 |
| D | 1 | 52 | 2372908 | 7561.82 | 1322 | 1294 | 313.6 |
| D | 12 | 233 | 130545 | 412.11 | 1322 | 1294 | 313.6 |
| D | 2 | 234 | 56681 | 176.6 | 1322 | 1294 | 313.6 |
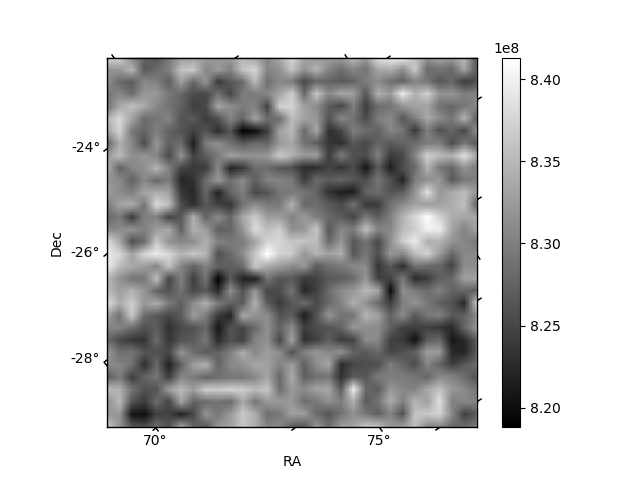
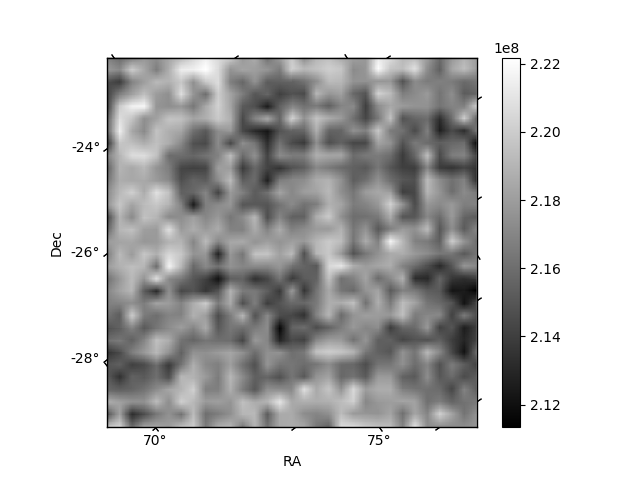
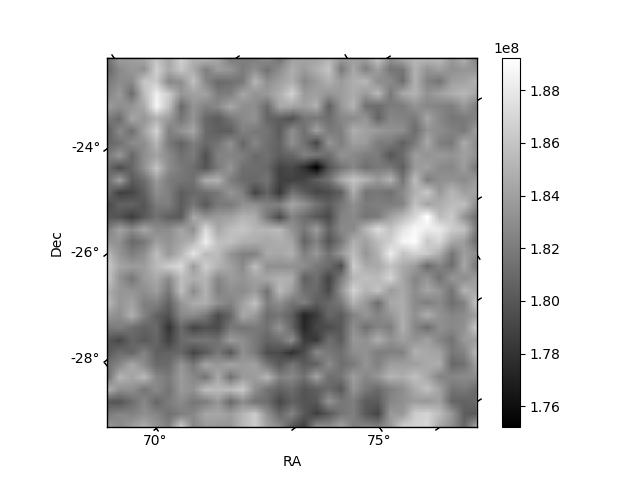
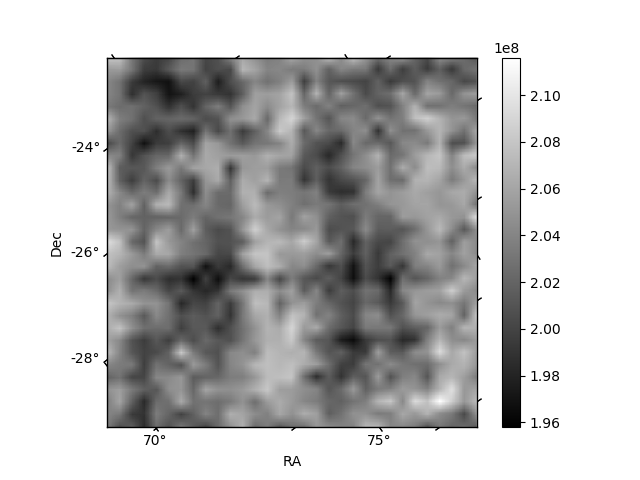
Histogram calculated using DETX and DETY for each event in the final _common_clean file
| Quadrant A | 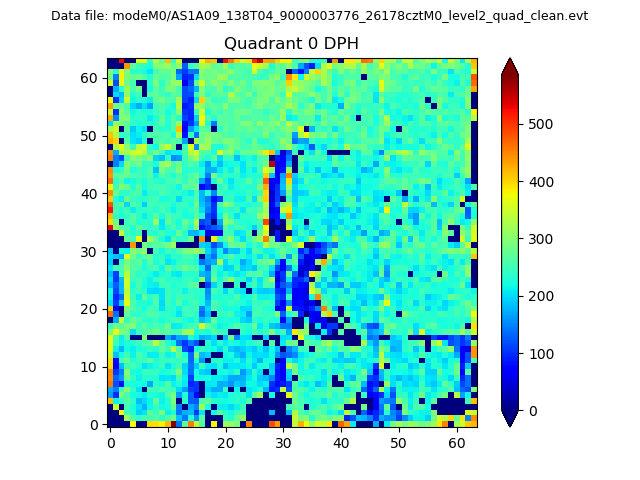 |
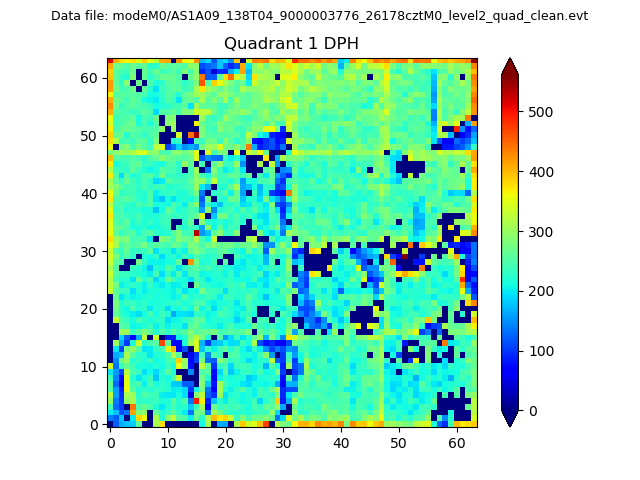 |
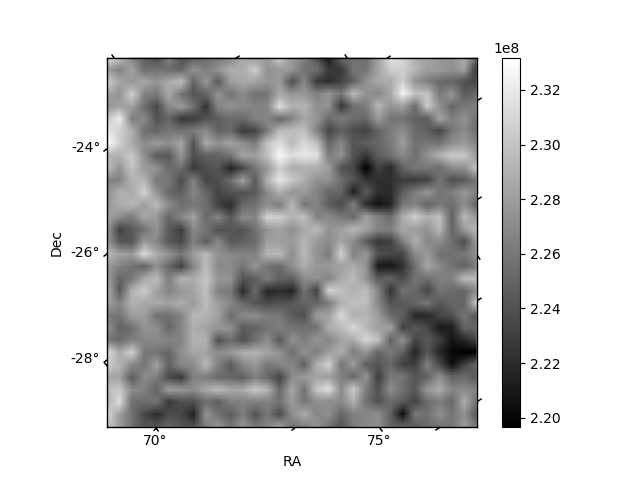
Quadrant B |
|---|---|---|---|
| Quadrant D | 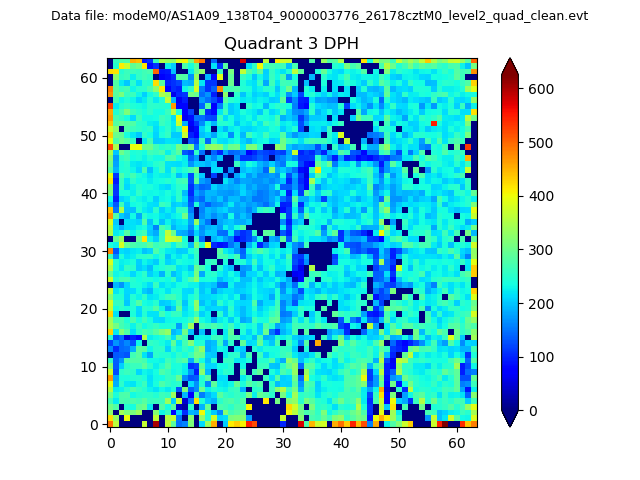 |
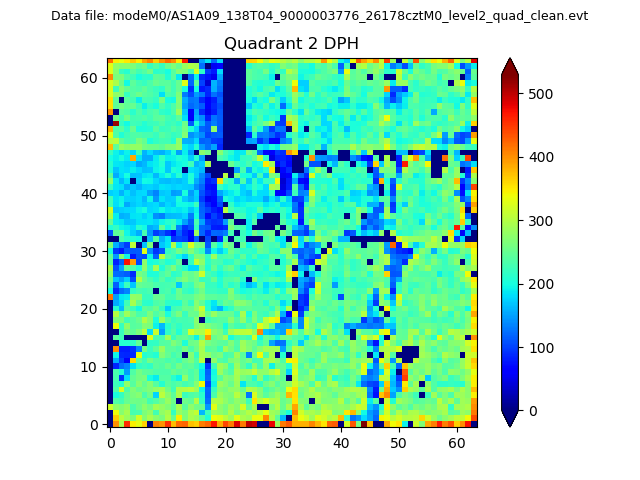 |
Quadrant C |
| Plot type | Count rate plots | Images |
|---|---|---|
| Comparison with Poisson distribution Blue bars denote a histogram of data divided into 1 sec bins. Red curve is a Poisson curve with rate = median count rate of data. |
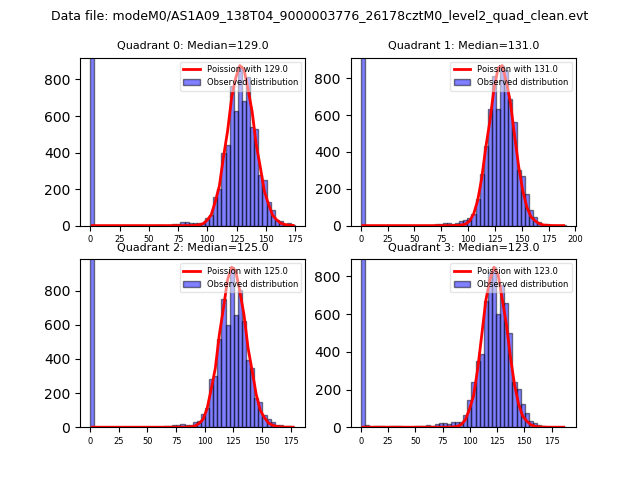 |
 |
| Quadrant-wise count rates Data is divided into 100 sec bins |
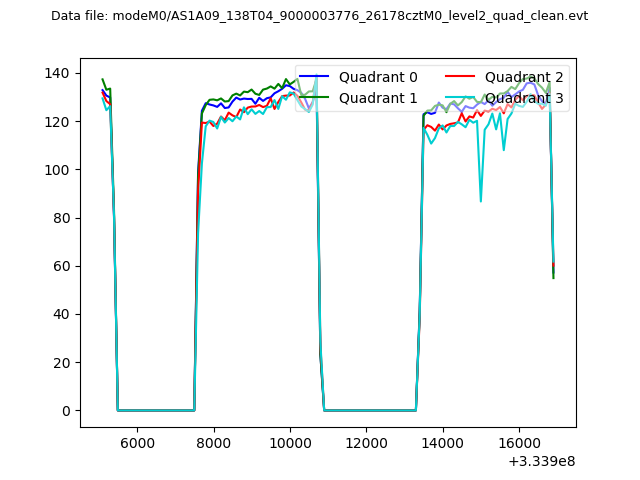 |
|
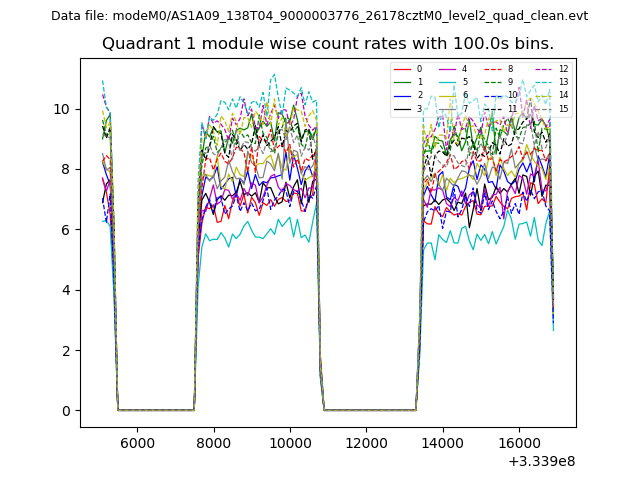
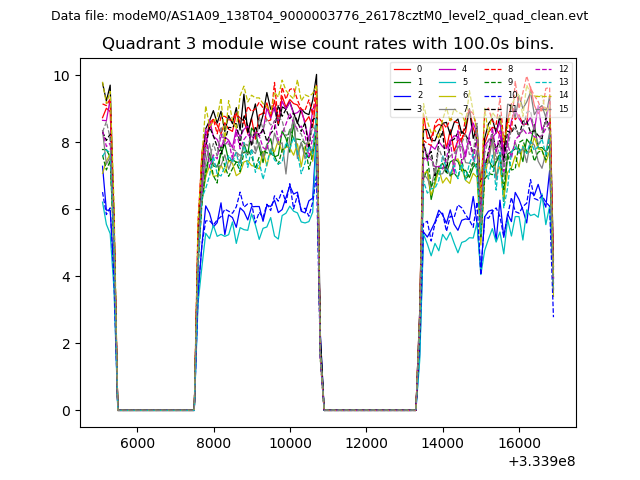
| Module-wise count rates for Quadrant A Data is divided into 100 sec bins |
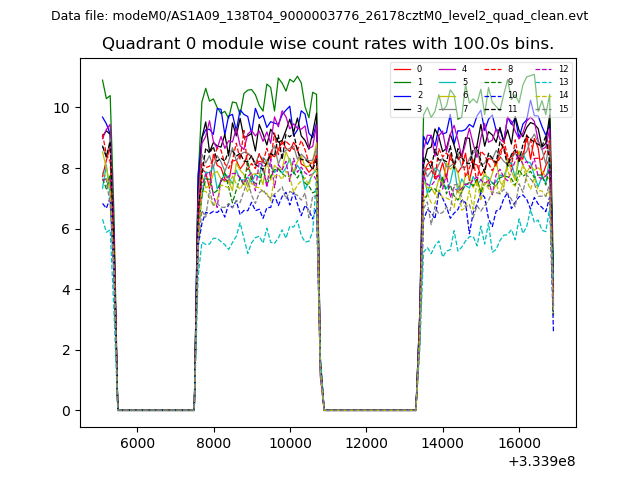 |
 |
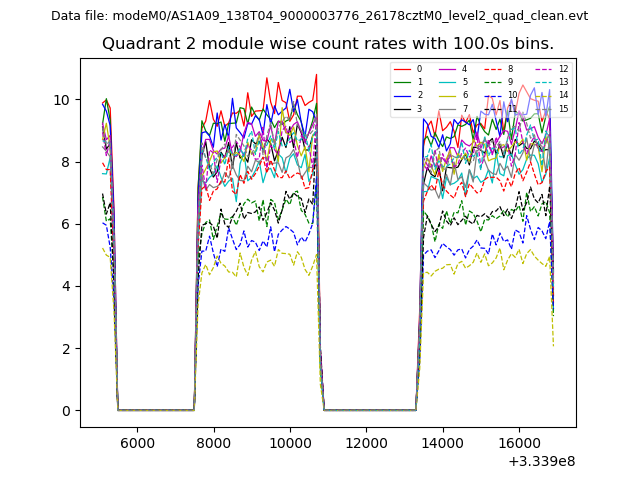
| Module-wise count rates for Quadrant B Data is divided into 100 sec bins |
 |
 |
| Module-wise count rates for Quadrant C Data is divided into 100 sec bins |
 |
 |
| Module-wise count rates for Quadrant D Data is divided into 100 sec bins |
 |
 |
| Parameter | Plot |
|---|---|
| CZT HV Monitor | 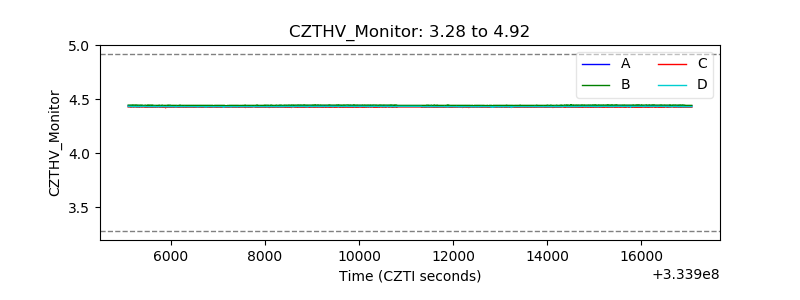 |
| D_VDD | 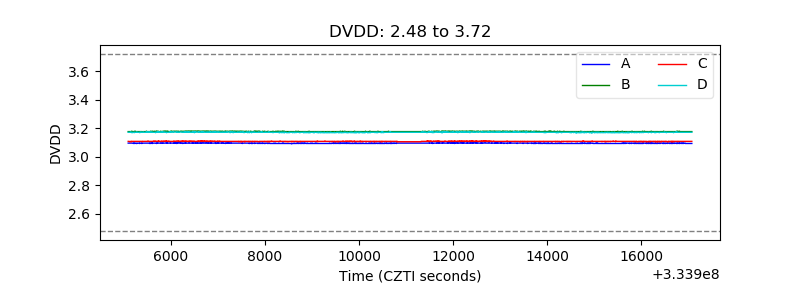 |
| Temperature 1 | 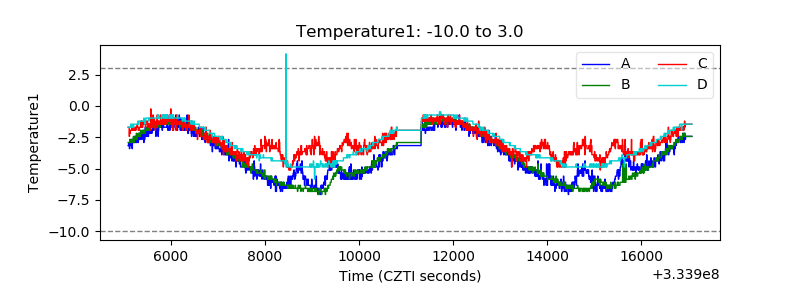 |
| Veto HV Monitor |  |
| Veto LLD | 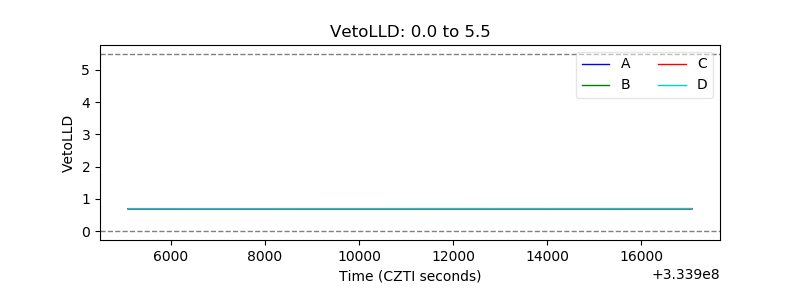 |
| Alpha Counter | 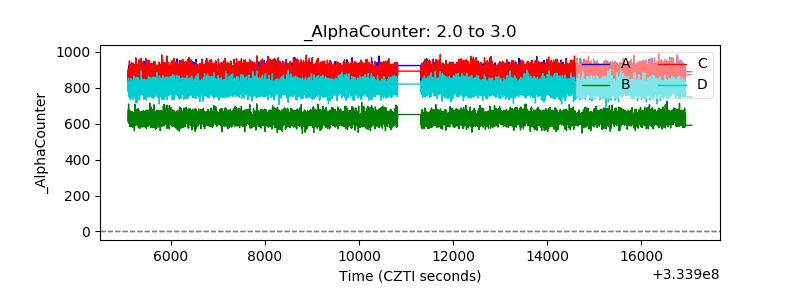 |
| _CPM_Rate | 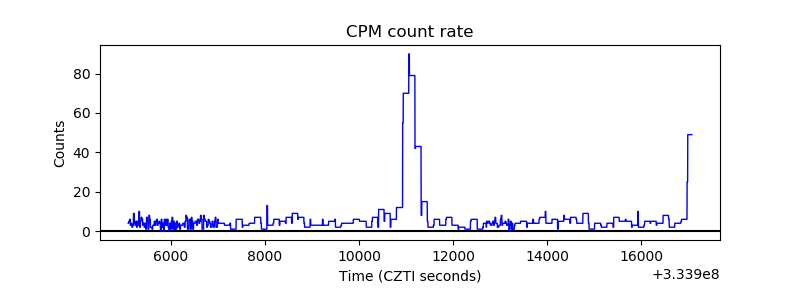 |
| CZT Counter | 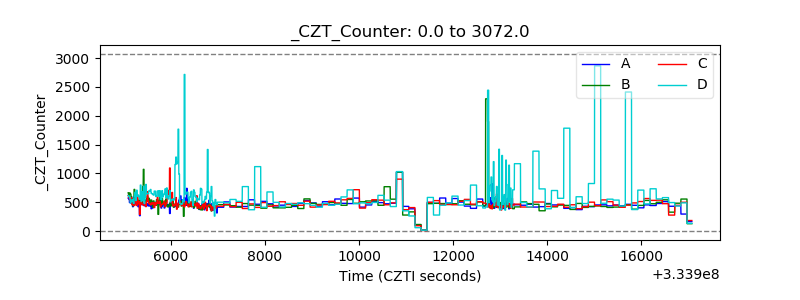 |
| +2.5 Volts monitor | 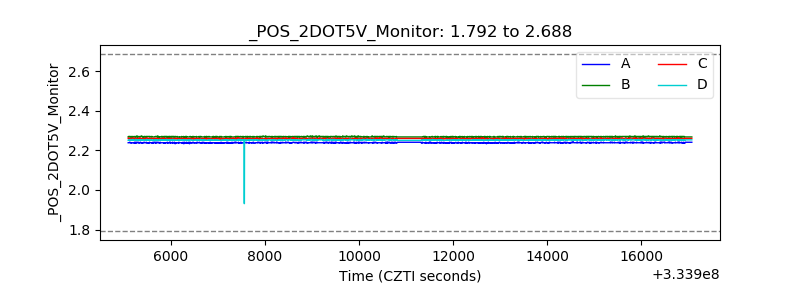 |
| +5 Volts monitor |  |
| _ROLL_ROT | 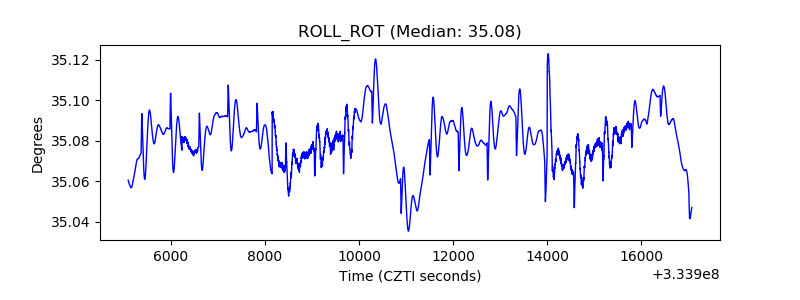 |
| _Roll_DEC | 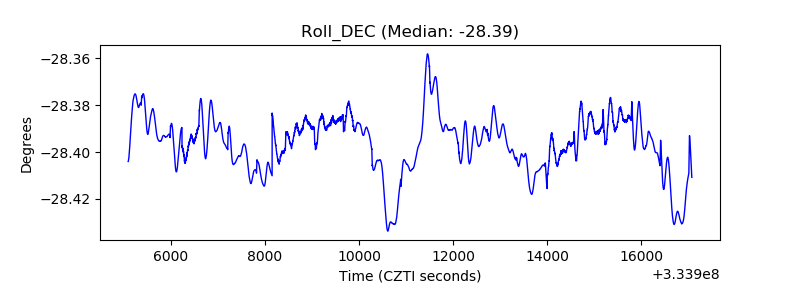 |
| _Roll_RA | 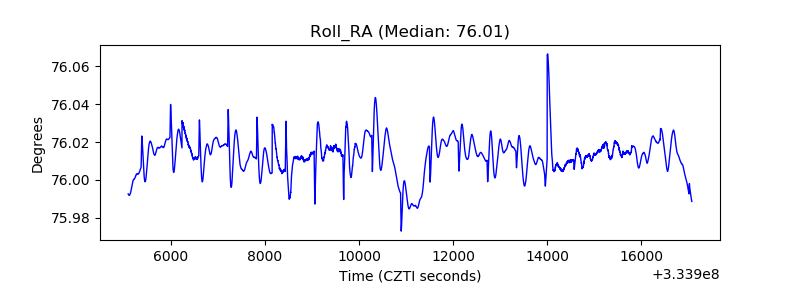 |
| Veto Counter | 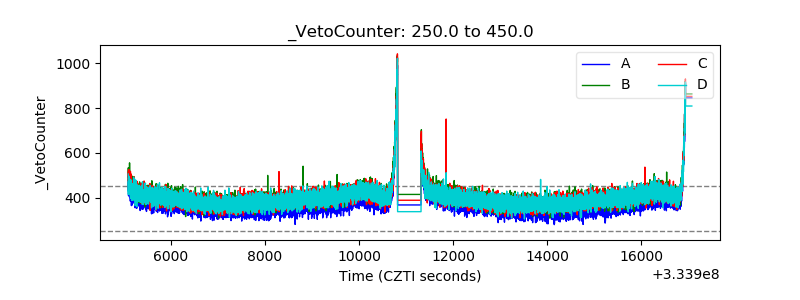 |