| Param | Original file | Final file |
|---|---|---|
| Filename | modeM0/AS1A09_012T01_9000003778cztM0_level2.fits | modeM0/AS1A09_012T01_9000003778cztM0_level2_quad_clean.evt |
| Size (bytes) | 88,813,440 | 77,454,720 |
| Size | 84.7 MB | 73.9 MB |
| Events in quadrant A | 544,416 | 446,887 |
| Events in quadrant B | 522,448 | 448,323 |
| Events in quadrant C | 533,112 | 429,843 |
| Events in quadrant D | 454,734 | 384,531 |
| Mode M0 | |||
|---|---|---|---|
| Quadrant | BADHDUFLAG | Total packets | Discarded packets |
| A | 0 | 18666 | 0 |
| B | 0 | 19223 | 0 |
| C | 0 | 19044 | 0 |
| D | 0 | 27065 | 0 |
| Mode M9 | |||
|---|---|---|---|
| Quadrant | BADHDUFLAG | Total packets | Discarded packets |
| A | 0 | 19 | 0 |
| B | 0 | 19 | 0 |
| C | 0 | 19 | 0 |
| D | 0 | 19 | 0 |
| Mode SS | |||
|---|---|---|---|
| Quadrant | BADHDUFLAG | Total packets | Discarded packets |
| A | 0 | 188 | 0 |
| B | 0 | 188 | 0 |
| C | 0 | 188 | 0 |
| D | 0 | 188 | 0 |
| Quadrant | Total seconds | Saturated seconds | Saturation percentage |
|---|---|---|---|
| A | 9151 | 34 | 0.371544% |
| B | 9151 | 66 | 0.721233% |
| C | 9151 | 125 | 1.365971% |
| D | 9151 | 496 | 5.420173% |
Noise dominated data is calculated using 1-second bins in cleaned event files. If a bin has >2000 counts, and if more than 50% of those come from <1% of pixels, then it is considered to be noise-dominated and hence unusable.
| Quadrant | # 1 sec bins | Bins with >0 counts | Bins with >2000 counts | High rate bins dominated by noise | Noise dominated (total time) | Noise dominated (detector-on time) | Marked lightcurve |
|---|---|---|---|---|---|---|---|
| A | 11015 | 9150 | 0 | 0 | 0.00% | 0.00% |  |
| B | 11016 | 9151 | 0 | 0 | 0.00% | 0.00% |  |
| C | 11016 | 9150 | 0 | 0 | 0.00% | 0.00% |  |
| D | 11016 | 9146 | 0 | 0 | 0.00% | 0.00% |  |
Top three noisy pixels from each quadrant. If the there are fewer than three noisy pixels in the level2.evt file, extra rows are filled as -1
| Pixel properties | Quadrant properties | ||||||
|---|---|---|---|---|---|---|---|
| Quadrant | DetID | PixID | Counts | Sigma | Mean | Median | Sigma |
| A | 0 | 29 | 457 | 8.85 | 141 | 133 | 36.6 |
| A | 0 | 30 | 437 | 8.31 | 141 | 133 | 36.6 |
| A | 7 | 110 | 426 | 8.01 | 141 | 133 | 36.6 |
| B | 2 | 9 | 459 | 11.08 | 138 | 132 | 29.5 |
| B | 3 | 80 | 377 | 8.3 | 138 | 132 | 29.5 |
| B | 5 | 128 | 360 | 7.73 | 138 | 132 | 29.5 |
| C | 12 | 241 | 400 | 7.1 | 141 | 133 | 37.6 |
| C | 12 | 250 | 379 | 6.55 | 141 | 133 | 37.6 |
| C | 2 | 191 | 364 | 6.15 | 141 | 133 | 37.6 |
| D | 7 | 3 | 332 | 6.01 | 129 | 118 | 35.6 |
| D | 6 | 231 | 331 | 5.98 | 129 | 118 | 35.6 |
| D | 6 | 62 | 330 | 5.95 | 129 | 118 | 35.6 |
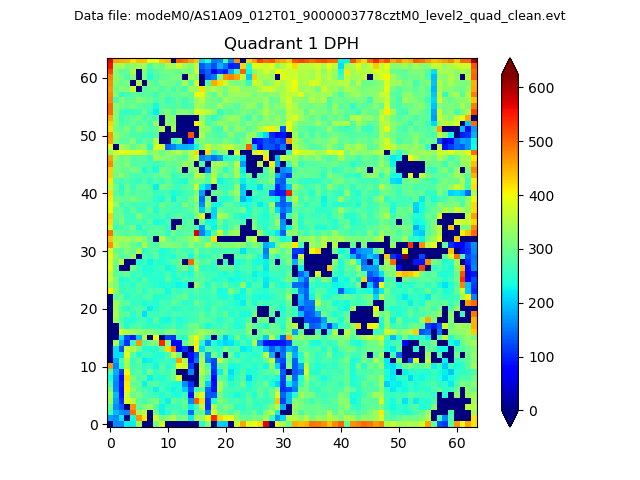
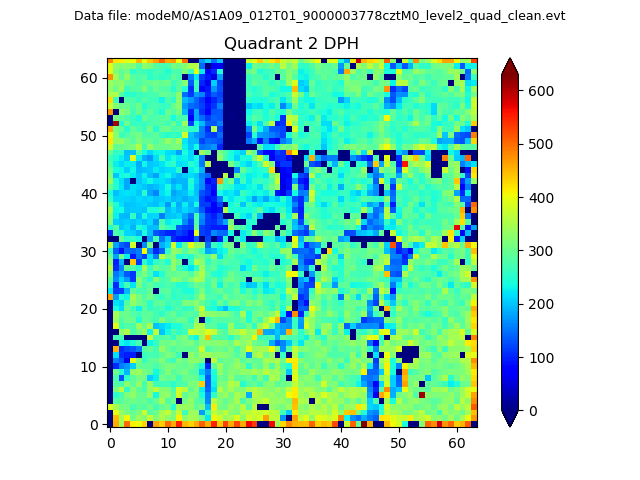
Histogram calculated using DETX and DETY for each event in the final _common_clean file
| Quadrant A |  |
 |
Quadrant B |
|---|---|---|---|
| Quadrant D | 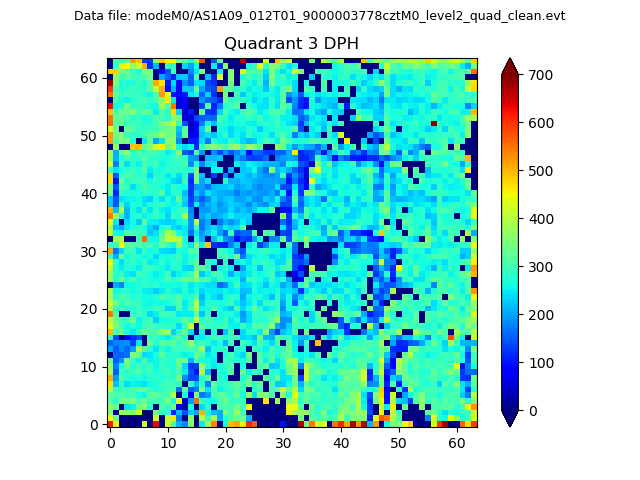 |
 |
Quadrant C |
| Plot type | Count rate plots | Images |
|---|---|---|
| Comparison with Poisson distribution Blue bars denote a histogram of data divided into 1 sec bins. Red curve is a Poisson curve with rate = median count rate of data. |
 |
 |
| Quadrant-wise count rates Data is divided into 100 sec bins |
 |
|
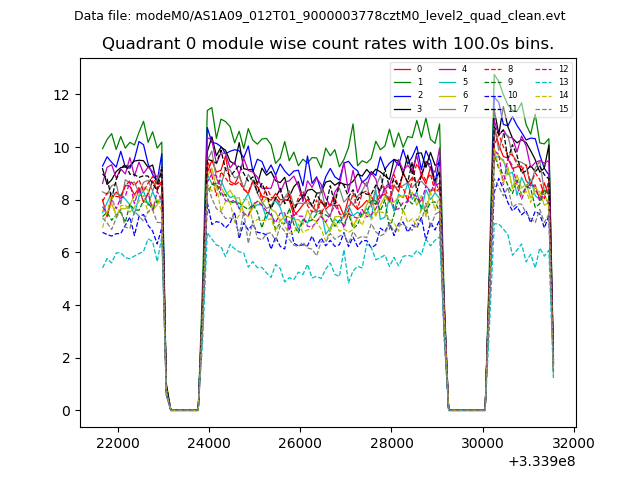
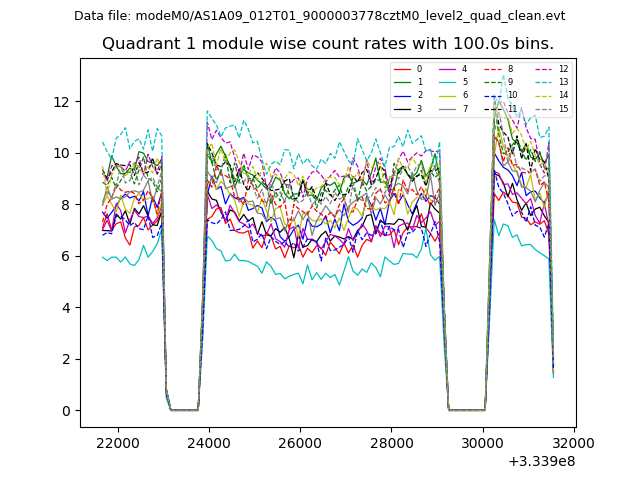
| Module-wise count rates for Quadrant A Data is divided into 100 sec bins |
 |
 |
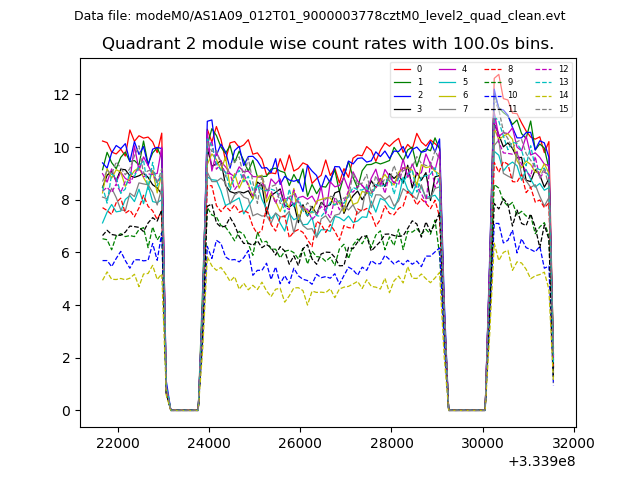
| Module-wise count rates for Quadrant B Data is divided into 100 sec bins |
 |
 |
| Module-wise count rates for Quadrant C Data is divided into 100 sec bins |
 |
 |
| Module-wise count rates for Quadrant D Data is divided into 100 sec bins |
 |
 |
| Parameter | Plot |
|---|---|
| CZT HV Monitor |  |
| D_VDD |  |
| Temperature 1 |  |
| Veto HV Monitor |  |
| Veto LLD |  |
| Alpha Counter | 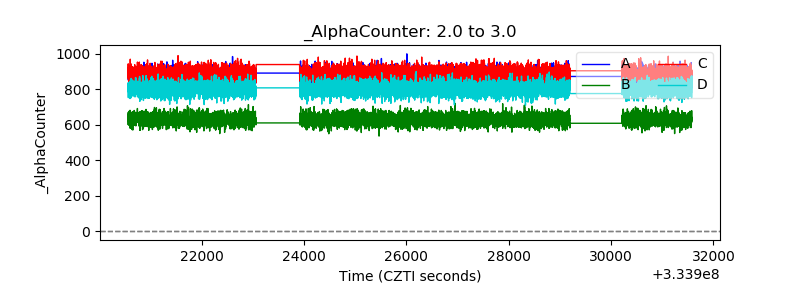 |
| _CPM_Rate | 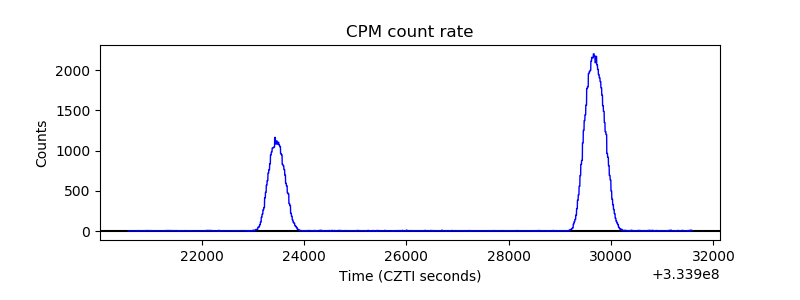 |
| CZT Counter |  |
| +2.5 Volts monitor | 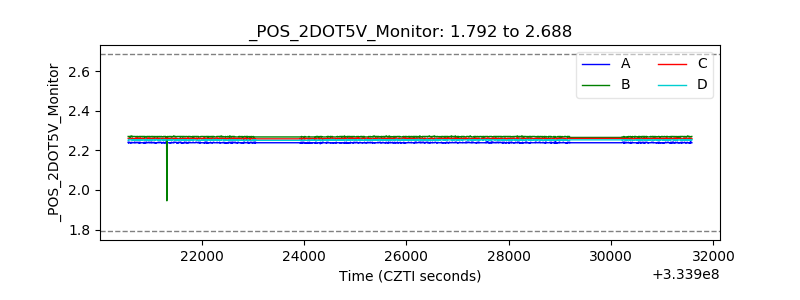 |
| +5 Volts monitor | 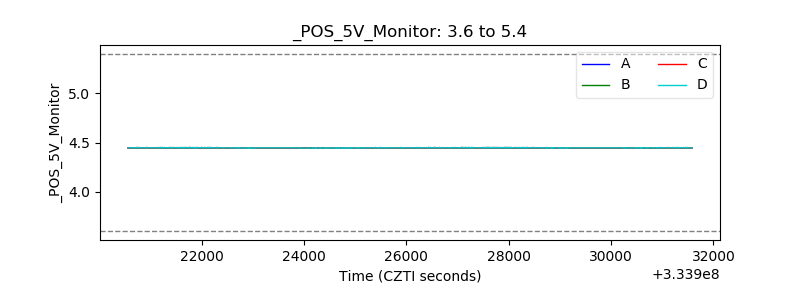 |
| _ROLL_ROT | 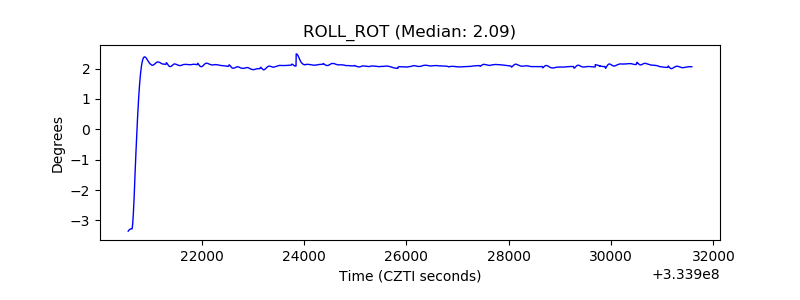 |
| _Roll_DEC |  |
| _Roll_RA | 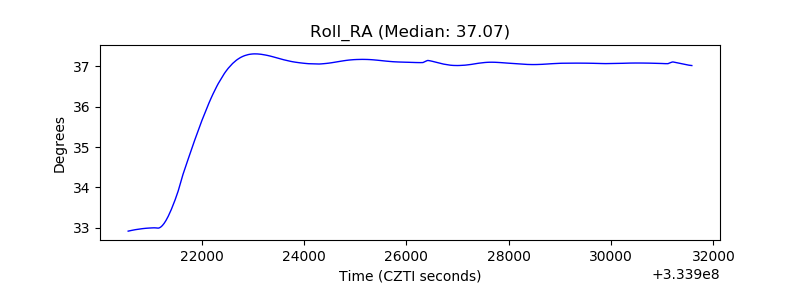 |
| Veto Counter |  |