| Param | Original file | Final file |
|---|---|---|
| Filename | modeM0/AS1A09_012T01_9000003778_26179cztM0_level2.evt | modeM0/AS1A09_012T01_9000003778_26179cztM0_level2_quad_clean.evt |
| Size (bytes) | 316,157,760 | 74,217,600 |
| Size | 301.5 MB | 70.8 MB |
| Events in quadrant A | 1,897,990 | 498,858 |
| Events in quadrant B | 1,991,567 | 509,409 |
| Events in quadrant C | 2,016,987 | 493,114 |
| Events in quadrant D | 3,398,397 | 466,821 |
| Mode M0 | |||
|---|---|---|---|
| Quadrant | BADHDUFLAG | Total packets | Discarded packets |
| A | 0 | 8115 | 0 |
| B | 0 | 8418 | 0 |
| C | 0 | 8359 | 0 |
| D | 0 | 12746 | 0 |
| Mode M9 | |||
|---|---|---|---|
| Quadrant | BADHDUFLAG | Total packets | Discarded packets |
| A | 0 | 9 | 0 |
| B | 0 | 9 | 0 |
| C | 0 | 9 | 0 |
| D | 0 | 9 | 0 |
| Quadrant | Total seconds | Saturated seconds | Saturation percentage |
|---|---|---|---|
| A | 3962 | 21 | 0.530035% |
| B | 3962 | 43 | 1.085310% |
| C | 3962 | 74 | 1.867744% |
| D | 3962 | 297 | 7.496214% |
Noise dominated data is calculated using 1-second bins in cleaned event files. If a bin has >2000 counts, and if more than 50% of those come from <1% of pixels, then it is considered to be noise-dominated and hence unusable.
| Quadrant | # 1 sec bins | Bins with >0 counts | Bins with >2000 counts | High rate bins dominated by noise | Noise dominated (total time) | Noise dominated (detector-on time) | Marked lightcurve |
|---|---|---|---|---|---|---|---|
| A | 4812 | 3963 | 0 | 0 | 0.00% | 0.00% | 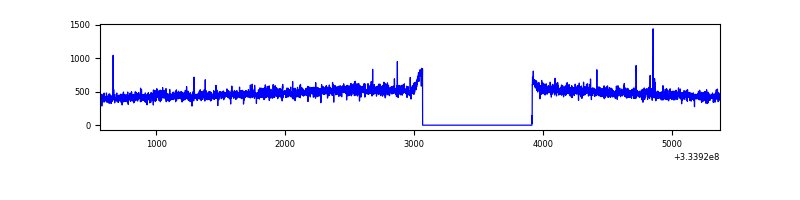 |
| B | 4812 | 3963 | 2 | 2 | 0.04% | 0.05% | 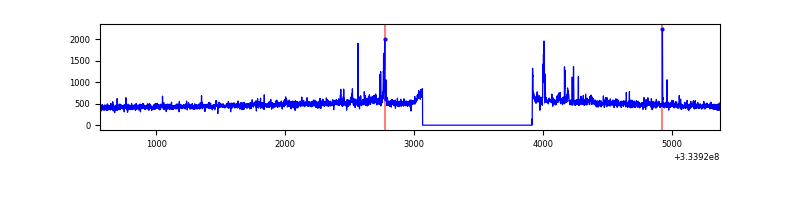 |
| C | 4812 | 3963 | 8 | 8 | 0.17% | 0.20% | 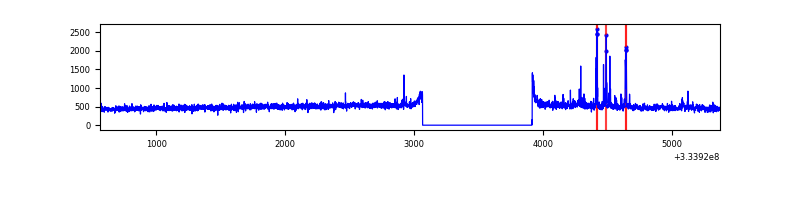 |
| D | 4812 | 3963 | 257 | 257 | 5.34% | 6.48% | 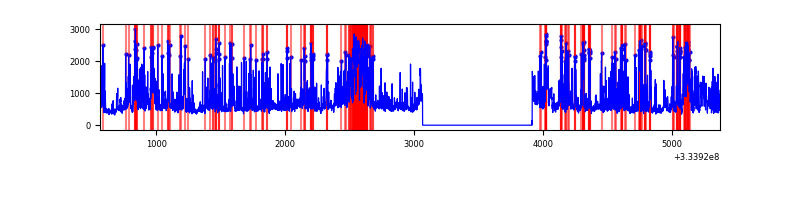 |
Top three noisy pixels from each quadrant. If the there are fewer than three noisy pixels in the level2.evt file, extra rows are filled as -1
| Pixel properties | Quadrant properties | ||||||
|---|---|---|---|---|---|---|---|
| Quadrant | DetID | PixID | Counts | Sigma | Mean | Median | Sigma |
| A | 13 | 254 | 6709 | 62.5 | 490 | 479 | 99.7 |
| A | 5 | 98 | 5311 | 48.48 | 490 | 479 | 99.7 |
| A | 3 | 137 | 4580 | 41.14 | 490 | 479 | 99.7 |
| B | 0 | 190 | 48544 | 515.08 | 485 | 472 | 93.3 |
| B | 5 | 172 | 20806 | 217.87 | 485 | 472 | 93.3 |
| B | 12 | 111 | 11340 | 116.44 | 485 | 472 | 93.3 |
| C | 14 | 238 | 76232 | 680.08 | 472 | 475 | 111.4 |
| C | 2 | 16 | 64852 | 577.92 | 472 | 475 | 111.4 |
| C | 3 | 233 | 34131 | 302.13 | 472 | 475 | 111.4 |
| D | 1 | 52 | 1326860 | 11456.61 | 464 | 453 | 115.8 |
| D | 12 | 233 | 288988 | 2492.17 | 464 | 453 | 115.8 |
| D | 2 | 234 | 19041 | 160.55 | 464 | 453 | 115.8 |
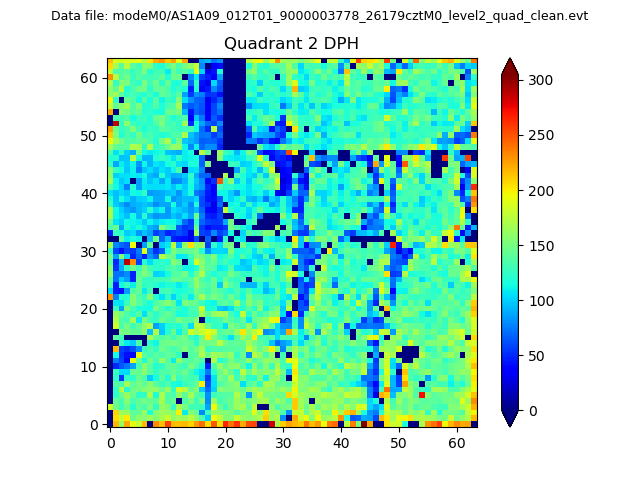
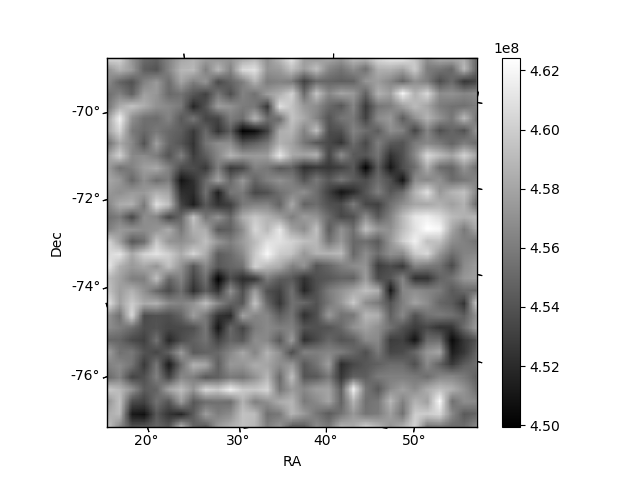
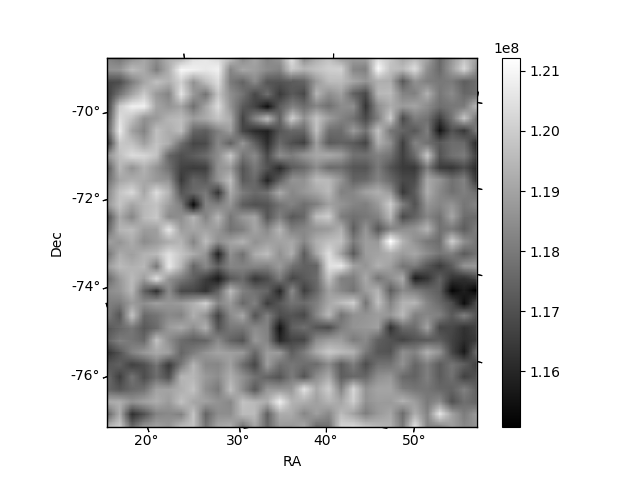
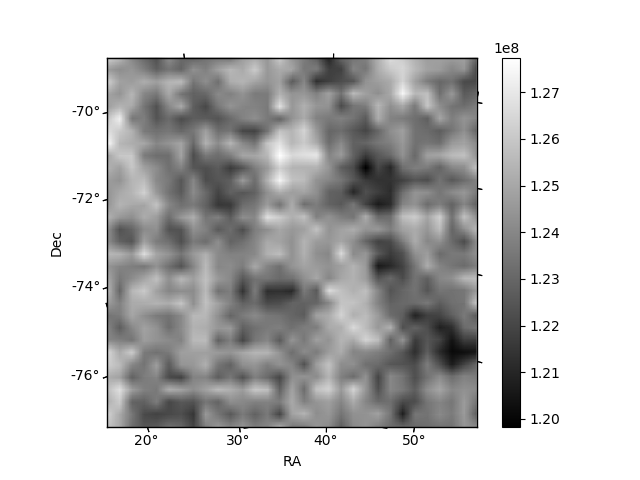
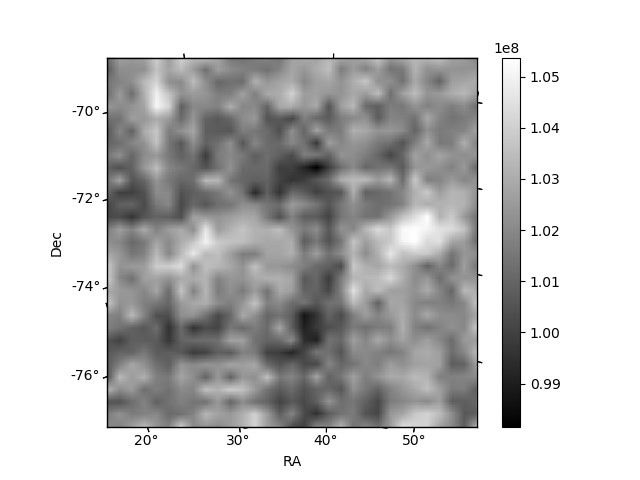
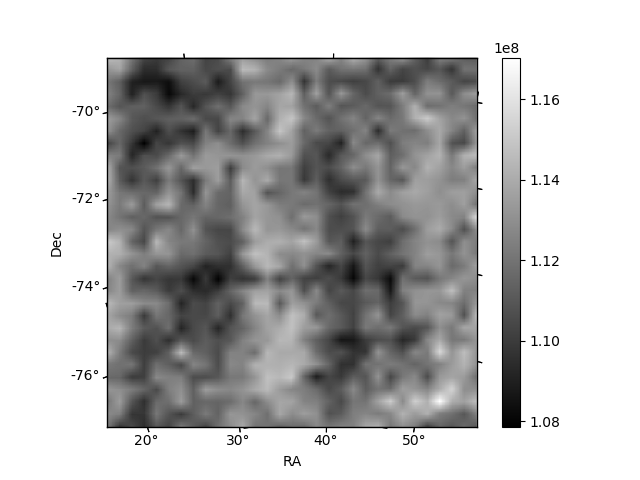
Histogram calculated using DETX and DETY for each event in the final _common_clean file
| Quadrant A | 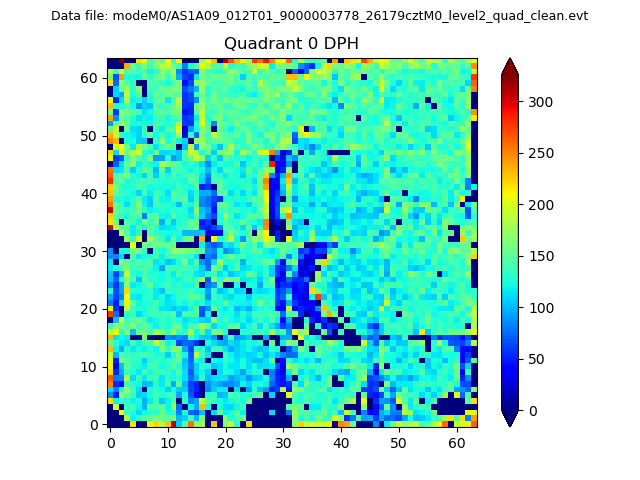 |
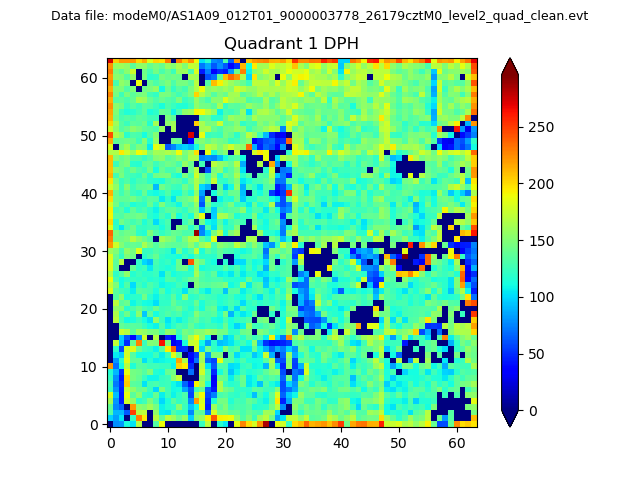 |
Quadrant B |
|---|---|---|---|
| Quadrant D | 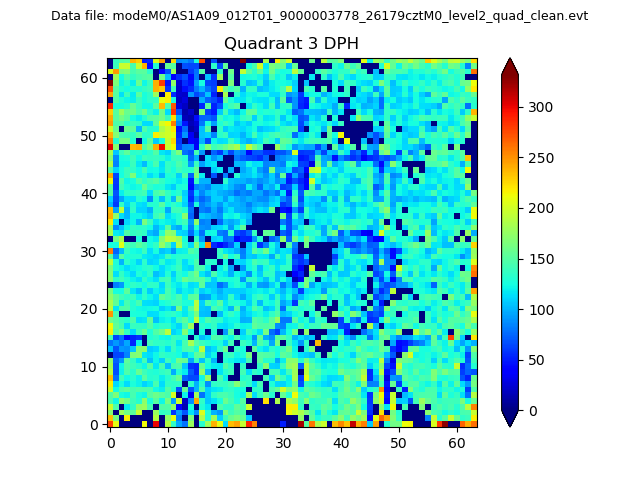 |
 |
Quadrant C |
| Plot type | Count rate plots | Images |
|---|---|---|
| Comparison with Poisson distribution Blue bars denote a histogram of data divided into 1 sec bins. Red curve is a Poisson curve with rate = median count rate of data. |
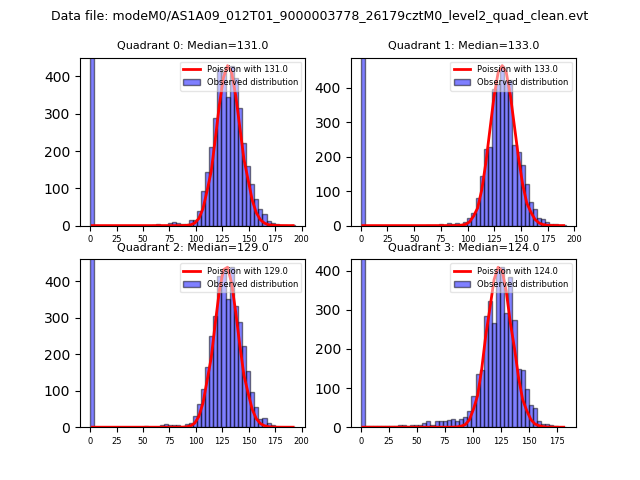 |
 |
| Quadrant-wise count rates Data is divided into 100 sec bins |
 |
|
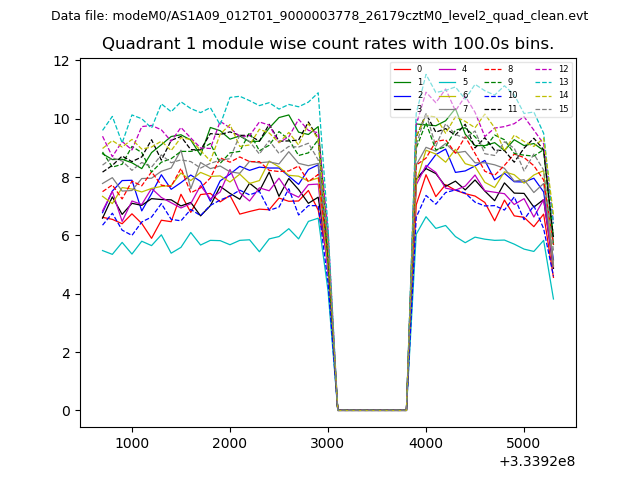
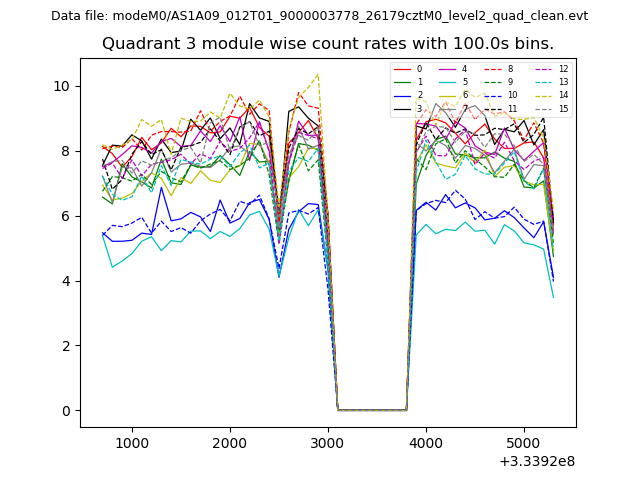
| Module-wise count rates for Quadrant A Data is divided into 100 sec bins |
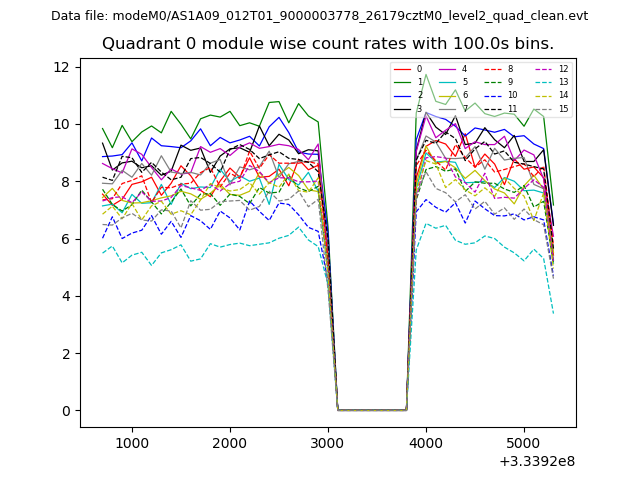 |
 |
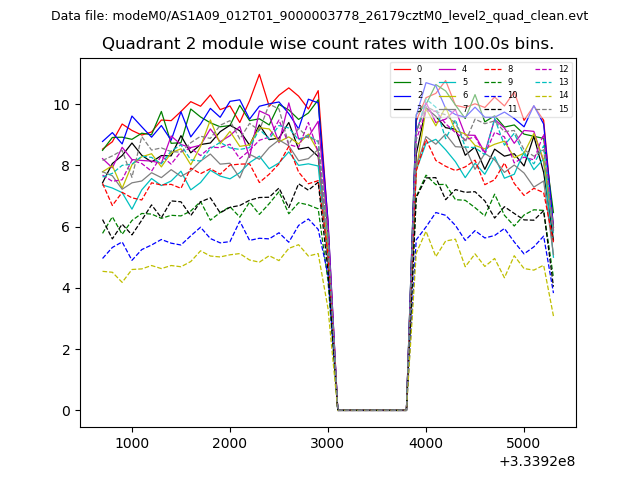
| Module-wise count rates for Quadrant B Data is divided into 100 sec bins |
 |
 |
| Module-wise count rates for Quadrant C Data is divided into 100 sec bins |
 |
 |
| Module-wise count rates for Quadrant D Data is divided into 100 sec bins |
 |
 |
| Parameter | Plot |
|---|---|
| CZT HV Monitor | 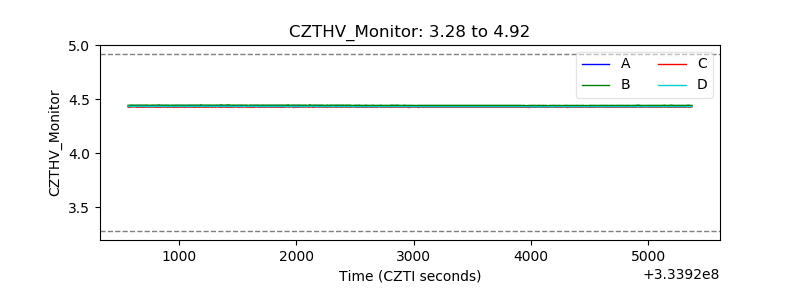 |
| D_VDD | 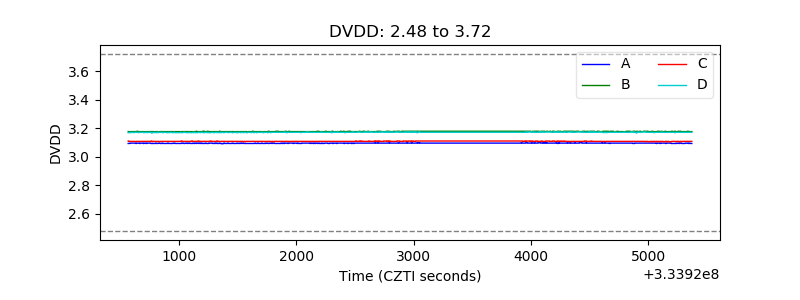 |
| Temperature 1 | 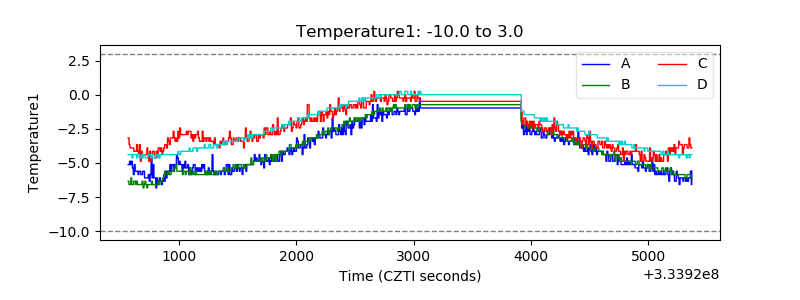 |
| Veto HV Monitor | 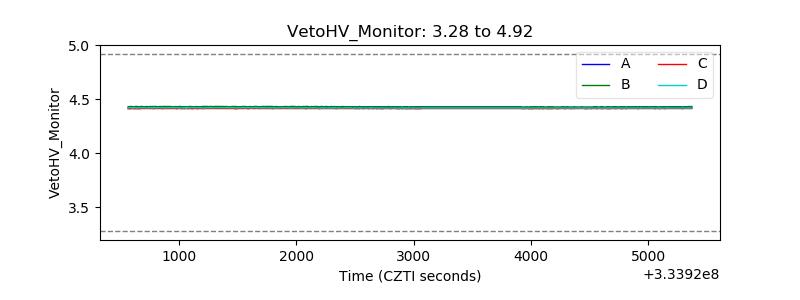 |
| Veto LLD | 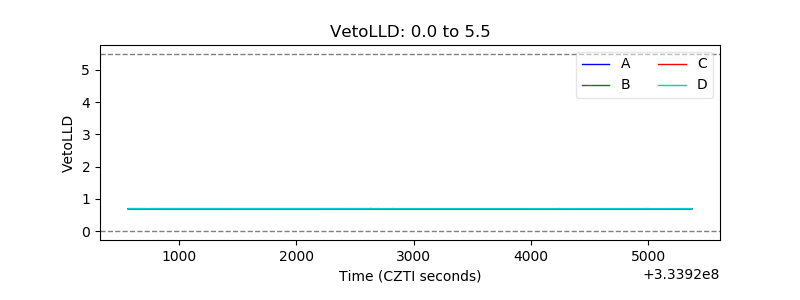 |
| Alpha Counter |  |
| _CPM_Rate |  |
| CZT Counter | 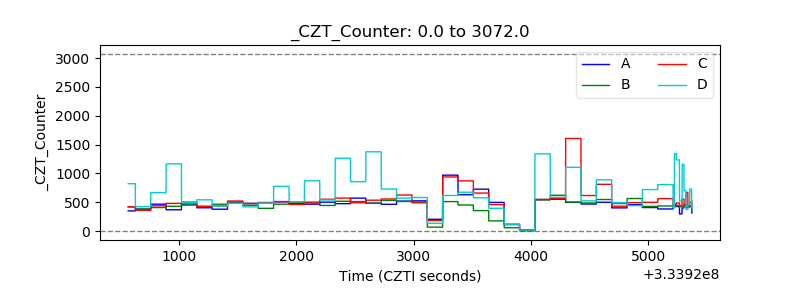 |
| +2.5 Volts monitor |  |
| +5 Volts monitor |  |
| _ROLL_ROT | 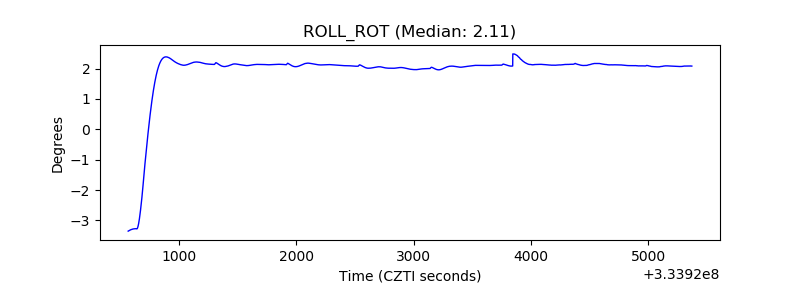 |
| _Roll_DEC | 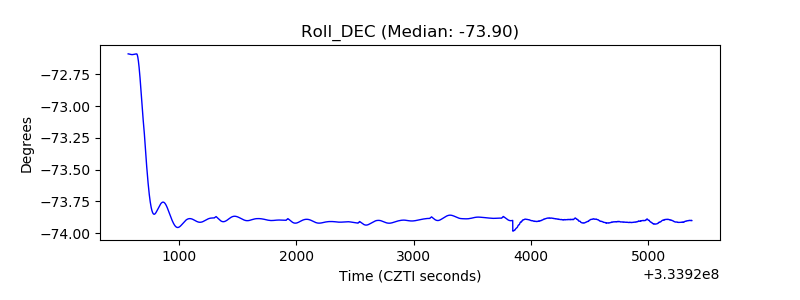 |
| _Roll_RA | 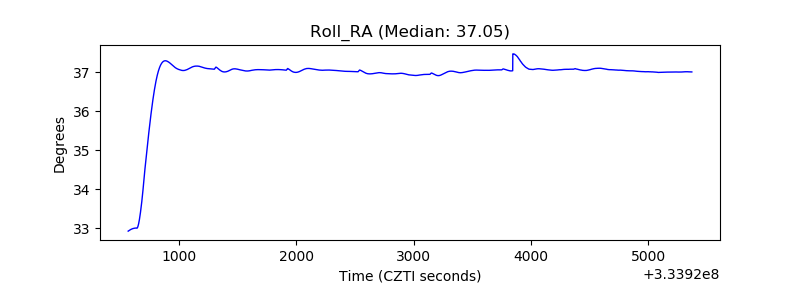 |
| Veto Counter | 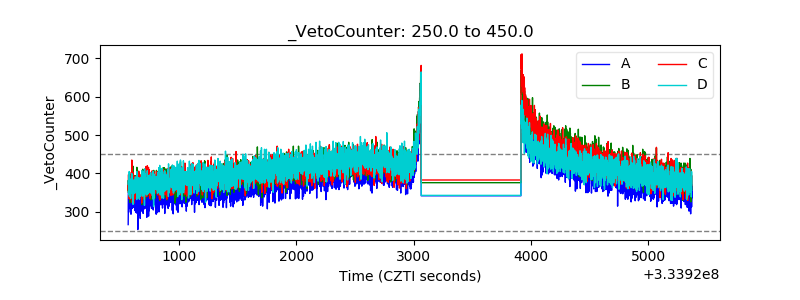 |