| Param | Original file | Final file |
|---|---|---|
| Filename | modeM0/AS1A09_012T01_9000003778_26180cztM0_level2.evt | modeM0/AS1A09_012T01_9000003778_26180cztM0_level2_quad_clean.evt |
| Size (bytes) | 496,543,680 | 129,715,200 |
| Size | 473.5 MB | 123.7 MB |
| Events in quadrant A | 3,098,519 | 878,365 |
| Events in quadrant B | 3,253,523 | 892,158 |
| Events in quadrant C | 3,278,677 | 863,562 |
| Events in quadrant D | 4,955,852 | 831,215 |
| Mode M0 | |||
|---|---|---|---|
| Quadrant | BADHDUFLAG | Total packets | Discarded packets |
| A | 0 | 13542 | 0 |
| B | 0 | 13994 | 0 |
| C | 0 | 13901 | 0 |
| D | 0 | 19167 | 0 |
| Mode M9 | |||
|---|---|---|---|
| Quadrant | BADHDUFLAG | Total packets | Discarded packets |
| A | 0 | 14 | 0 |
| B | 0 | 15 | 0 |
| C | 0 | 15 | 0 |
| D | 0 | 15 | 0 |
| Quadrant | Total seconds | Saturated seconds | Saturation percentage |
|---|---|---|---|
| A | 6647 | 15 | 0.225666% |
| B | 6647 | 37 | 0.556642% |
| C | 6647 | 82 | 1.233639% |
| D | 6647 | 291 | 4.377915% |
Noise dominated data is calculated using 1-second bins in cleaned event files. If a bin has >2000 counts, and if more than 50% of those come from <1% of pixels, then it is considered to be noise-dominated and hence unusable.
| Quadrant | # 1 sec bins | Bins with >0 counts | Bins with >2000 counts | High rate bins dominated by noise | Noise dominated (total time) | Noise dominated (detector-on time) | Marked lightcurve |
|---|---|---|---|---|---|---|---|
| A | 7662 | 6648 | 0 | 0 | 0.00% | 0.00% | 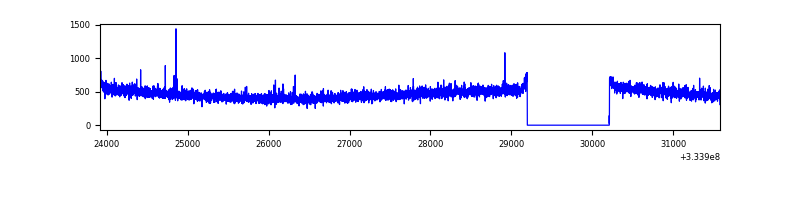 |
| B | 7662 | 6648 | 1 | 1 | 0.01% | 0.02% | 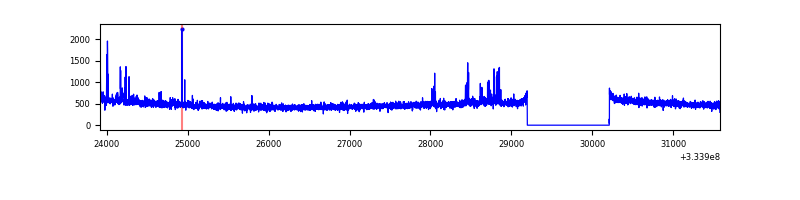 |
| C | 7662 | 6648 | 9 | 9 | 0.12% | 0.14% | 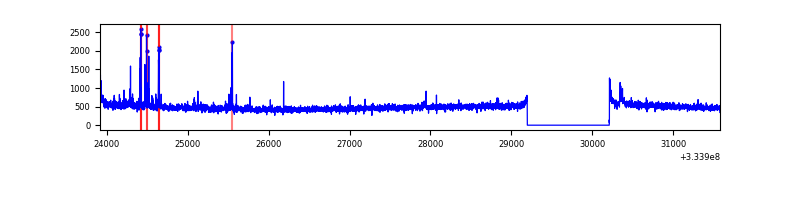 |
| D | 7662 | 6648 | 257 | 257 | 3.35% | 3.87% | 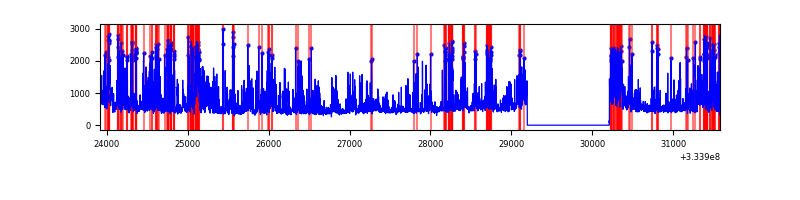 |
Top three noisy pixels from each quadrant. If the there are fewer than three noisy pixels in the level2.evt file, extra rows are filled as -1
| Pixel properties | Quadrant properties | ||||||
|---|---|---|---|---|---|---|---|
| Quadrant | DetID | PixID | Counts | Sigma | Mean | Median | Sigma |
| A | 13 | 254 | 11327 | 65.42 | 799 | 782 | 161.2 |
| A | 3 | 137 | 7358 | 40.8 | 799 | 782 | 161.2 |
| A | 0 | 226 | 6738 | 36.95 | 799 | 782 | 161.2 |
| B | 0 | 190 | 66675 | 432.67 | 802 | 783 | 152.3 |
| B | 5 | 172 | 22160 | 140.37 | 802 | 783 | 152.3 |
| B | 12 | 111 | 18493 | 116.29 | 802 | 783 | 152.3 |
| C | 14 | 238 | 126887 | 696.17 | 775 | 779 | 181.1 |
| C | 2 | 16 | 80495 | 440.07 | 775 | 779 | 181.1 |
| C | 3 | 233 | 42914 | 232.6 | 775 | 779 | 181.1 |
| D | 1 | 52 | 1870067 | 10169.38 | 766 | 747 | 183.8 |
| D | 12 | 233 | 149081 | 806.96 | 766 | 747 | 183.8 |
| D | 2 | 234 | 31803 | 168.95 | 766 | 747 | 183.8 |
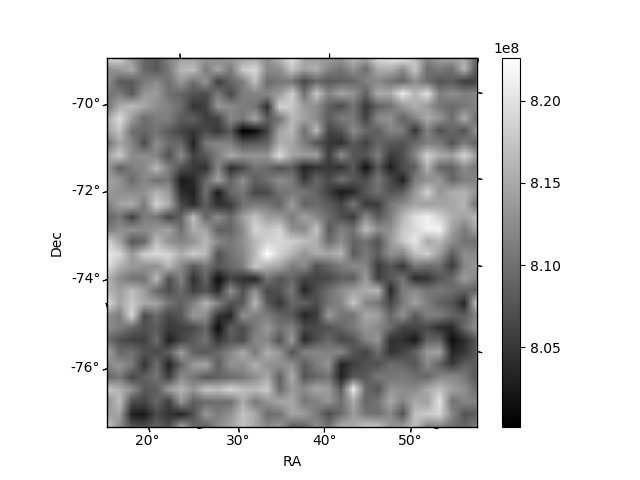
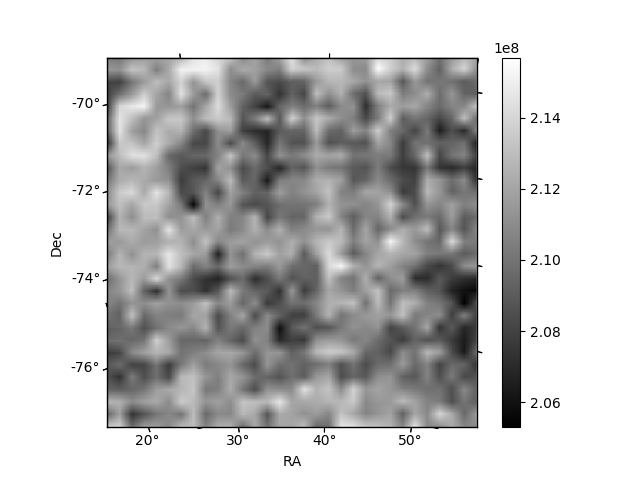
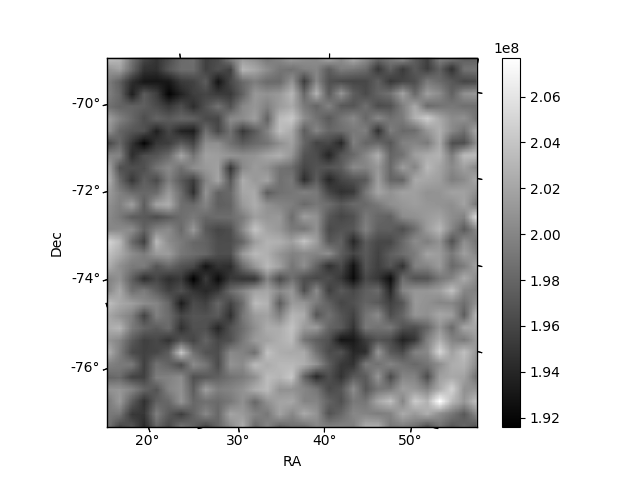
Histogram calculated using DETX and DETY for each event in the final _common_clean file
| Quadrant A | 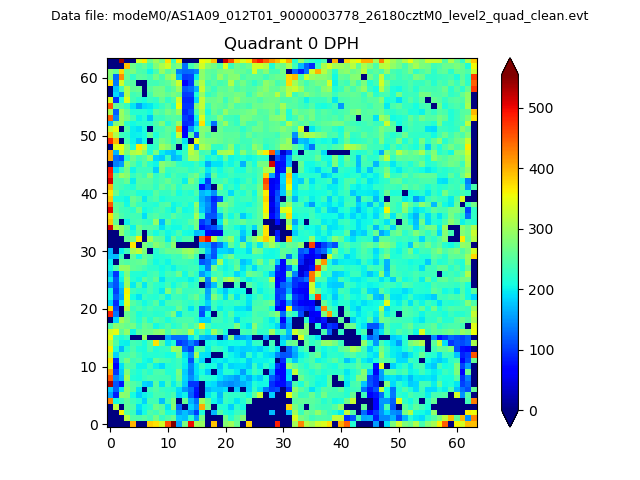 |
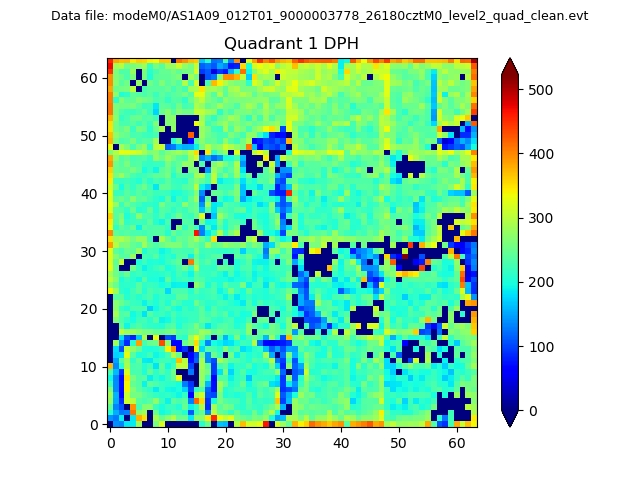 |
Quadrant B |
|---|---|---|---|
| Quadrant D | 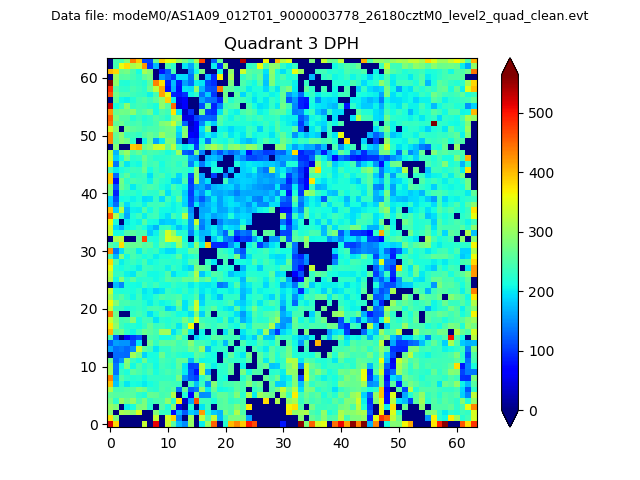 |
 |
Quadrant C |
| Plot type | Count rate plots | Images |
|---|---|---|
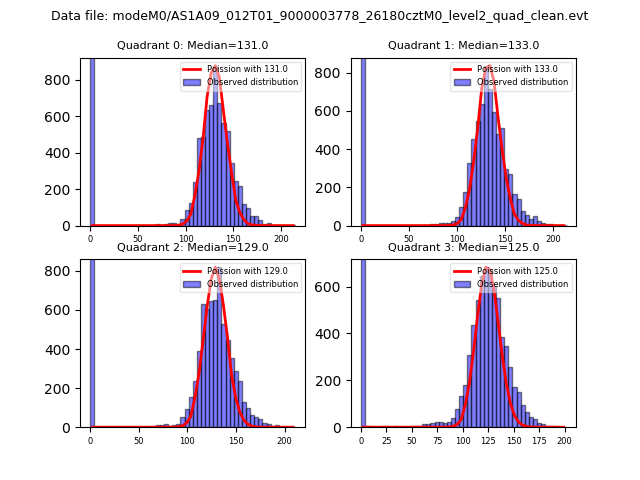
| Comparison with Poisson distribution Blue bars denote a histogram of data divided into 1 sec bins. Red curve is a Poisson curve with rate = median count rate of data. |
 |
 |
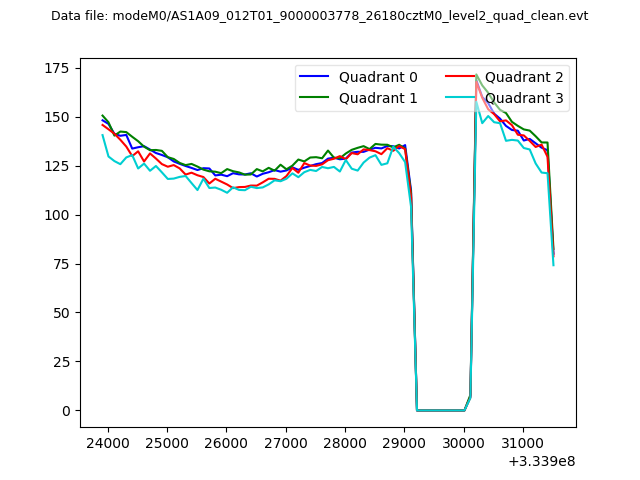
| Quadrant-wise count rates Data is divided into 100 sec bins |
 |
|
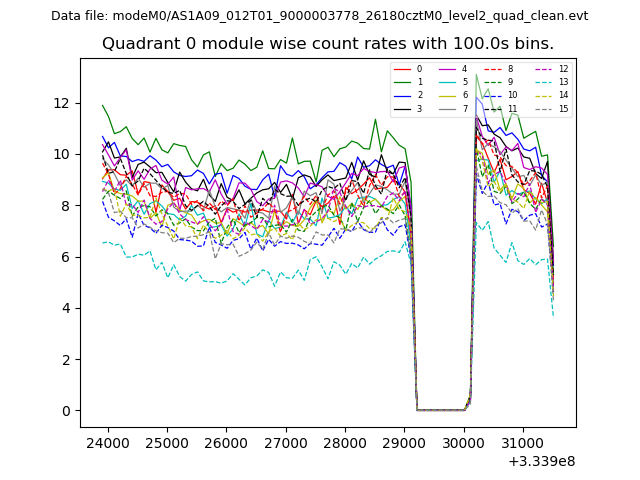
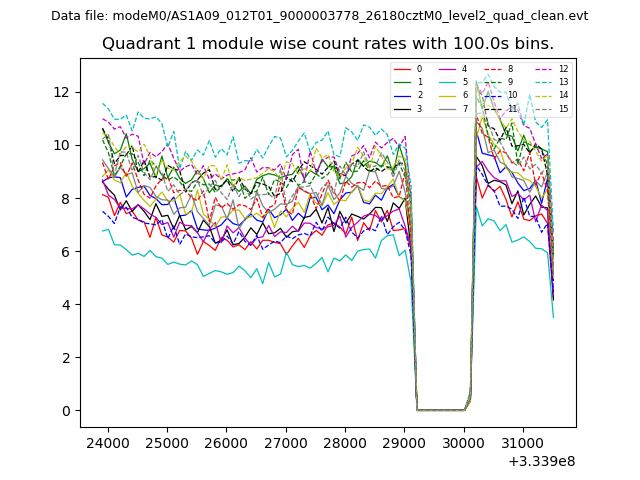
| Module-wise count rates for Quadrant A Data is divided into 100 sec bins |
 |
 |
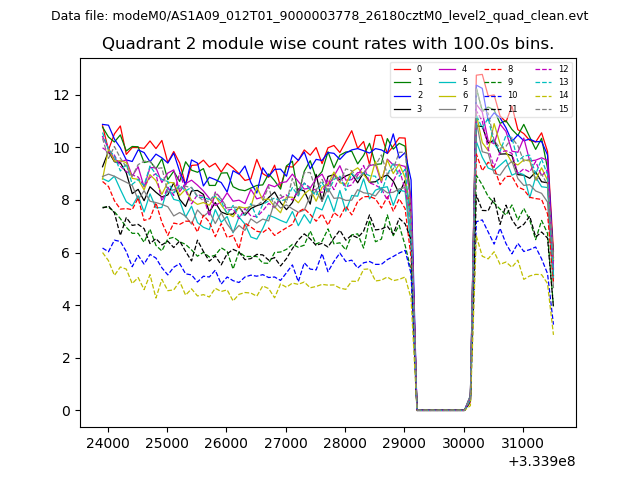
| Module-wise count rates for Quadrant B Data is divided into 100 sec bins |
 |
 |
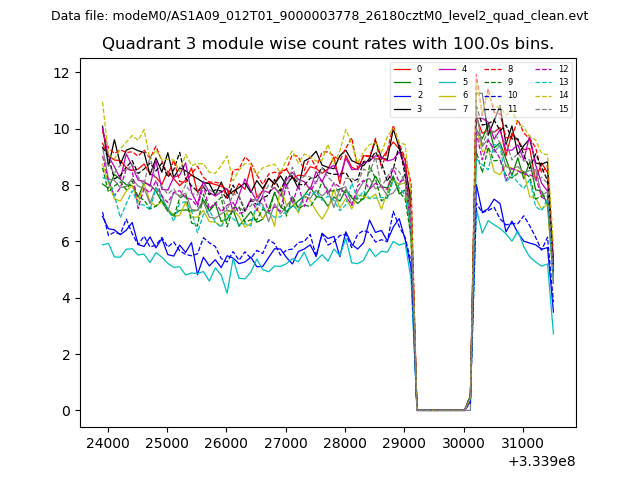
| Module-wise count rates for Quadrant C Data is divided into 100 sec bins |
 |
 |
| Module-wise count rates for Quadrant D Data is divided into 100 sec bins |
 |
 |
| Parameter | Plot |
|---|---|
| CZT HV Monitor | 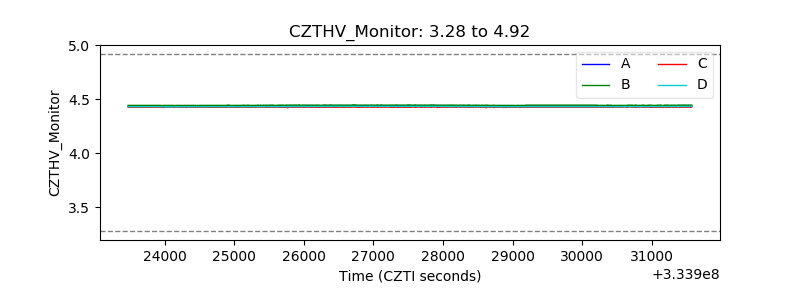 |
| D_VDD | 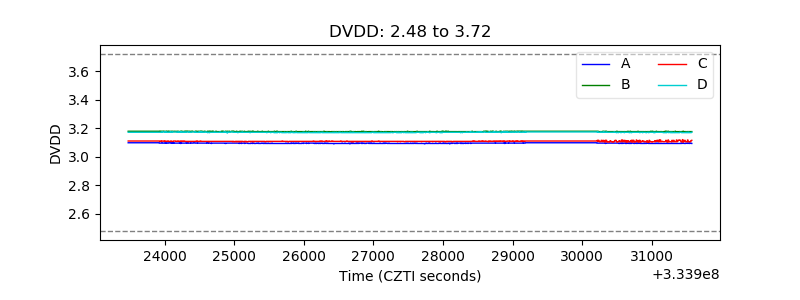 |
| Temperature 1 | 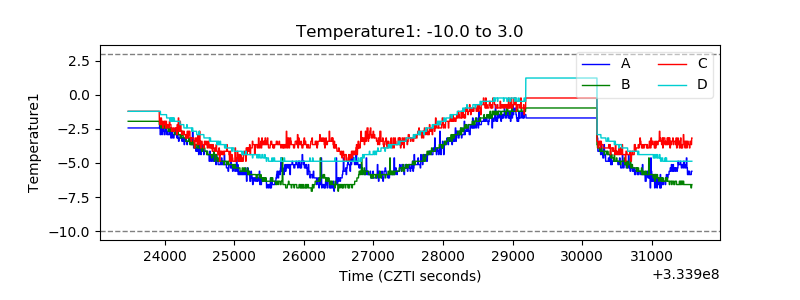 |
| Veto HV Monitor | 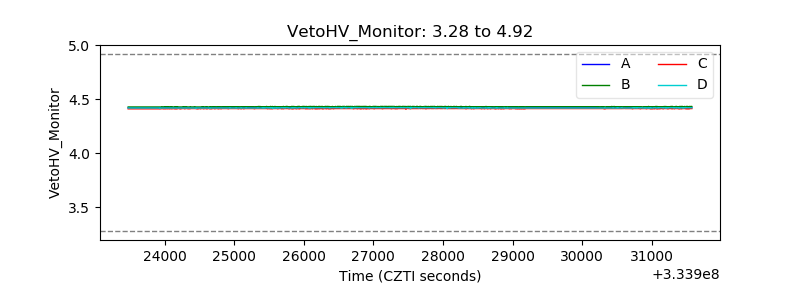 |
| Veto LLD | 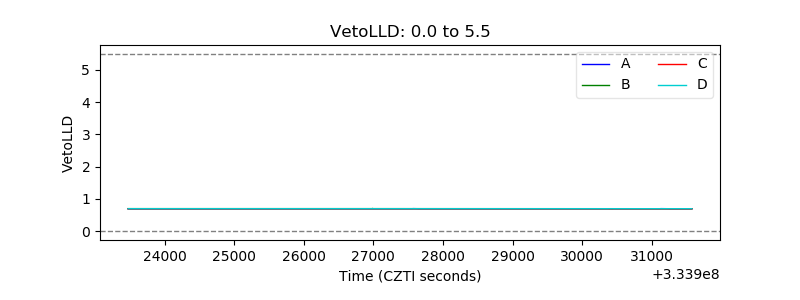 |
| Alpha Counter | 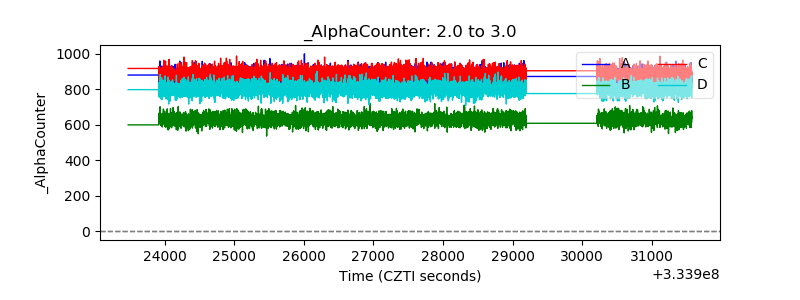 |
| _CPM_Rate | 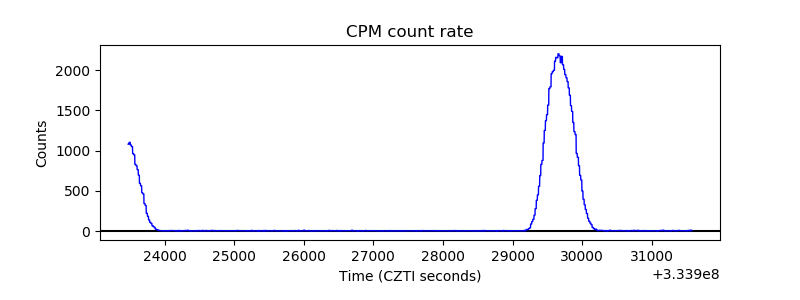 |
| CZT Counter | 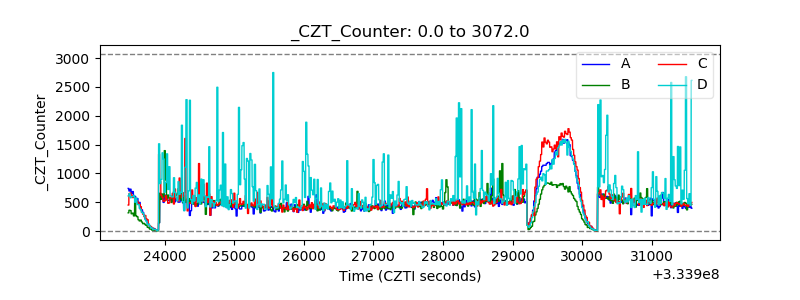 |
| +2.5 Volts monitor |  |
| +5 Volts monitor |  |
| _ROLL_ROT | 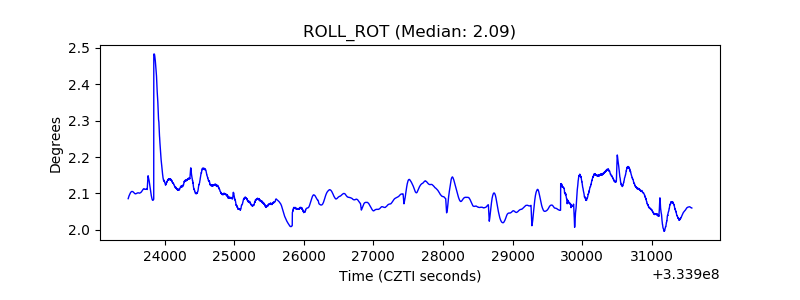 |
| _Roll_DEC | 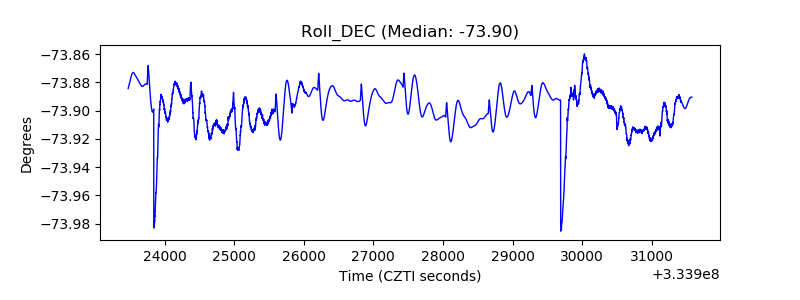 |
| _Roll_RA | 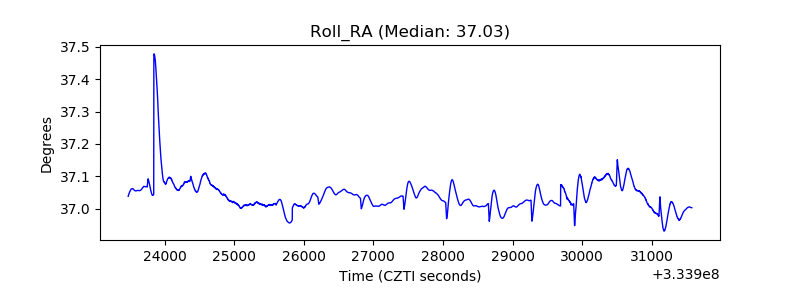 |
| Veto Counter |  |