| Param | Original file | Final file |
|---|---|---|
| Filename | modeM0/AS1A09_012T01_9000003778_26182cztM0_level2.evt | modeM0/AS1A09_012T01_9000003778_26182cztM0_level2_quad_clean.evt |
| Size (bytes) | 110,822,400 | 29,448,000 |
| Size | 105.7 MB | 28.1 MB |
| Events in quadrant A | 683,167 | 198,342 |
| Events in quadrant B | 706,950 | 204,800 |
| Events in quadrant C | 723,722 | 197,841 |
| Events in quadrant D | 1,146,622 | 188,197 |
| Mode M0 | |||
|---|---|---|---|
| Quadrant | BADHDUFLAG | Total packets | Discarded packets |
| A | 0 | 2835 | 0 |
| B | 0 | 2888 | 0 |
| C | 0 | 2945 | 0 |
| D | 0 | 4321 | 0 |
| Mode M9 | |||
|---|---|---|---|
| Quadrant | BADHDUFLAG | Total packets | Discarded packets |
| A | 0 | 9 | 0 |
| B | 0 | 10 | 0 |
| C | 0 | 10 | 0 |
| D | 0 | 10 | 0 |
| Quadrant | Total seconds | Saturated seconds | Saturation percentage |
|---|---|---|---|
| A | 1367 | 2 | 0.146306% |
| B | 1367 | 7 | 0.512070% |
| C | 1367 | 19 | 1.389905% |
| D | 1367 | 75 | 5.486467% |
Noise dominated data is calculated using 1-second bins in cleaned event files. If a bin has >2000 counts, and if more than 50% of those come from <1% of pixels, then it is considered to be noise-dominated and hence unusable.
| Quadrant | # 1 sec bins | Bins with >0 counts | Bins with >2000 counts | High rate bins dominated by noise | Noise dominated (total time) | Noise dominated (detector-on time) | Marked lightcurve |
|---|---|---|---|---|---|---|---|
| A | 1367 | 1367 | 0 | 0 | 0.00% | 0.00% | 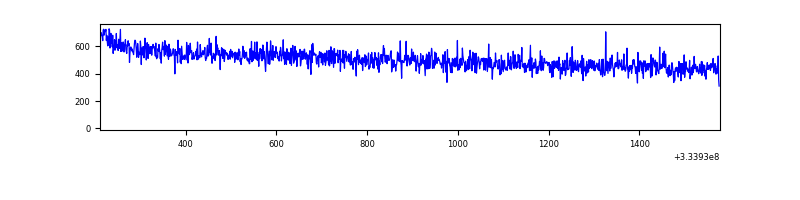 |
| B | 1367 | 1367 | 0 | 0 | 0.00% | 0.00% | 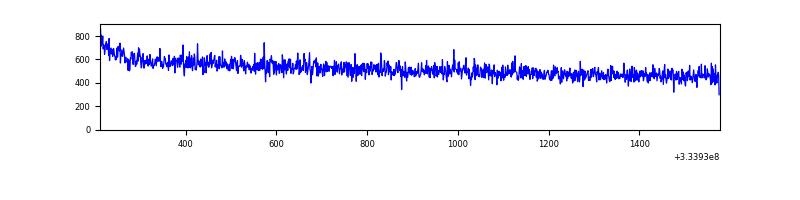 |
| C | 1367 | 1367 | 0 | 0 | 0.00% | 0.00% | 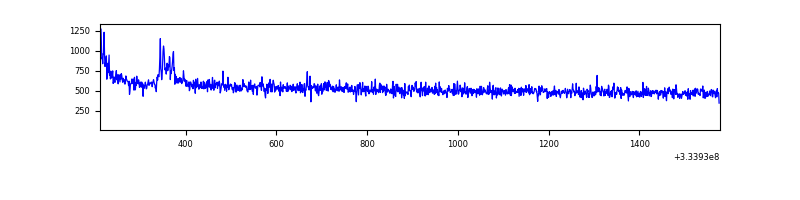 |
| D | 1367 | 1367 | 80 | 80 | 5.85% | 5.85% | 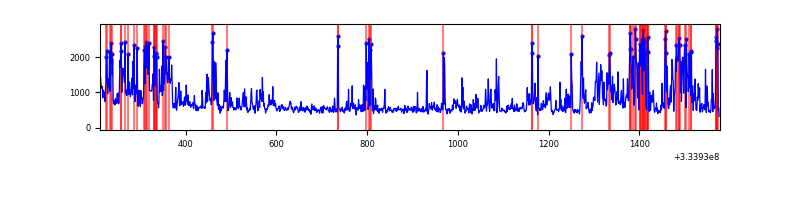 |
Top three noisy pixels from each quadrant. If the there are fewer than three noisy pixels in the level2.evt file, extra rows are filled as -1
| Pixel properties | Quadrant properties | ||||||
|---|---|---|---|---|---|---|---|
| Quadrant | DetID | PixID | Counts | Sigma | Mean | Median | Sigma |
| A | 13 | 254 | 2537 | 63.15 | 176 | 172 | 37.4 |
| A | 3 | 137 | 1624 | 38.77 | 176 | 172 | 37.4 |
| A | 0 | 13 | 1588 | 37.81 | 176 | 172 | 37.4 |
| B | 12 | 111 | 4088 | 107.77 | 180 | 176 | 36.3 |
| B | 11 | 111 | 3540 | 92.68 | 180 | 176 | 36.3 |
| B | 14 | 111 | 3231 | 84.16 | 180 | 176 | 36.3 |
| C | 14 | 238 | 28405 | 675.27 | 171 | 173 | 41.8 |
| C | 3 | 233 | 16573 | 392.26 | 171 | 173 | 41.8 |
| C | 8 | 128 | 3637 | 82.85 | 171 | 173 | 41.8 |
| D | 1 | 52 | 476985 | 11522.13 | 167 | 163 | 41.4 |
| D | 12 | 233 | 27630 | 663.72 | 167 | 163 | 41.4 |
| D | 2 | 234 | 6155 | 144.79 | 167 | 163 | 41.4 |
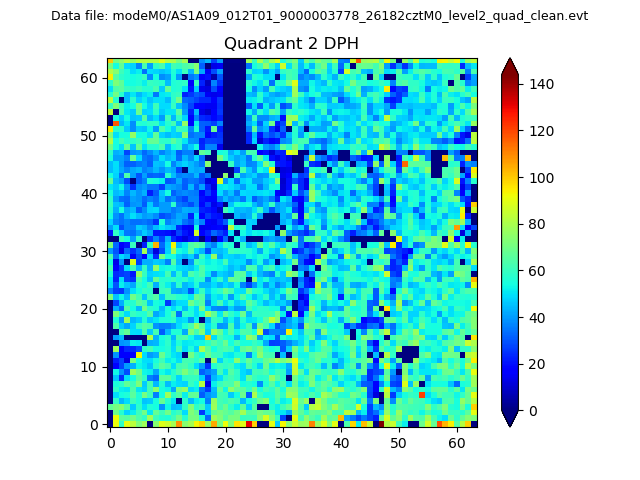
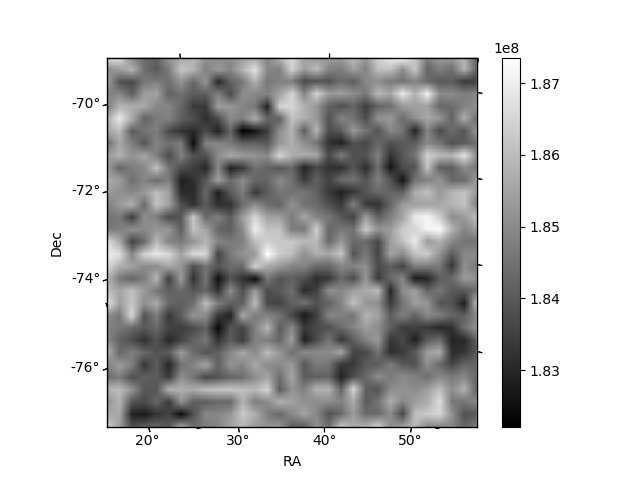
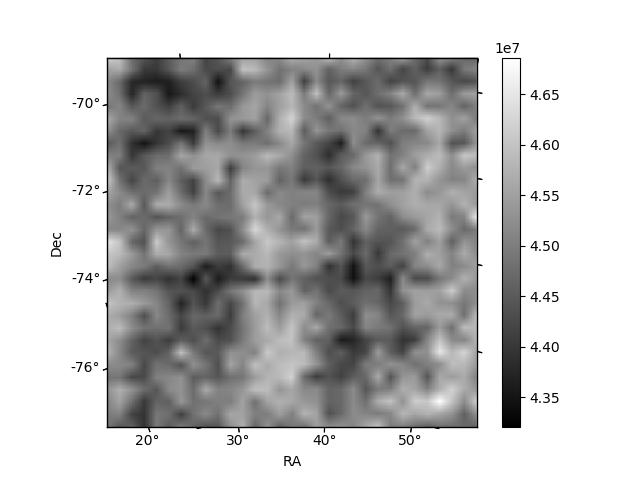
Histogram calculated using DETX and DETY for each event in the final _common_clean file
| Quadrant A | 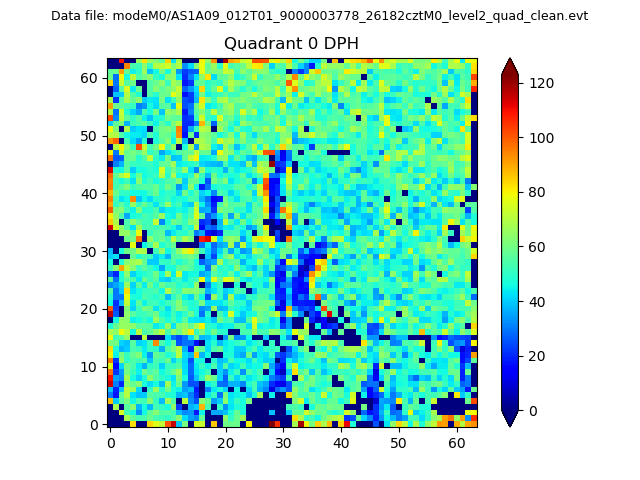 |
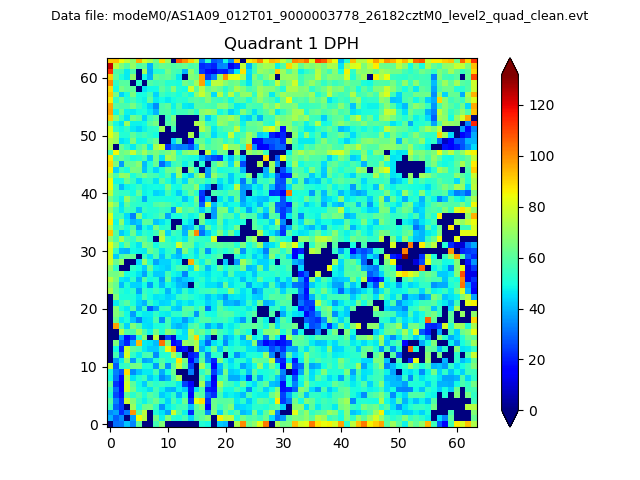 |
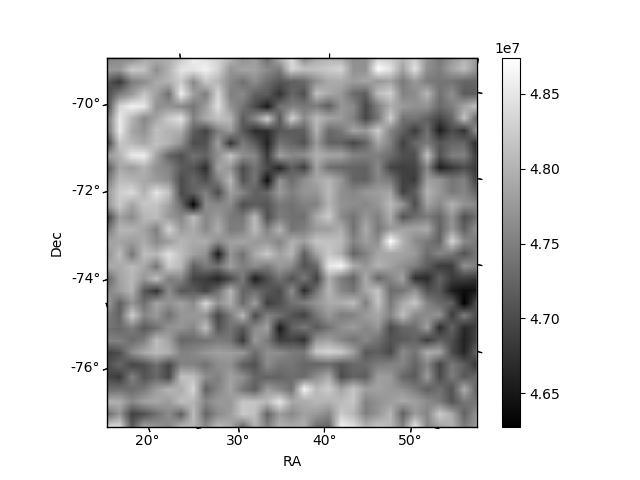
Quadrant B |
|---|---|---|---|
| Quadrant D | 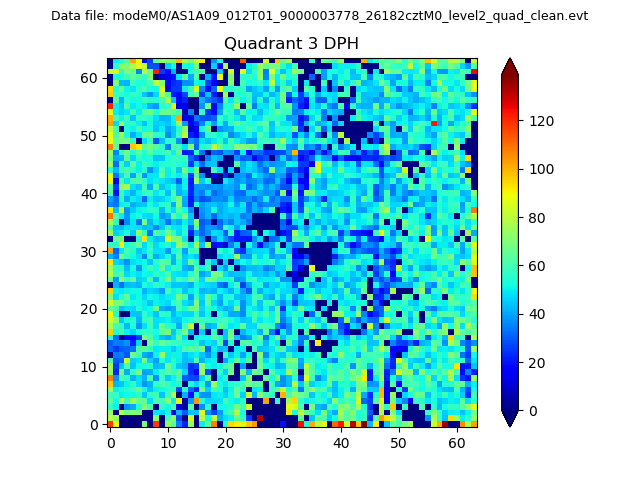 |
 |
Quadrant C |
| Plot type | Count rate plots | Images |
|---|---|---|
| Comparison with Poisson distribution Blue bars denote a histogram of data divided into 1 sec bins. Red curve is a Poisson curve with rate = median count rate of data. |
 |
 |
| Quadrant-wise count rates Data is divided into 100 sec bins |
 |
|
| Module-wise count rates for Quadrant A Data is divided into 100 sec bins |
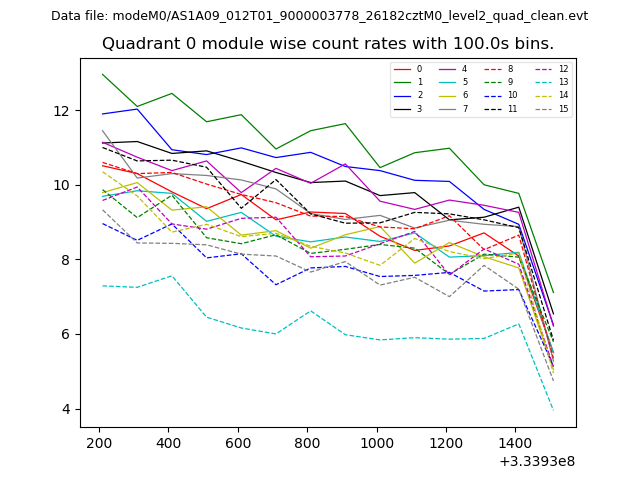 |
 |
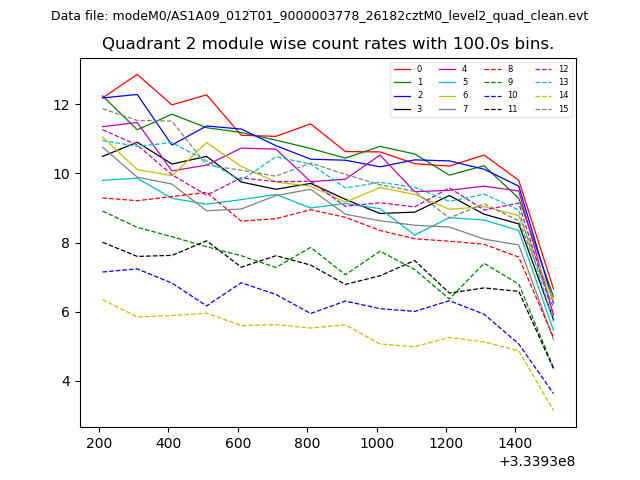
| Module-wise count rates for Quadrant B Data is divided into 100 sec bins |
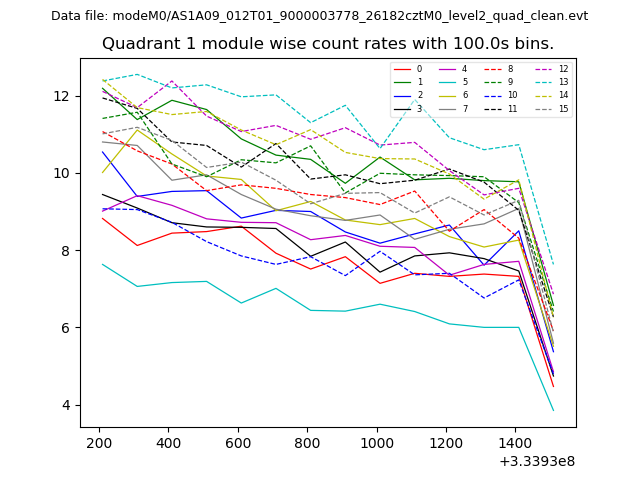 |
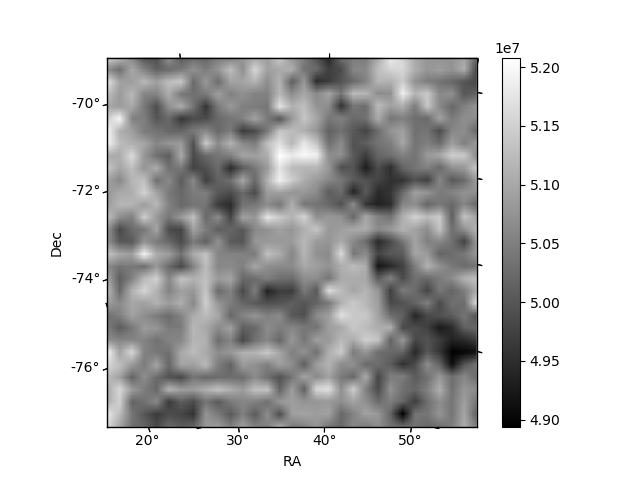 |
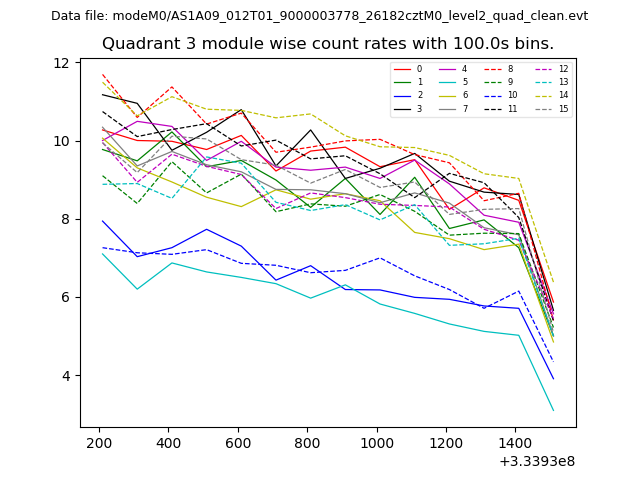
| Module-wise count rates for Quadrant C Data is divided into 100 sec bins |
 |
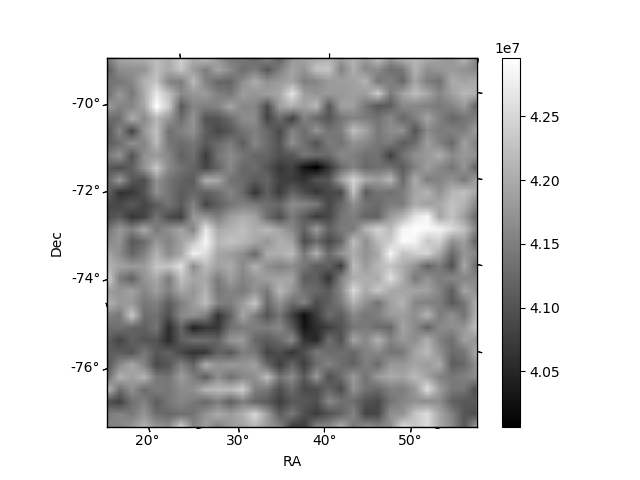 |
| Module-wise count rates for Quadrant D Data is divided into 100 sec bins |
 |
 |
| Parameter | Plot |
|---|---|
| CZT HV Monitor | 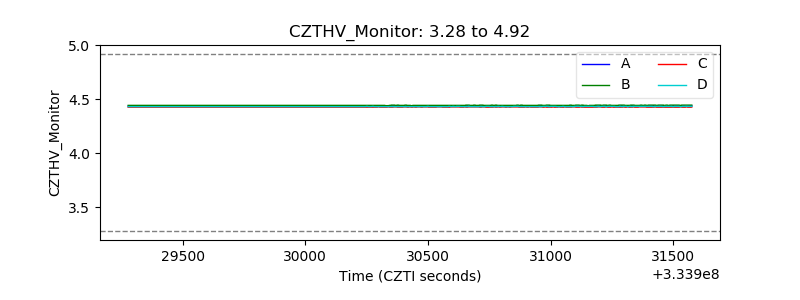 |
| D_VDD | 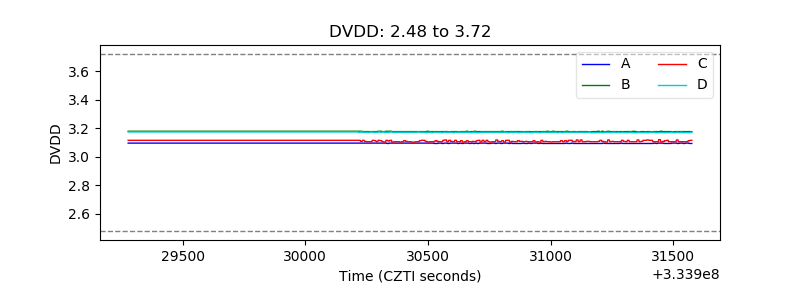 |
| Temperature 1 | 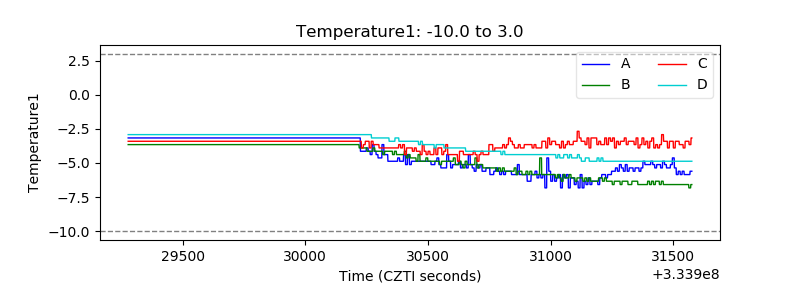 |
| Veto HV Monitor | 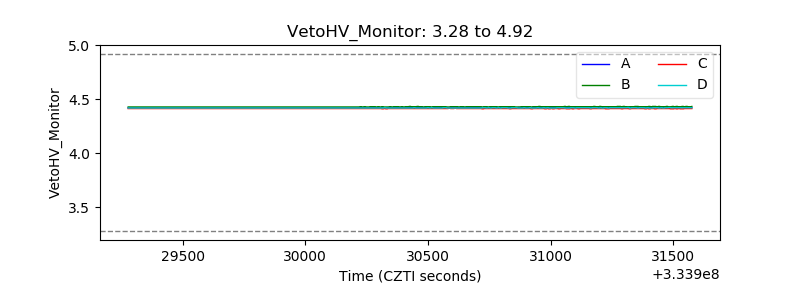 |
| Veto LLD | 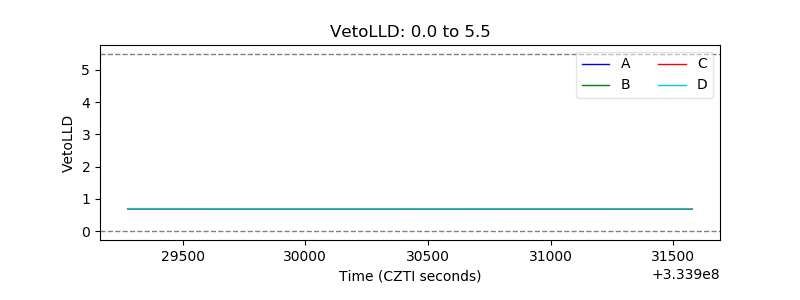 |
| Alpha Counter | 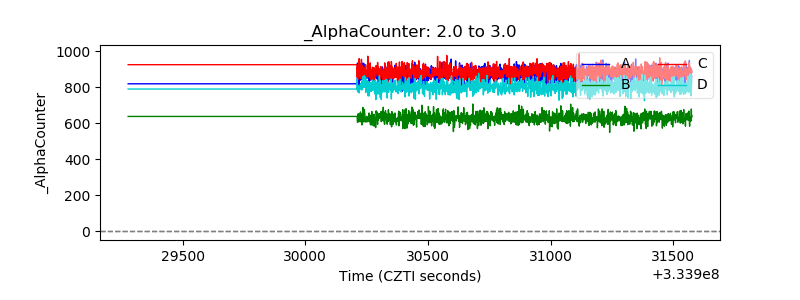 |
| _CPM_Rate | 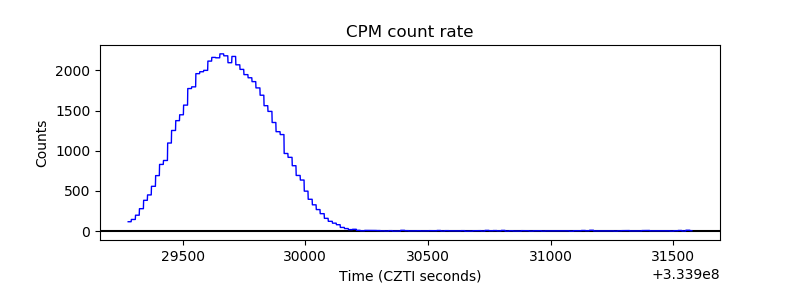 |
| CZT Counter | 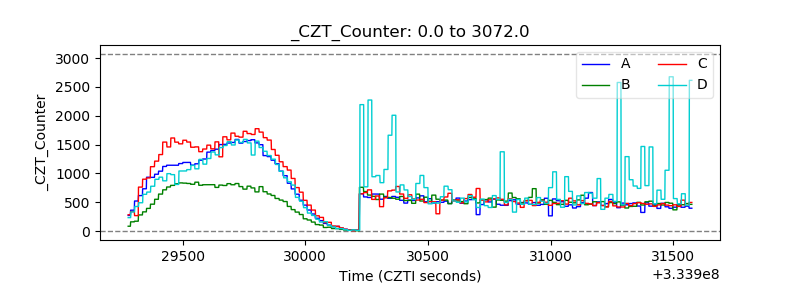 |
| +2.5 Volts monitor | 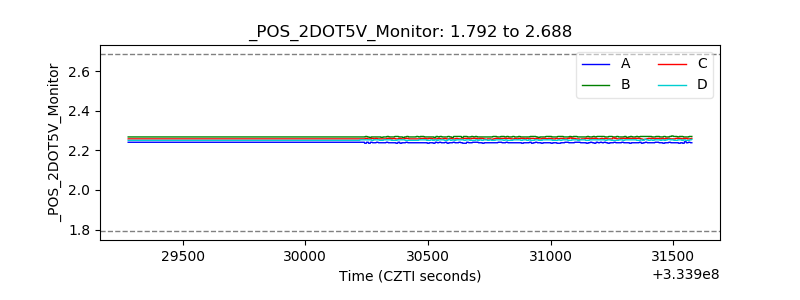 |
| +5 Volts monitor |  |
| _ROLL_ROT | 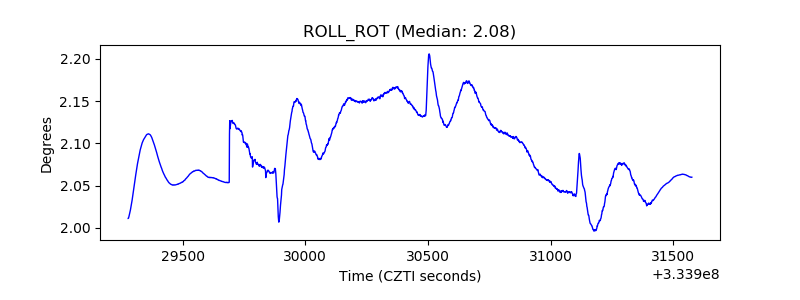 |
| _Roll_DEC | 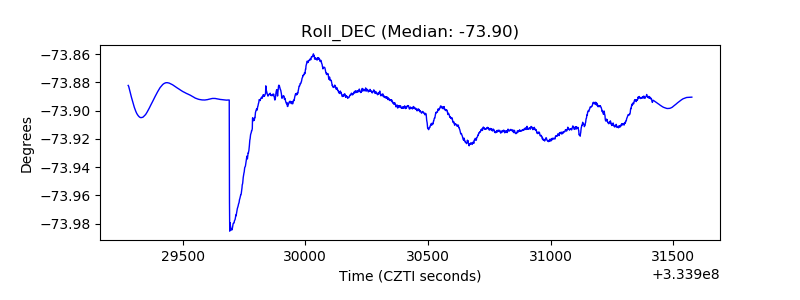 |
| _Roll_RA | 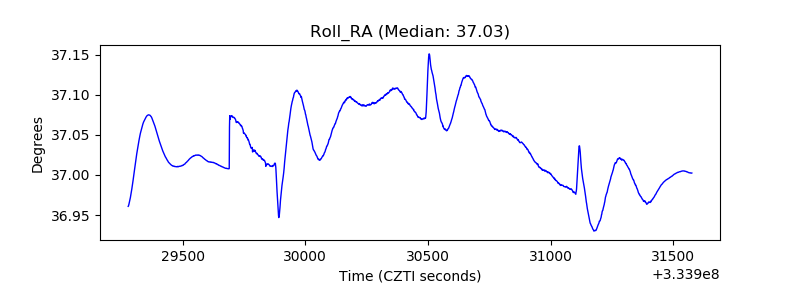 |
| Veto Counter | 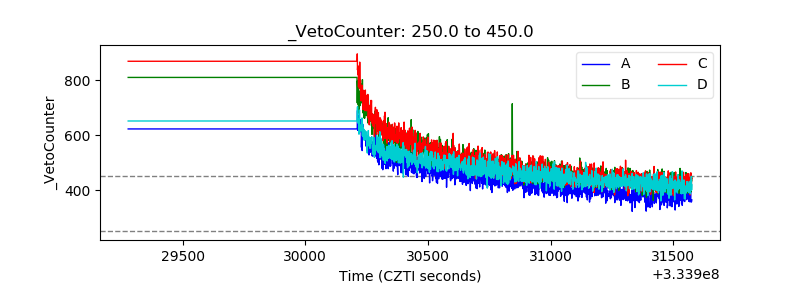 |