| Param | Original file | Final file |
|---|---|---|
| Filename | modeM0/AS1A09_012T02_9000003780_26183cztM0_level2.evt | modeM0/AS1A09_012T02_9000003780_26183cztM0_level2_quad_clean.evt |
| Size (bytes) | 508,170,240 | 143,881,920 |
| Size | 484.6 MB | 137.2 MB |
| Events in quadrant A | 3,242,083 | 976,272 |
| Events in quadrant B | 3,397,495 | 1,006,667 |
| Events in quadrant C | 3,471,251 | 979,920 |
| Events in quadrant D | 4,835,110 | 938,667 |
| Mode M0 | |||
|---|---|---|---|
| Quadrant | BADHDUFLAG | Total packets | Discarded packets |
| A | 0 | 13731 | 0 |
| B | 0 | 14202 | 0 |
| C | 0 | 14273 | 0 |
| D | 0 | 18738 | 0 |
| Mode M9 | |||
|---|---|---|---|
| Quadrant | BADHDUFLAG | Total packets | Discarded packets |
| A | 0 | 18 | 0 |
| B | 0 | 19 | 0 |
| C | 0 | 19 | 0 |
| D | 0 | 19 | 0 |
| Quadrant | Total seconds | Saturated seconds | Saturation percentage |
|---|---|---|---|
| A | 6544 | 7 | 0.106968% |
| B | 6544 | 20 | 0.305623% |
| C | 6544 | 78 | 1.191932% |
| D | 6544 | 214 | 3.270171% |
Noise dominated data is calculated using 1-second bins in cleaned event files. If a bin has >2000 counts, and if more than 50% of those come from <1% of pixels, then it is considered to be noise-dominated and hence unusable.
| Quadrant | # 1 sec bins | Bins with >0 counts | Bins with >2000 counts | High rate bins dominated by noise | Noise dominated (total time) | Noise dominated (detector-on time) | Marked lightcurve |
|---|---|---|---|---|---|---|---|
| A | 7809 | 6545 | 0 | 0 | 0.00% | 0.00% |  |
| B | 7809 | 6545 | 0 | 0 | 0.00% | 0.00% |  |
| C | 7809 | 6545 | 4 | 4 | 0.05% | 0.06% |  |
| D | 7809 | 6545 | 206 | 206 | 2.64% | 3.15% |  |
Top three noisy pixels from each quadrant. If the there are fewer than three noisy pixels in the level2.evt file, extra rows are filled as -1
| Pixel properties | Quadrant properties | ||||||
|---|---|---|---|---|---|---|---|
| Quadrant | DetID | PixID | Counts | Sigma | Mean | Median | Sigma |
| A | 13 | 254 | 10236 | 56.96 | 840 | 825 | 165.2 |
| A | 3 | 137 | 7136 | 38.2 | 840 | 825 | 165.2 |
| A | 0 | 226 | 7109 | 38.03 | 840 | 825 | 165.2 |
| B | 3 | 112 | 43931 | 280.48 | 845 | 825 | 153.7 |
| B | 0 | 190 | 35968 | 228.66 | 845 | 825 | 153.7 |
| B | 12 | 111 | 18329 | 113.89 | 845 | 825 | 153.7 |
| C | 14 | 238 | 137483 | 709.14 | 837 | 844 | 192.7 |
| C | 3 | 233 | 50858 | 259.57 | 837 | 844 | 192.7 |
| C | 2 | 16 | 16489 | 81.2 | 837 | 844 | 192.7 |
| D | 1 | 52 | 1655511 | 8634.57 | 822 | 805 | 191.6 |
| D | 10 | 103 | 34020 | 173.32 | 822 | 805 | 191.6 |
| D | 2 | 234 | 26968 | 136.52 | 822 | 805 | 191.6 |
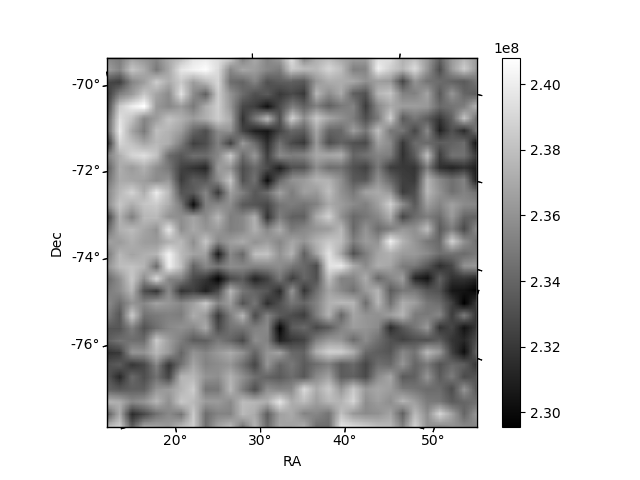
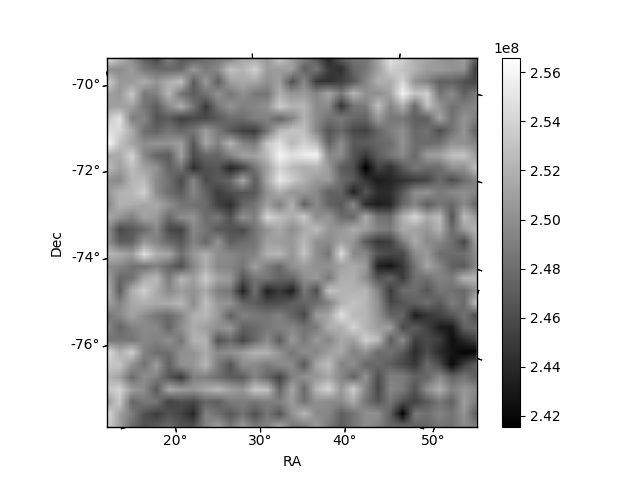
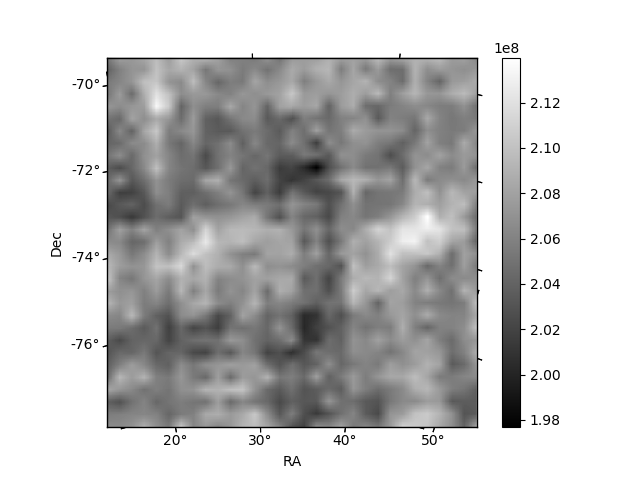
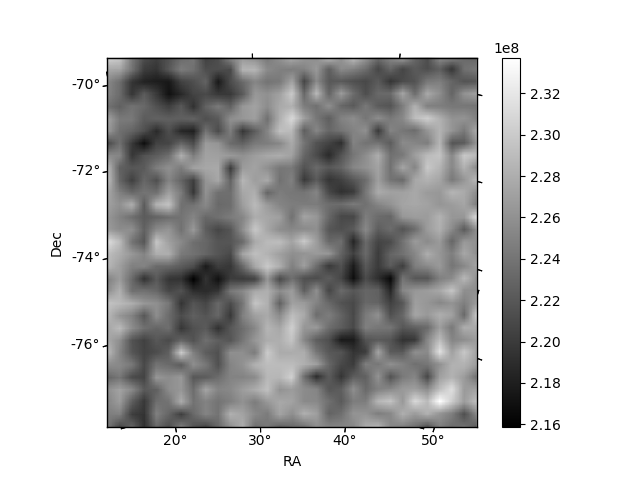
Histogram calculated using DETX and DETY for each event in the final _common_clean file
| Quadrant A | 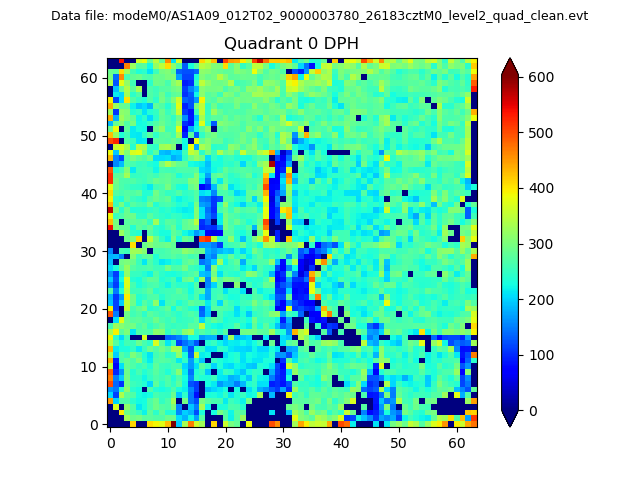 |
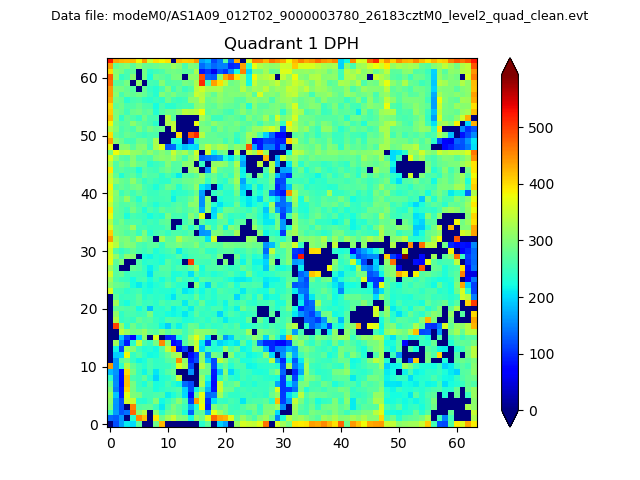 |
Quadrant B |
|---|---|---|---|
| Quadrant D | 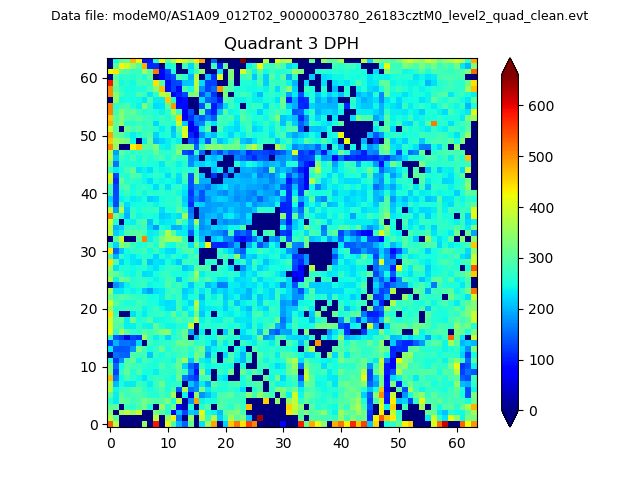 |
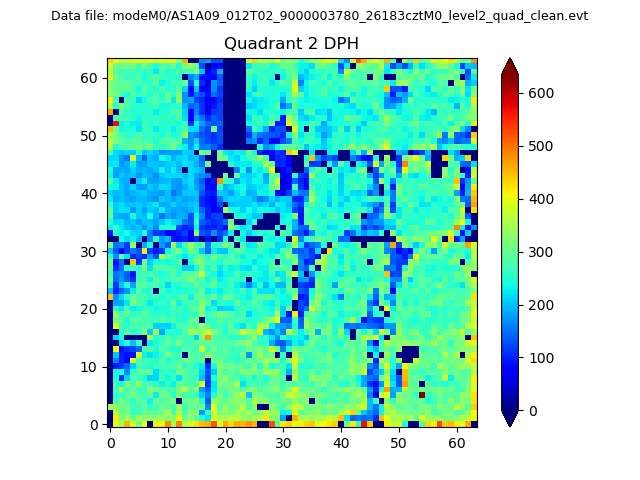 |
Quadrant C |
| Plot type | Count rate plots | Images |
|---|---|---|
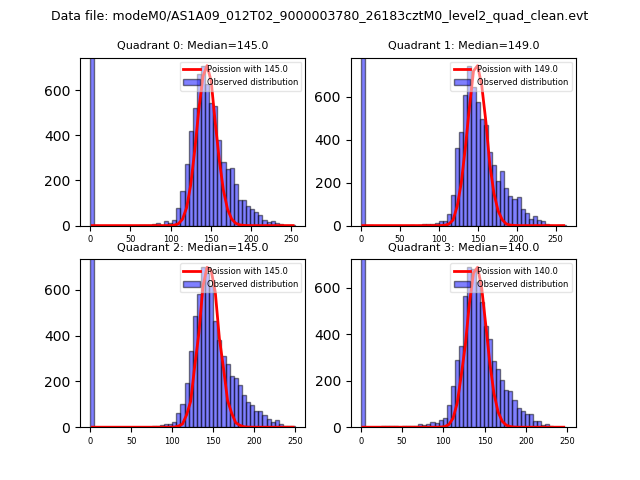
| Comparison with Poisson distribution Blue bars denote a histogram of data divided into 1 sec bins. Red curve is a Poisson curve with rate = median count rate of data. |
 |
 |
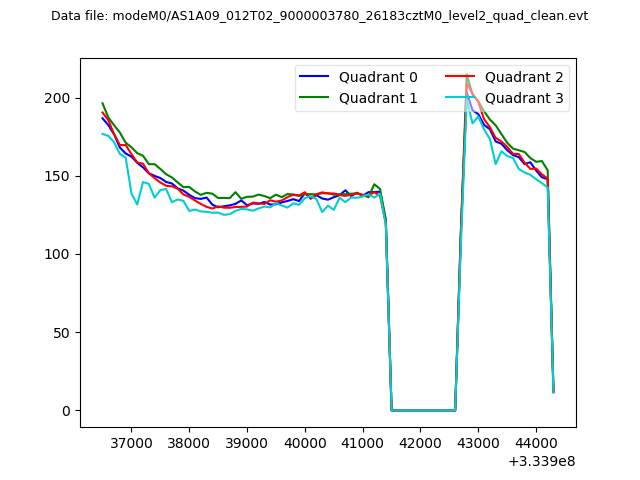
| Quadrant-wise count rates Data is divided into 100 sec bins |
 |
|
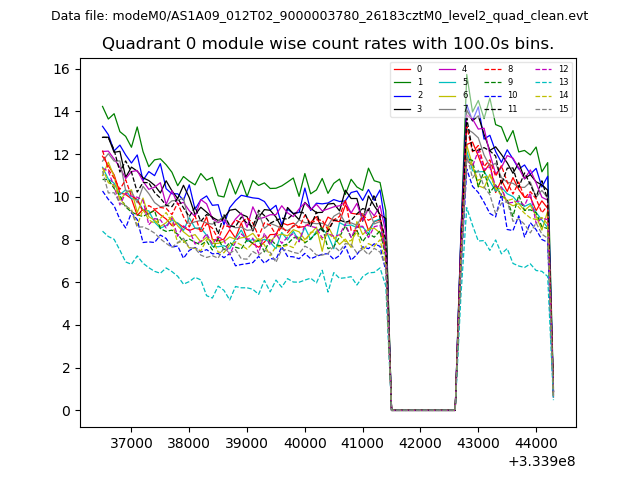
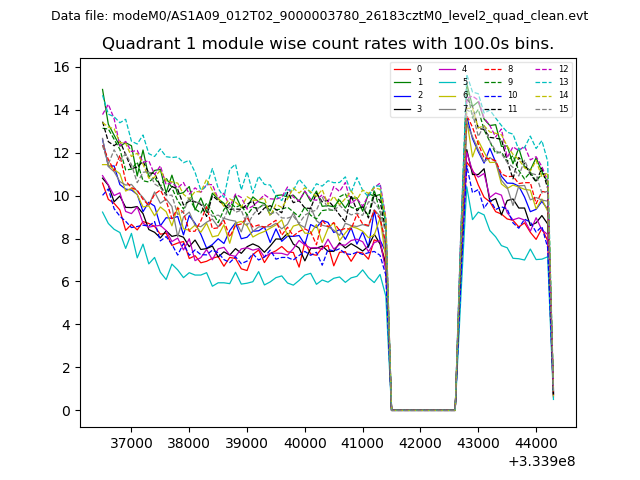
| Module-wise count rates for Quadrant A Data is divided into 100 sec bins |
 |
 |
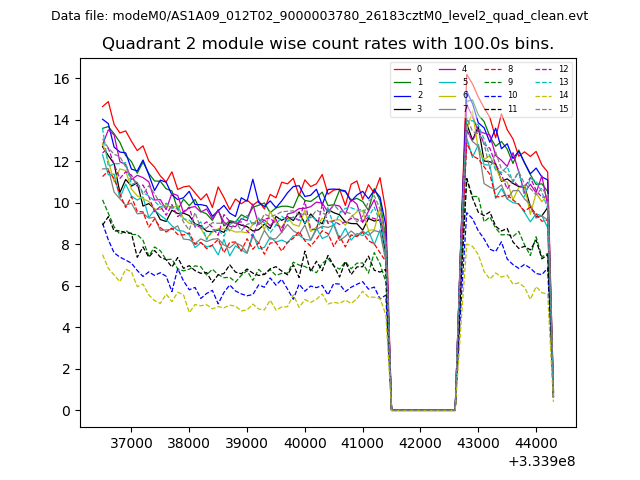
| Module-wise count rates for Quadrant B Data is divided into 100 sec bins |
 |
 |
| Module-wise count rates for Quadrant C Data is divided into 100 sec bins |
 |
 |
| Module-wise count rates for Quadrant D Data is divided into 100 sec bins |
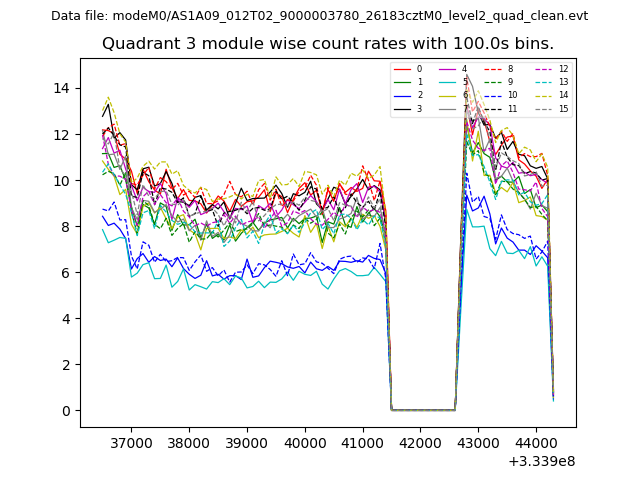 |
 |
| Parameter | Plot |
|---|---|
| CZT HV Monitor | 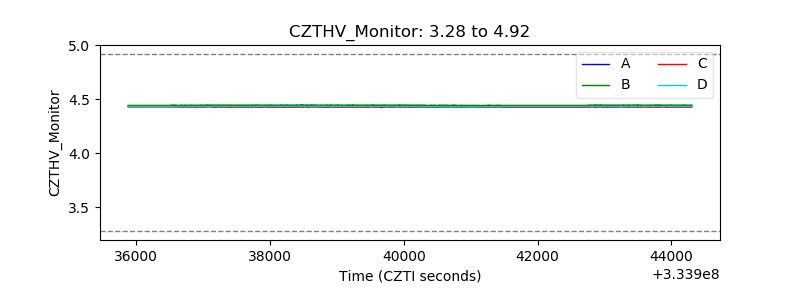 |
| D_VDD | 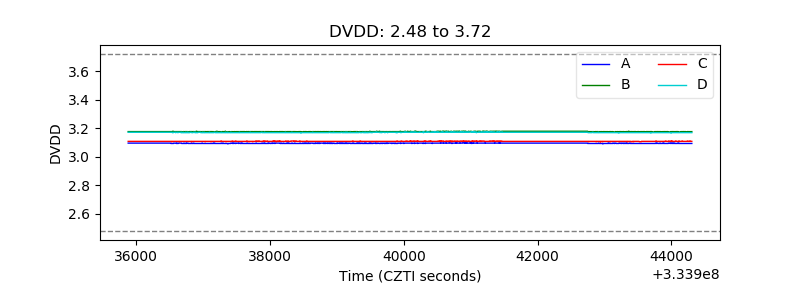 |
| Temperature 1 | 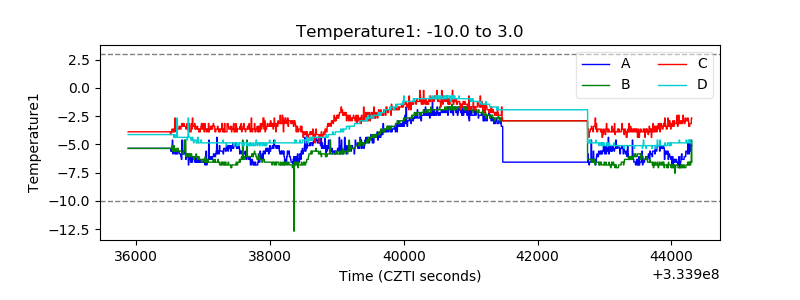 |
| Veto HV Monitor | 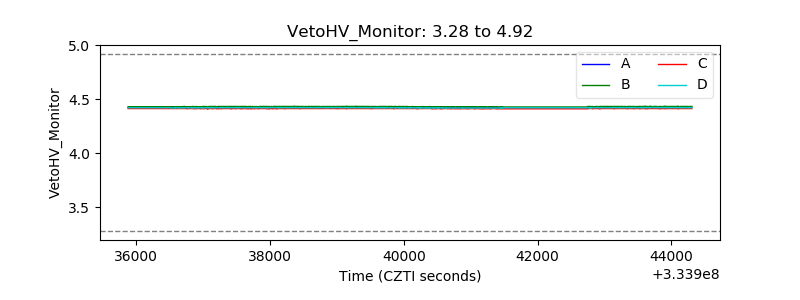 |
| Veto LLD | 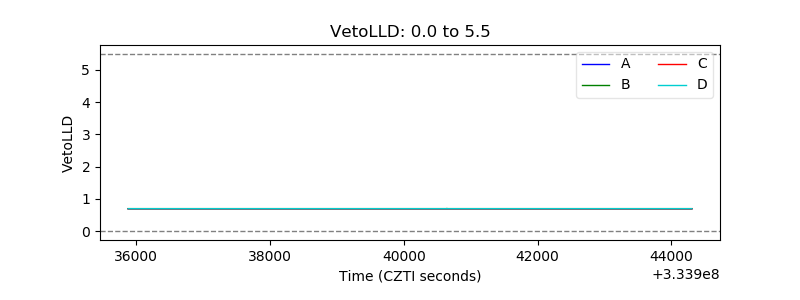 |
| Alpha Counter | 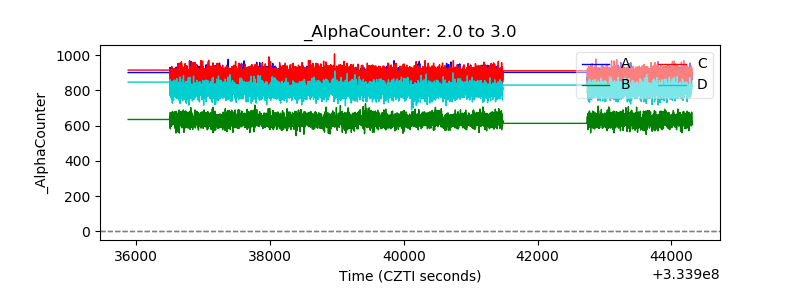 |
| _CPM_Rate | 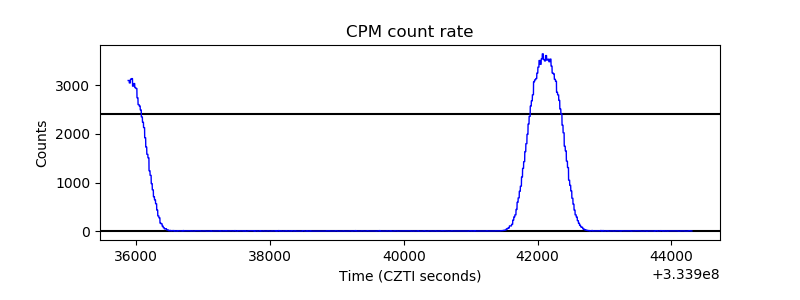 |
| CZT Counter | 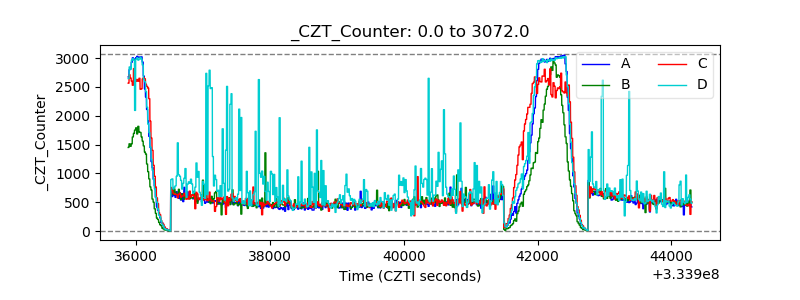 |
| +2.5 Volts monitor |  |
| +5 Volts monitor |  |
| _ROLL_ROT | 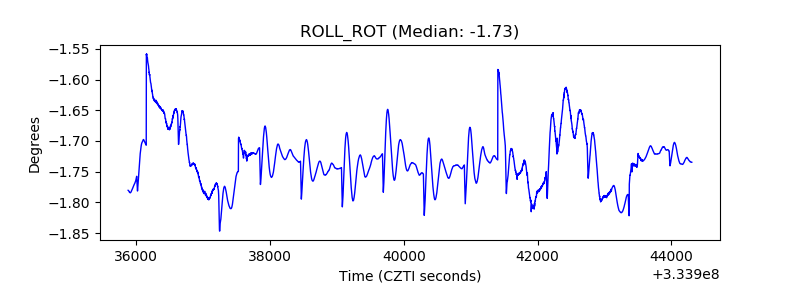 |
| _Roll_DEC | 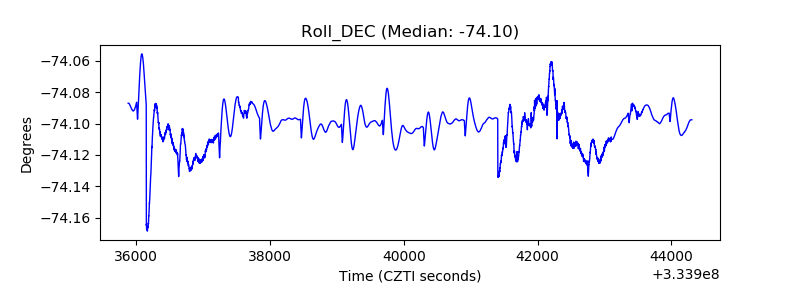 |
| _Roll_RA | 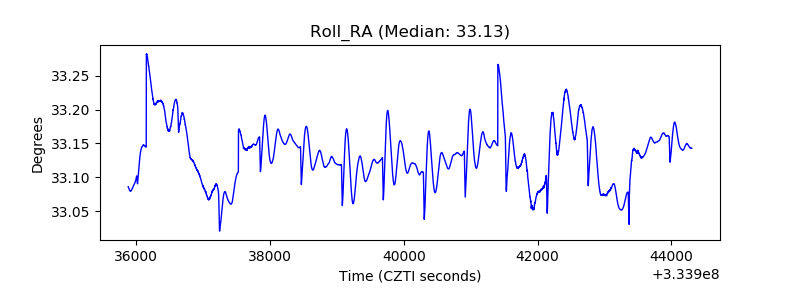 |
| Veto Counter | 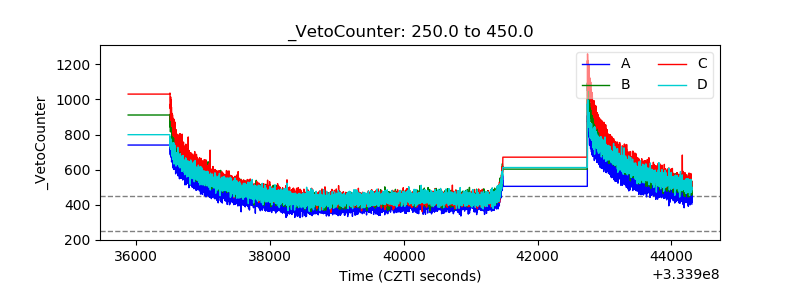 |