| Param | Original file | Final file |
|---|---|---|
| Filename | modeM0/AS1A09_012T02_9000003780_26184cztM0_level2.evt | modeM0/AS1A09_012T02_9000003780_26184cztM0_level2_quad_clean.evt |
| Size (bytes) | 493,793,280 | 146,597,760 |
| Size | 470.9 MB | 139.8 MB |
| Events in quadrant A | 3,257,397 | 993,800 |
| Events in quadrant B | 3,503,058 | 1,026,403 |
| Events in quadrant C | 3,485,763 | 1,007,273 |
| Events in quadrant D | 4,278,642 | 971,154 |
| Mode M0 | |||
|---|---|---|---|
| Quadrant | BADHDUFLAG | Total packets | Discarded packets |
| A | 0 | 13477 | 0 |
| B | 0 | 14429 | 0 |
| C | 0 | 14218 | 0 |
| D | 0 | 16745 | 0 |
| Mode M9 | |||
|---|---|---|---|
| Quadrant | BADHDUFLAG | Total packets | Discarded packets |
| A | 0 | 16 | 0 |
| B | 0 | 17 | 0 |
| C | 0 | 17 | 0 |
| D | 0 | 17 | 0 |
| Quadrant | Total seconds | Saturated seconds | Saturation percentage |
|---|---|---|---|
| A | 6335 | 11 | 0.173639% |
| B | 6335 | 27 | 0.426204% |
| C | 6335 | 76 | 1.199684% |
| D | 6335 | 158 | 2.494081% |
Noise dominated data is calculated using 1-second bins in cleaned event files. If a bin has >2000 counts, and if more than 50% of those come from <1% of pixels, then it is considered to be noise-dominated and hence unusable.
| Quadrant | # 1 sec bins | Bins with >0 counts | Bins with >2000 counts | High rate bins dominated by noise | Noise dominated (total time) | Noise dominated (detector-on time) | Marked lightcurve |
|---|---|---|---|---|---|---|---|
| A | 7695 | 6336 | 0 | 0 | 0.00% | 0.00% | 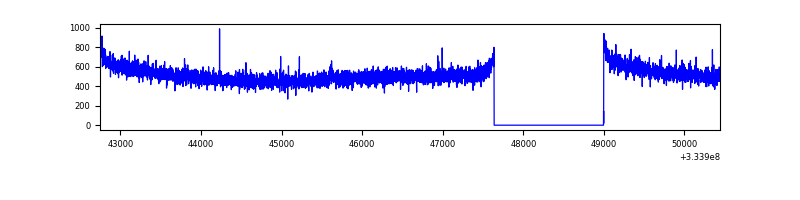 |
| B | 7695 | 6336 | 0 | 0 | 0.00% | 0.00% | 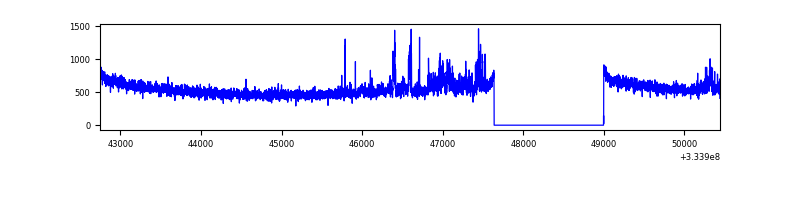 |
| C | 7695 | 6336 | 0 | 0 | 0.00% | 0.00% | 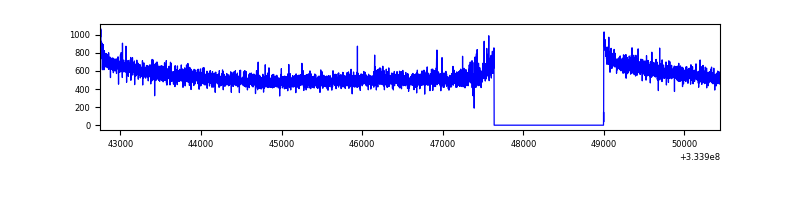 |
| D | 7695 | 6336 | 160 | 160 | 2.08% | 2.53% | 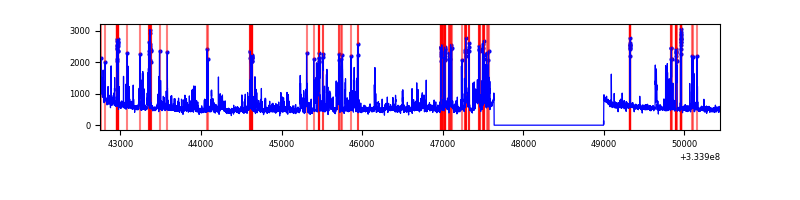 |
Top three noisy pixels from each quadrant. If the there are fewer than three noisy pixels in the level2.evt file, extra rows are filled as -1
| Pixel properties | Quadrant properties | ||||||
|---|---|---|---|---|---|---|---|
| Quadrant | DetID | PixID | Counts | Sigma | Mean | Median | Sigma |
| A | 13 | 254 | 9932 | 54.33 | 844 | 830 | 167.5 |
| A | 0 | 226 | 7200 | 38.02 | 844 | 830 | 167.5 |
| A | 3 | 137 | 6867 | 36.03 | 844 | 830 | 167.5 |
| B | 0 | 190 | 137527 | 885.11 | 848 | 830 | 154.4 |
| B | 3 | 112 | 36001 | 227.73 | 848 | 830 | 154.4 |
| B | 0 | 230 | 23273 | 145.32 | 848 | 830 | 154.4 |
| C | 14 | 238 | 138033 | 708.14 | 845 | 853 | 193.7 |
| C | 3 | 233 | 49658 | 251.94 | 845 | 853 | 193.7 |
| C | 13 | 61 | 5821 | 25.65 | 845 | 853 | 193.7 |
| D | 1 | 52 | 969826 | 4934.73 | 836 | 817 | 196.4 |
| D | 12 | 227 | 57118 | 286.71 | 836 | 817 | 196.4 |
| D | 10 | 103 | 45373 | 226.9 | 836 | 817 | 196.4 |
Histogram calculated using DETX and DETY for each event in the final _common_clean file
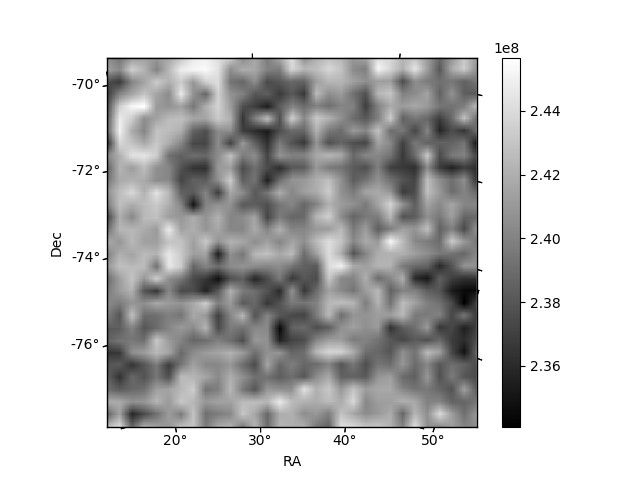
| Quadrant A | 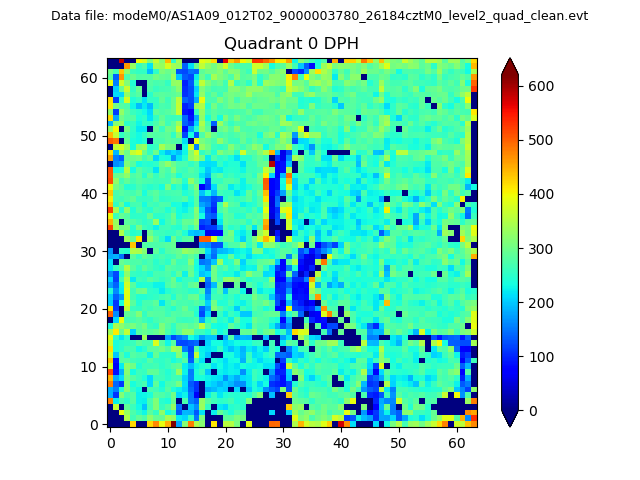 |
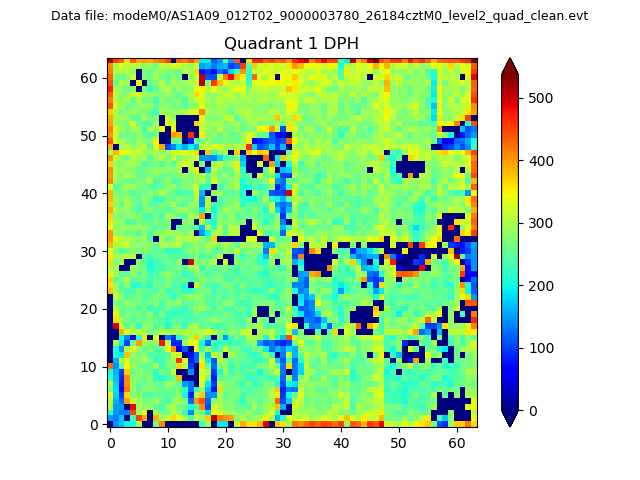 |
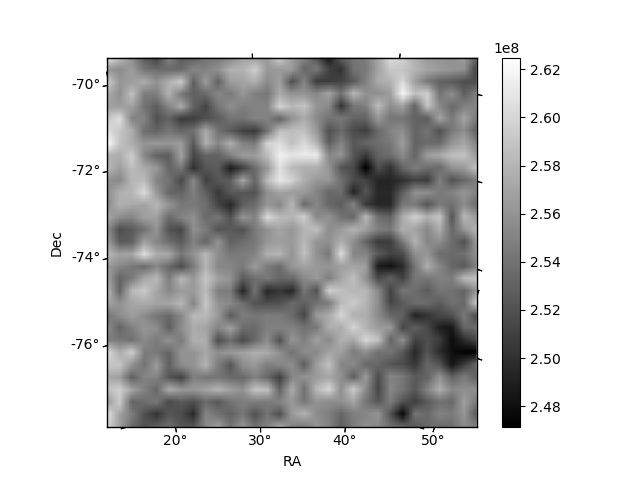
Quadrant B |
|---|---|---|---|
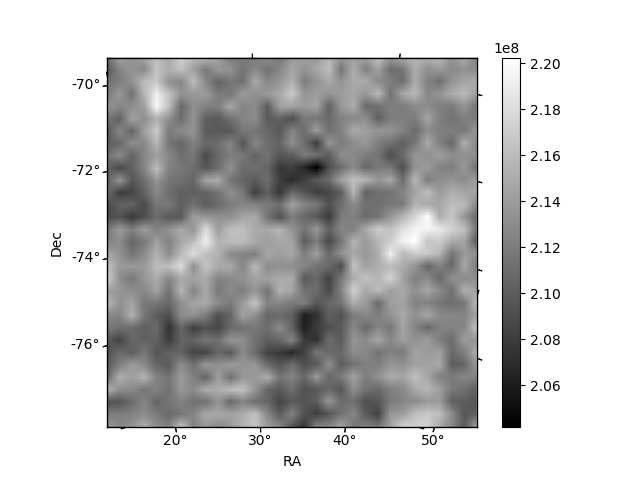
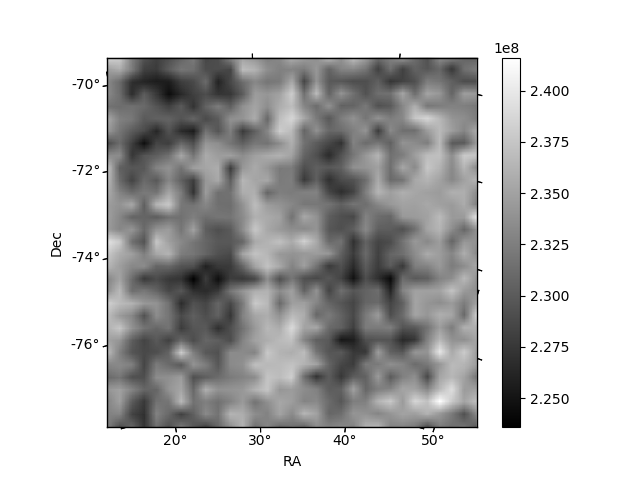
| Quadrant D |  |
 |
Quadrant C |
| Plot type | Count rate plots | Images |
|---|---|---|
| Comparison with Poisson distribution Blue bars denote a histogram of data divided into 1 sec bins. Red curve is a Poisson curve with rate = median count rate of data. |
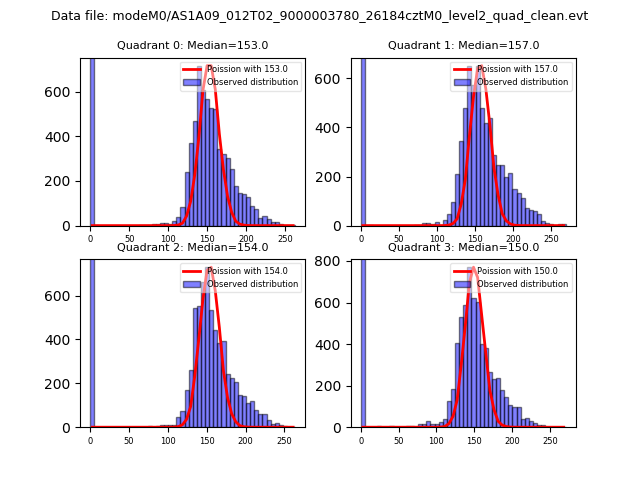 |
 |
| Quadrant-wise count rates Data is divided into 100 sec bins |
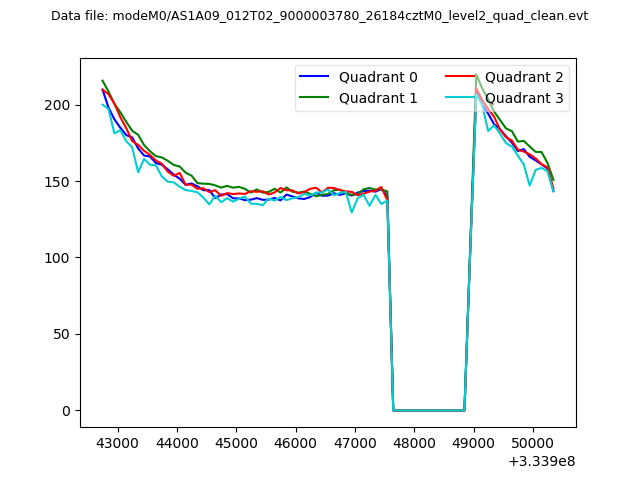 |
|
| Module-wise count rates for Quadrant A Data is divided into 100 sec bins |
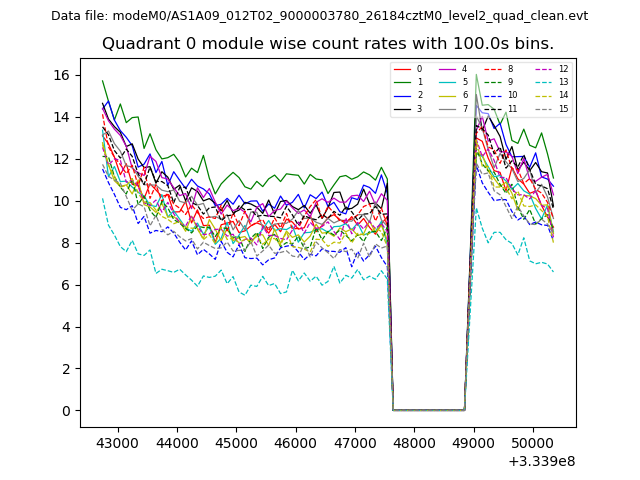 |
 |
| Module-wise count rates for Quadrant B Data is divided into 100 sec bins |
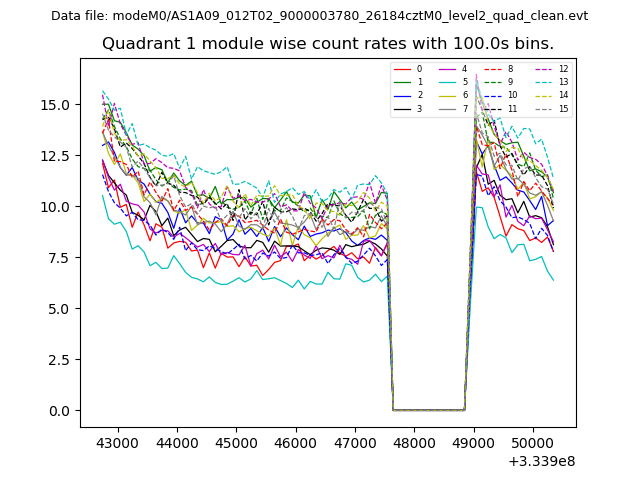 |
 |
| Module-wise count rates for Quadrant C Data is divided into 100 sec bins |
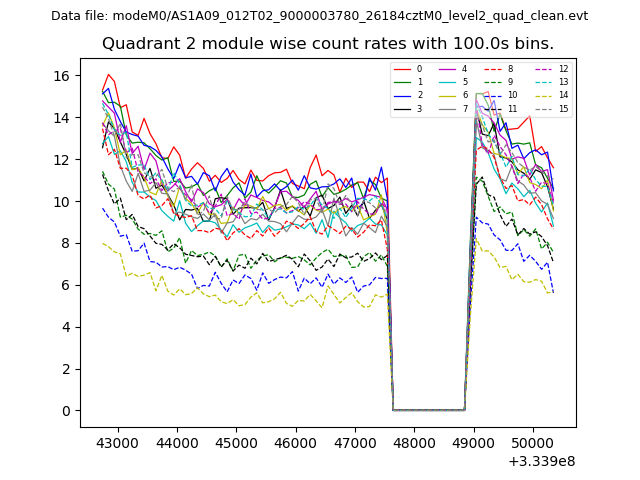 |
 |
| Module-wise count rates for Quadrant D Data is divided into 100 sec bins |
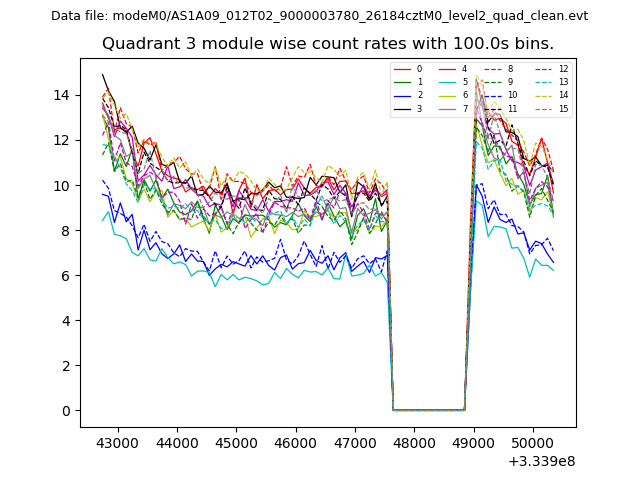 |
 |
| Parameter | Plot |
|---|---|
| CZT HV Monitor | 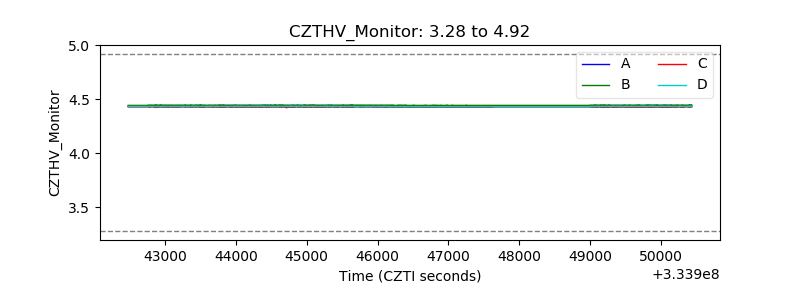 |
| D_VDD | 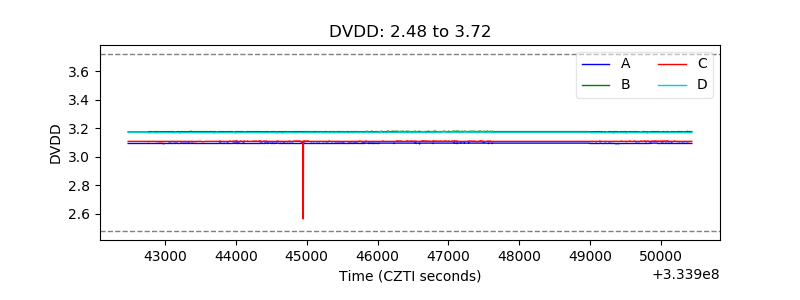 |
| Temperature 1 | 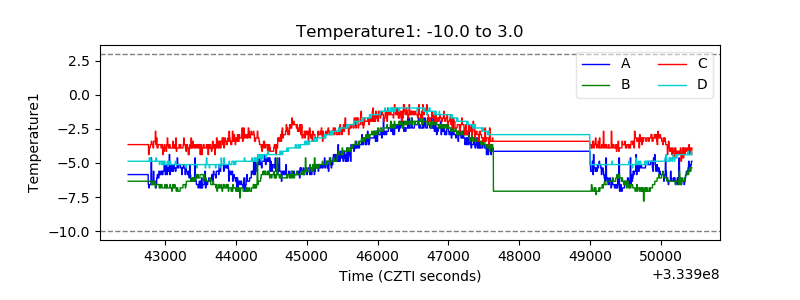 |
| Veto HV Monitor | 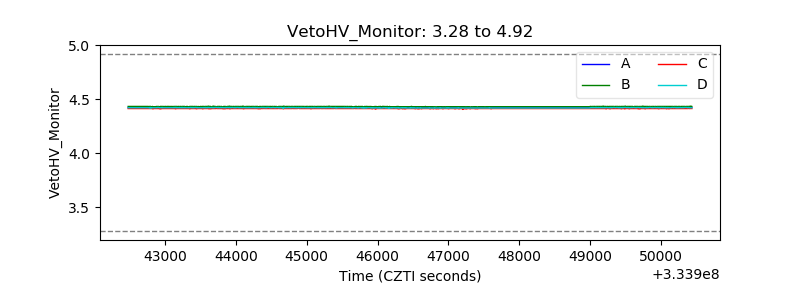 |
| Veto LLD | 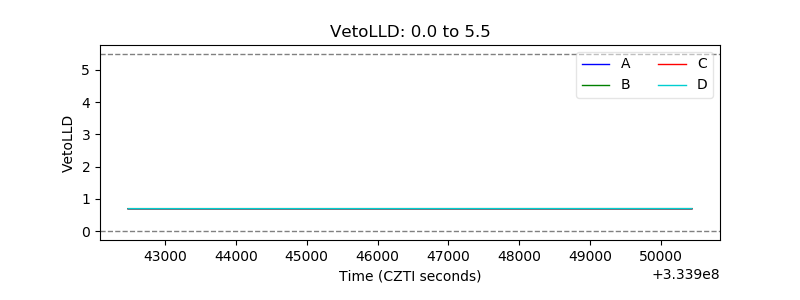 |
| Alpha Counter | 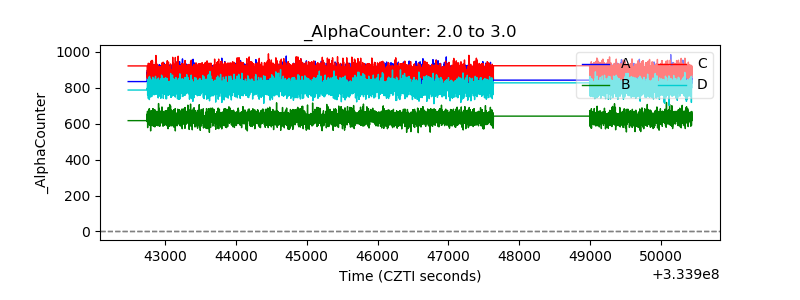 |
| _CPM_Rate | 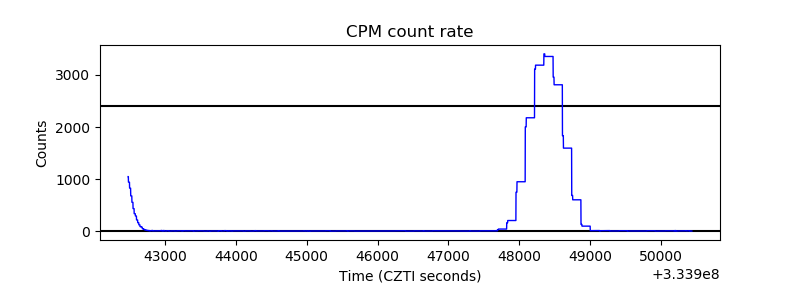 |
| CZT Counter |  |
| +2.5 Volts monitor |  |
| +5 Volts monitor | 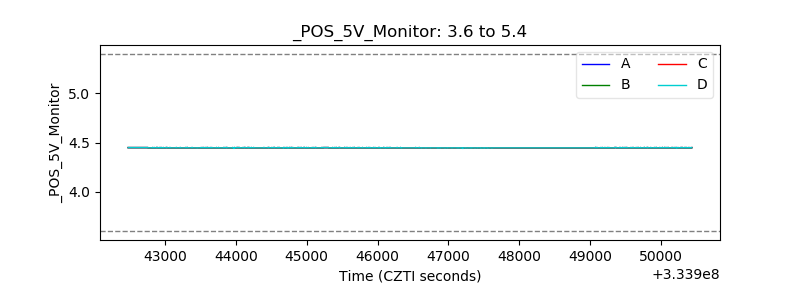 |
| _ROLL_ROT | 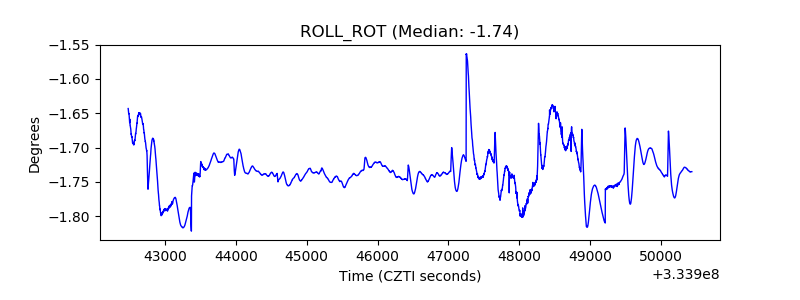 |
| _Roll_DEC | 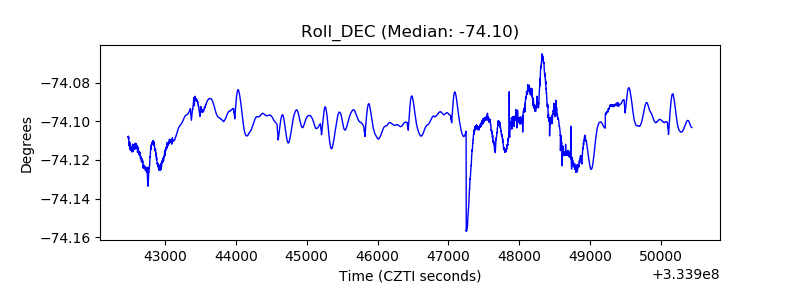 |
| _Roll_RA | 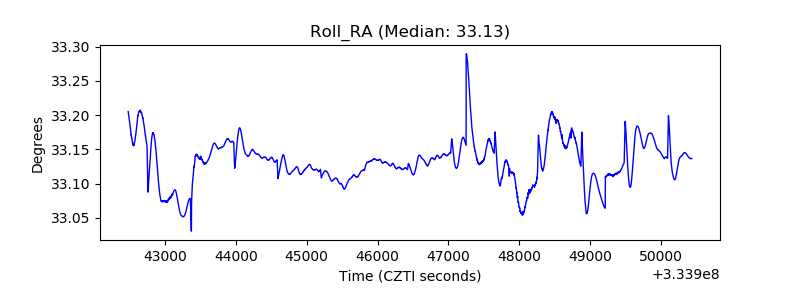 |
| Veto Counter | 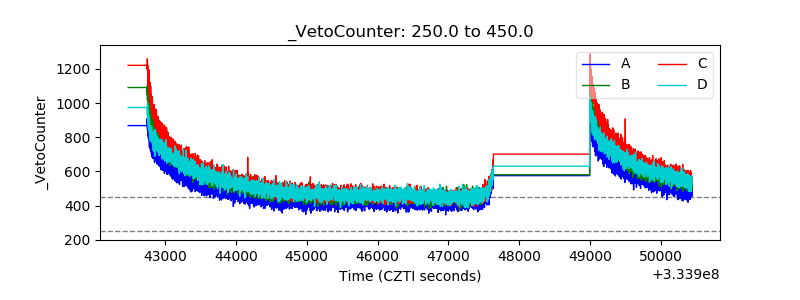 |