| Param | Original file | Final file |
|---|---|---|
| Filename | modeM0/AS1A09_012T02_9000003780_26185cztM0_level2.evt | modeM0/AS1A09_012T02_9000003780_26185cztM0_level2_quad_clean.evt |
| Size (bytes) | 455,696,640 | 133,646,400 |
| Size | 434.6 MB | 127.5 MB |
| Events in quadrant A | 2,980,813 | 905,596 |
| Events in quadrant B | 3,244,647 | 933,132 |
| Events in quadrant C | 3,238,128 | 915,004 |
| Events in quadrant D | 3,942,606 | 888,009 |
| Mode M0 | |||
|---|---|---|---|
| Quadrant | BADHDUFLAG | Total packets | Discarded packets |
| A | 0 | 12188 | 0 |
| B | 0 | 13123 | 0 |
| C | 0 | 13083 | 0 |
| D | 0 | 15268 | 0 |
| Mode M9 | |||
|---|---|---|---|
| Quadrant | BADHDUFLAG | Total packets | Discarded packets |
| A | 0 | 13 | 0 |
| B | 0 | 13 | 0 |
| C | 0 | 13 | 0 |
| D | 0 | 13 | 0 |
| Quadrant | Total seconds | Saturated seconds | Saturation percentage |
|---|---|---|---|
| A | 5807 | 19 | 0.327191% |
| B | 5807 | 56 | 0.964353% |
| C | 5807 | 121 | 2.083692% |
| D | 5807 | 193 | 3.323575% |
Noise dominated data is calculated using 1-second bins in cleaned event files. If a bin has >2000 counts, and if more than 50% of those come from <1% of pixels, then it is considered to be noise-dominated and hence unusable.
| Quadrant | # 1 sec bins | Bins with >0 counts | Bins with >2000 counts | High rate bins dominated by noise | Noise dominated (total time) | Noise dominated (detector-on time) | Marked lightcurve |
|---|---|---|---|---|---|---|---|
| A | 7167 | 5808 | 0 | 0 | 0.00% | 0.00% | 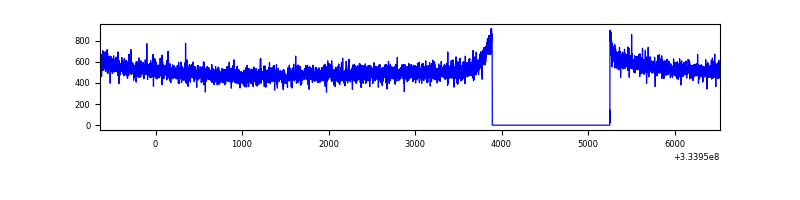 |
| B | 7167 | 5808 | 1 | 1 | 0.01% | 0.02% | 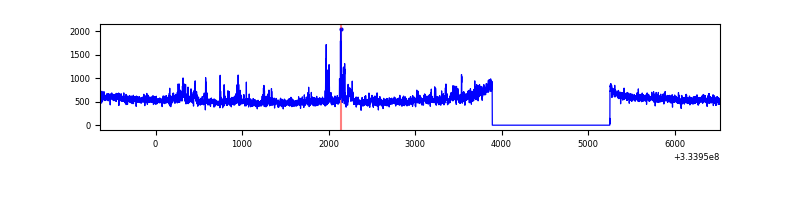 |
| C | 7167 | 5808 | 5 | 5 | 0.07% | 0.09% | 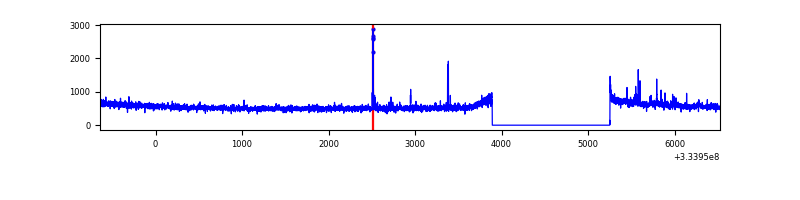 |
| D | 7167 | 5808 | 158 | 158 | 2.20% | 2.72% | 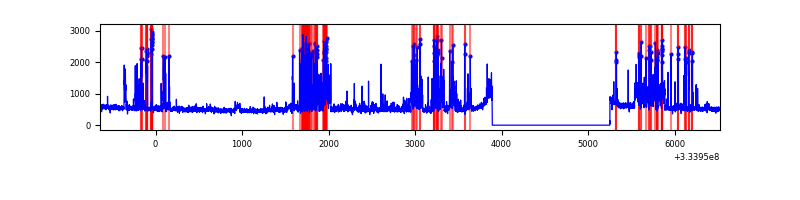 |
Top three noisy pixels from each quadrant. If the there are fewer than three noisy pixels in the level2.evt file, extra rows are filled as -1
| Pixel properties | Quadrant properties | ||||||
|---|---|---|---|---|---|---|---|
| Quadrant | DetID | PixID | Counts | Sigma | Mean | Median | Sigma |
| A | 13 | 254 | 8956 | 54.31 | 772 | 761 | 150.9 |
| A | 0 | 226 | 6609 | 38.76 | 772 | 761 | 150.9 |
| A | 3 | 137 | 6421 | 37.51 | 772 | 761 | 150.9 |
| B | 3 | 112 | 135649 | 965.08 | 769 | 749 | 139.8 |
| B | 0 | 190 | 59511 | 420.38 | 769 | 749 | 139.8 |
| B | 0 | 230 | 49450 | 348.41 | 769 | 749 | 139.8 |
| C | 14 | 238 | 124132 | 697.55 | 770 | 776 | 176.8 |
| C | 3 | 233 | 72846 | 407.54 | 770 | 776 | 176.8 |
| C | 2 | 16 | 41935 | 232.75 | 770 | 776 | 176.8 |
| D | 1 | 52 | 1033131 | 5771.47 | 767 | 752 | 178.9 |
| D | 2 | 234 | 26749 | 145.34 | 767 | 752 | 178.9 |
| D | 14 | 226 | 7630 | 38.45 | 767 | 752 | 178.9 |
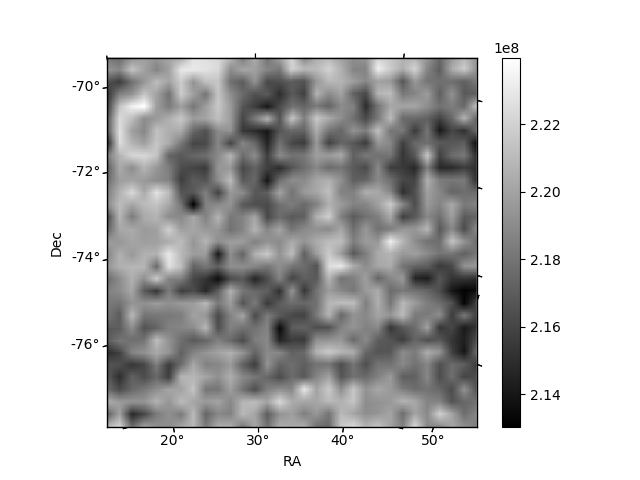
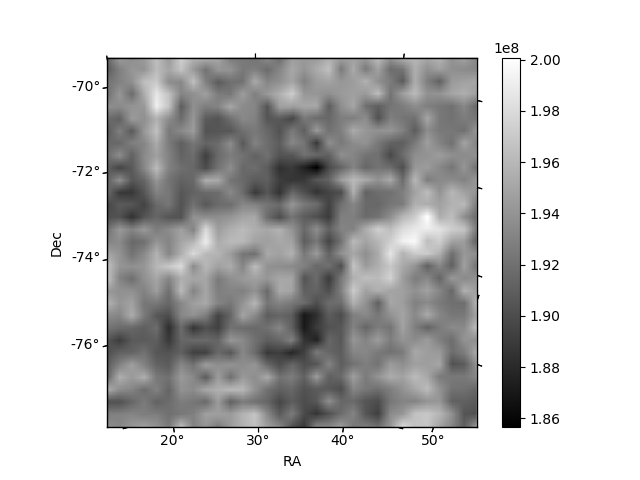
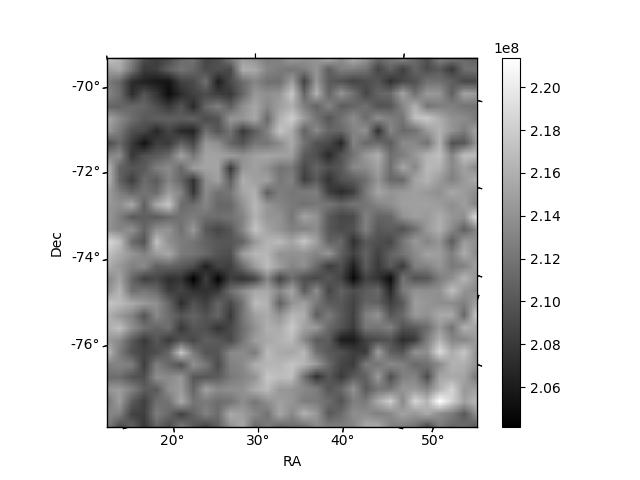
Histogram calculated using DETX and DETY for each event in the final _common_clean file
| Quadrant A | 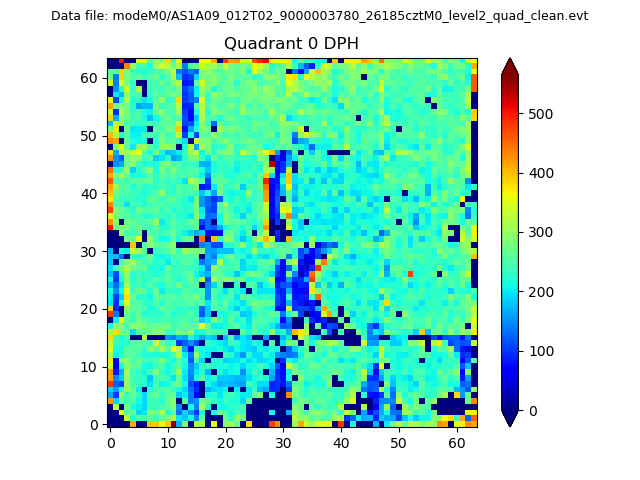 |
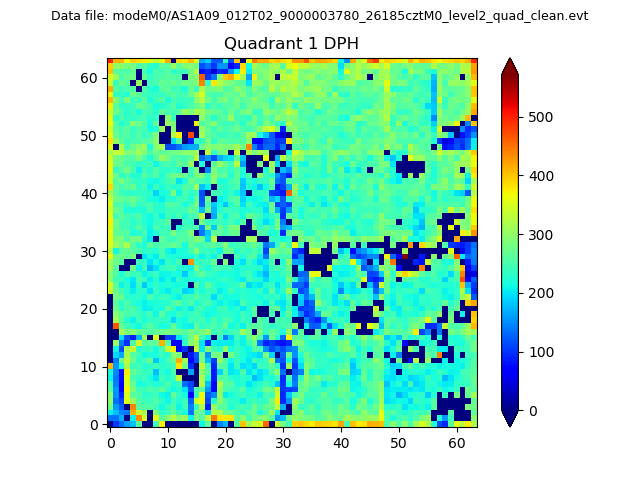 |
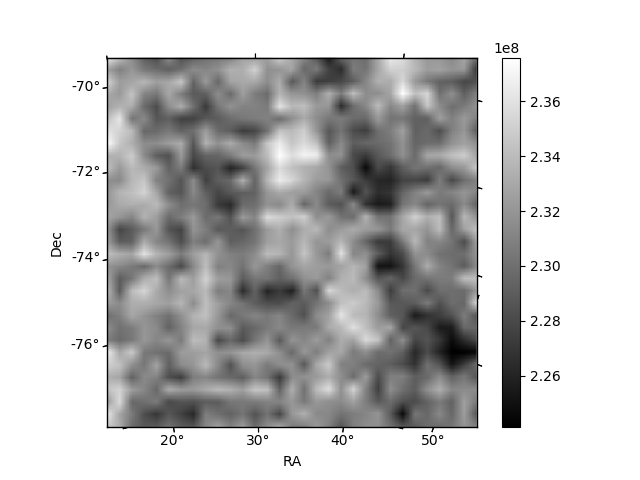
Quadrant B |
|---|---|---|---|
| Quadrant D |  |
 |
Quadrant C |
| Plot type | Count rate plots | Images |
|---|---|---|
| Comparison with Poisson distribution Blue bars denote a histogram of data divided into 1 sec bins. Red curve is a Poisson curve with rate = median count rate of data. |
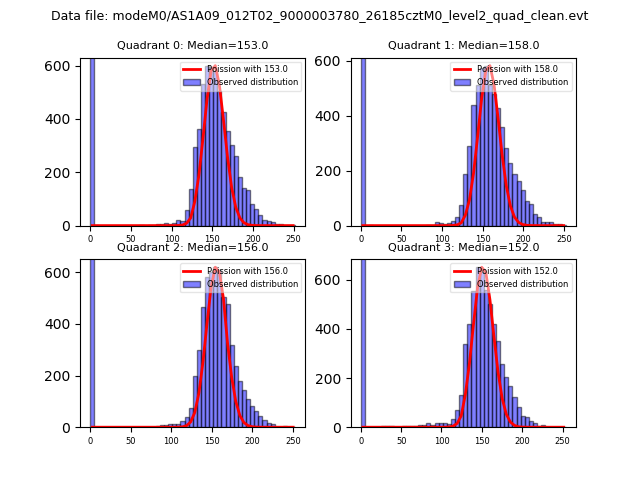 |
 |
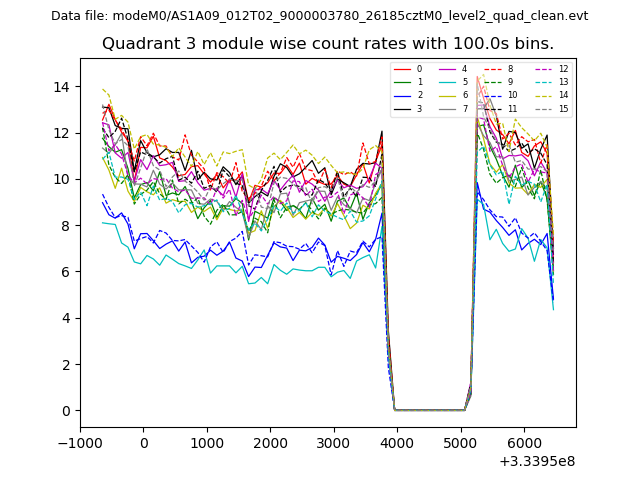
| Quadrant-wise count rates Data is divided into 100 sec bins |
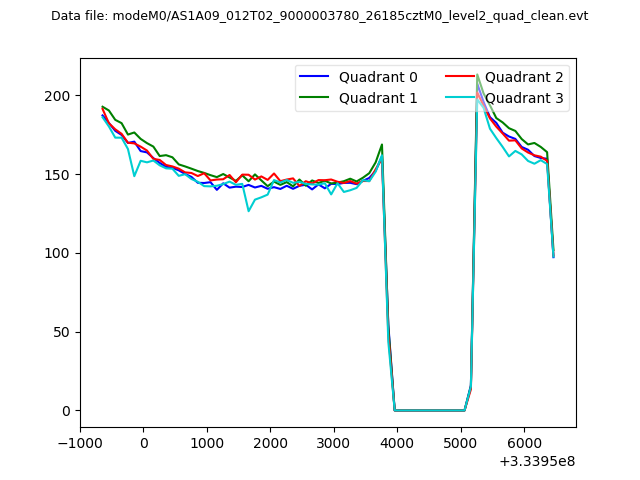 |
|
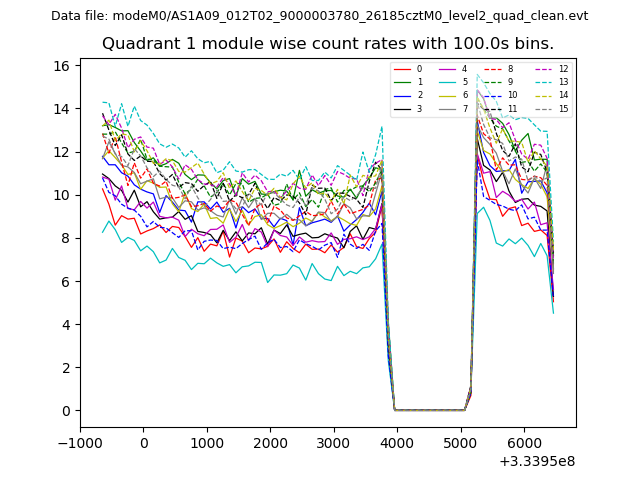
| Module-wise count rates for Quadrant A Data is divided into 100 sec bins |
 |
 |
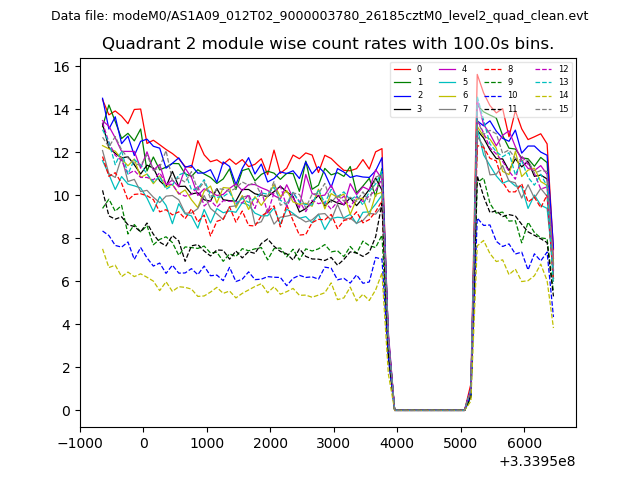
| Module-wise count rates for Quadrant B Data is divided into 100 sec bins |
 |
 |
| Module-wise count rates for Quadrant C Data is divided into 100 sec bins |
 |
 |
| Module-wise count rates for Quadrant D Data is divided into 100 sec bins |
 |
 |
| Parameter | Plot |
|---|---|
| CZT HV Monitor | 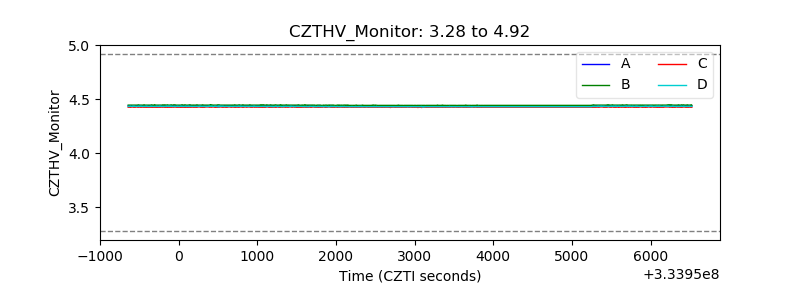 |
| D_VDD | 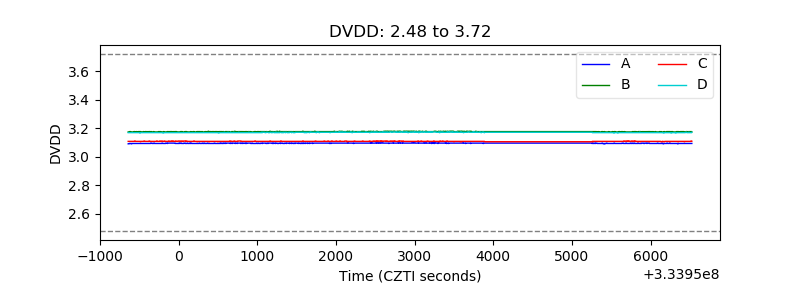 |
| Temperature 1 | 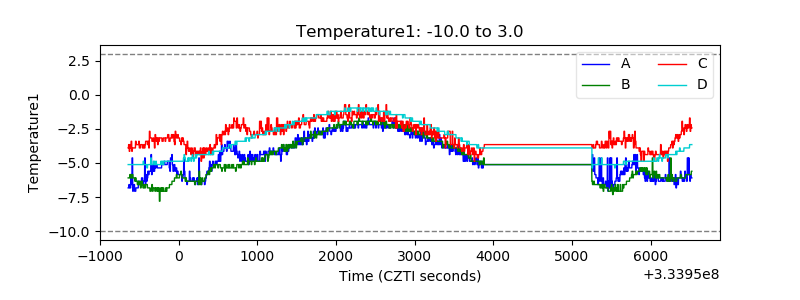 |
| Veto HV Monitor | 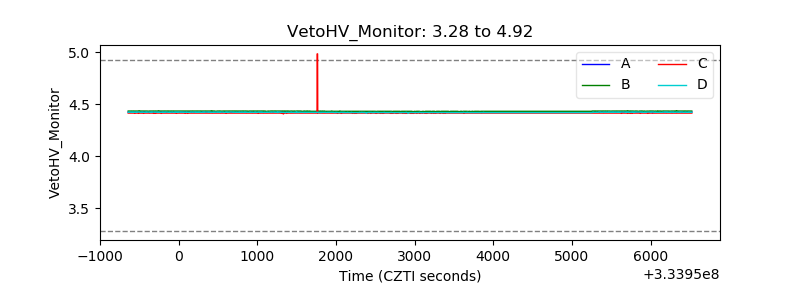 |
| Veto LLD | 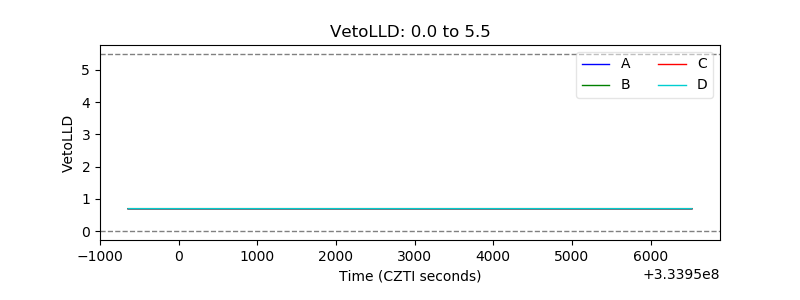 |
| Alpha Counter | 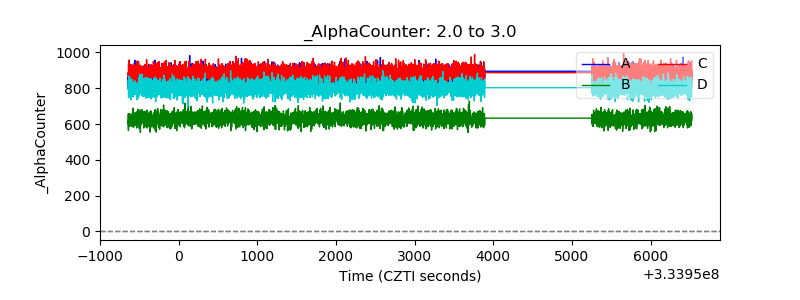 |
| _CPM_Rate | 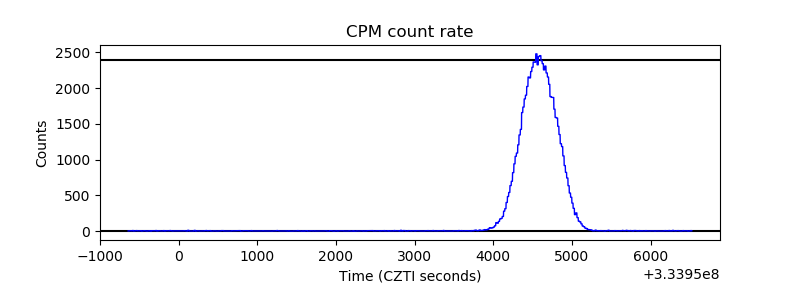 |
| CZT Counter |  |
| +2.5 Volts monitor |  |
| +5 Volts monitor | 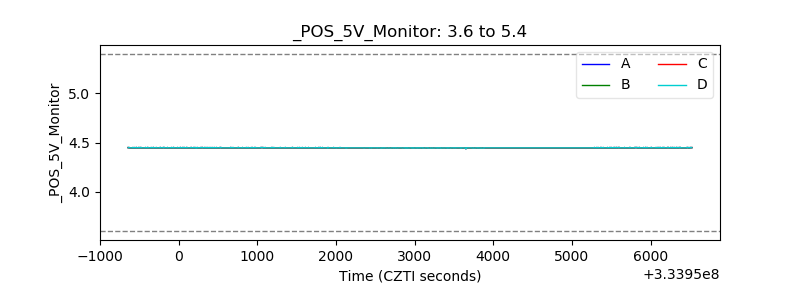 |
| _ROLL_ROT | 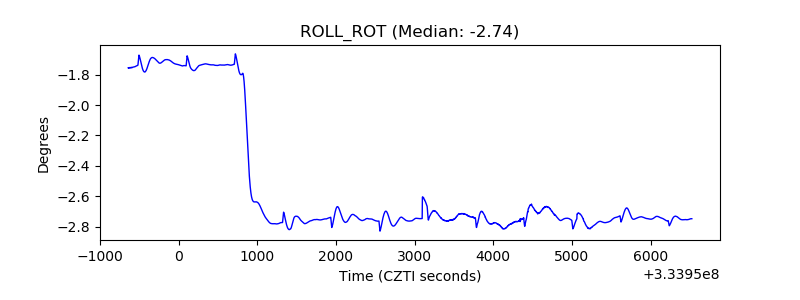 |
| _Roll_DEC | 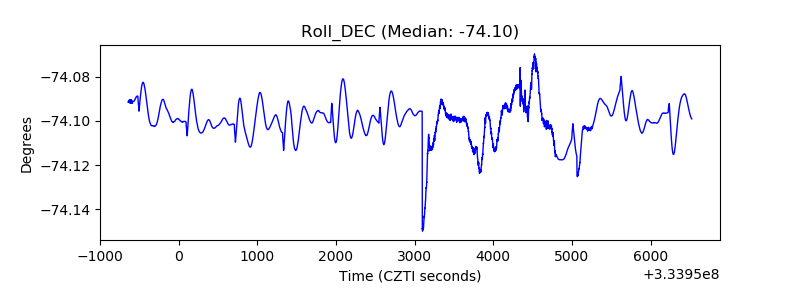 |
| _Roll_RA |  |
| Veto Counter | 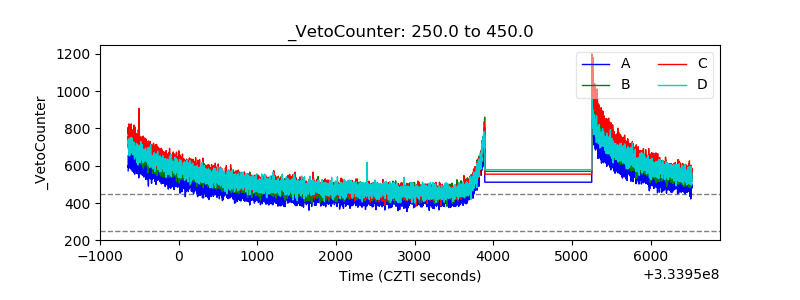 |