| Param | Original file | Final file |
|---|---|---|
| Filename | modeM0/AS1A09_012T02_9000003780_26187cztM0_level2.evt | modeM0/AS1A09_012T02_9000003780_26187cztM0_level2_quad_clean.evt |
| Size (bytes) | 294,883,200 | 87,053,760 |
| Size | 281.2 MB | 83.0 MB |
| Events in quadrant A | 1,961,028 | 585,891 |
| Events in quadrant B | 2,042,872 | 595,742 |
| Events in quadrant C | 2,066,949 | 590,134 |
| Events in quadrant D | 2,582,739 | 578,493 |
| Mode M0 | |||
|---|---|---|---|
| Quadrant | BADHDUFLAG | Total packets | Discarded packets |
| A | 0 | 8276 | 0 |
| B | 0 | 8484 | 0 |
| C | 0 | 8566 | 0 |
| D | 0 | 10243 | 0 |
| Mode M9 | |||
|---|---|---|---|
| Quadrant | BADHDUFLAG | Total packets | Discarded packets |
| A | 1 | 139966887217960 | 46 |
| B | 1 | -1 | -1 |
| C | 1 | -1 | -1 |
| D | 1 | -1 | -1 |
| Quadrant | Total seconds | Saturated seconds | Saturation percentage |
|---|---|---|---|
| A | 4063 | 13 | 0.319961% |
| B | 4063 | 18 | 0.443022% |
| C | 4063 | 46 | 1.132168% |
| D | 4063 | 82 | 2.018213% |
Noise dominated data is calculated using 1-second bins in cleaned event files. If a bin has >2000 counts, and if more than 50% of those come from <1% of pixels, then it is considered to be noise-dominated and hence unusable.
| Quadrant | # 1 sec bins | Bins with >0 counts | Bins with >2000 counts | High rate bins dominated by noise | Noise dominated (total time) | Noise dominated (detector-on time) | Marked lightcurve |
|---|---|---|---|---|---|---|---|
| A | 4063 | 4063 | 0 | 0 | 0.00% | 0.00% | 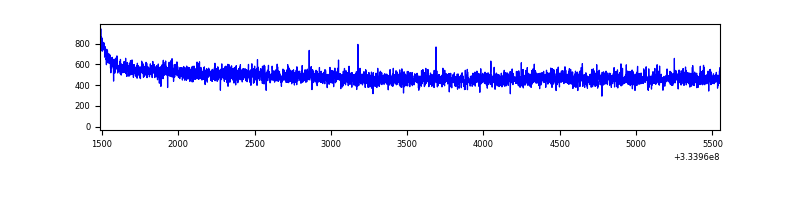 |
| B | 4063 | 4063 | 0 | 0 | 0.00% | 0.00% | 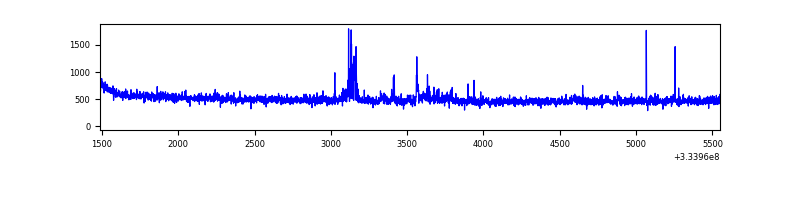 |
| C | 4063 | 4063 | 1 | 1 | 0.02% | 0.02% | 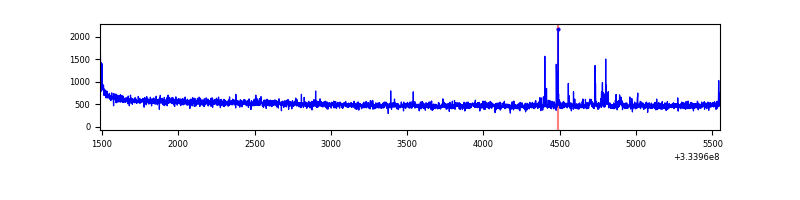 |
| D | 4063 | 4063 | 60 | 60 | 1.48% | 1.48% | 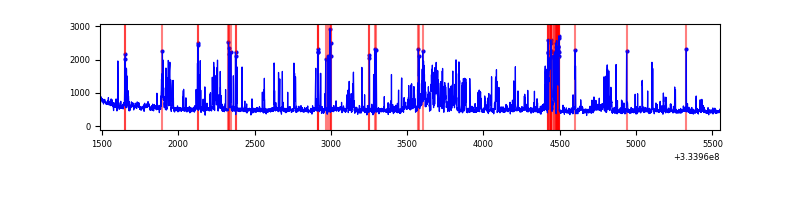 |
Top three noisy pixels from each quadrant. If the there are fewer than three noisy pixels in the level2.evt file, extra rows are filled as -1
| Pixel properties | Quadrant properties | ||||||
|---|---|---|---|---|---|---|---|
| Quadrant | DetID | PixID | Counts | Sigma | Mean | Median | Sigma |
| A | 13 | 254 | 6169 | 56.33 | 508 | 498 | 100.7 |
| A | 0 | 226 | 4444 | 39.2 | 508 | 498 | 100.7 |
| A | 3 | 137 | 4223 | 37.0 | 508 | 498 | 100.7 |
| B | 0 | 230 | 52232 | 561.7 | 500 | 489 | 92.1 |
| B | 0 | 190 | 20979 | 222.43 | 500 | 489 | 92.1 |
| B | 12 | 111 | 10789 | 111.81 | 500 | 489 | 92.1 |
| C | 14 | 238 | 80843 | 703.91 | 494 | 497 | 114.1 |
| C | 2 | 16 | 31531 | 271.89 | 494 | 497 | 114.1 |
| C | 3 | 233 | 20198 | 172.6 | 494 | 497 | 114.1 |
| D | 1 | 52 | 640704 | 5428.25 | 500 | 490 | 117.9 |
| D | 12 | 233 | 28087 | 233.99 | 500 | 490 | 117.9 |
| D | 2 | 234 | 16104 | 132.39 | 500 | 490 | 117.9 |
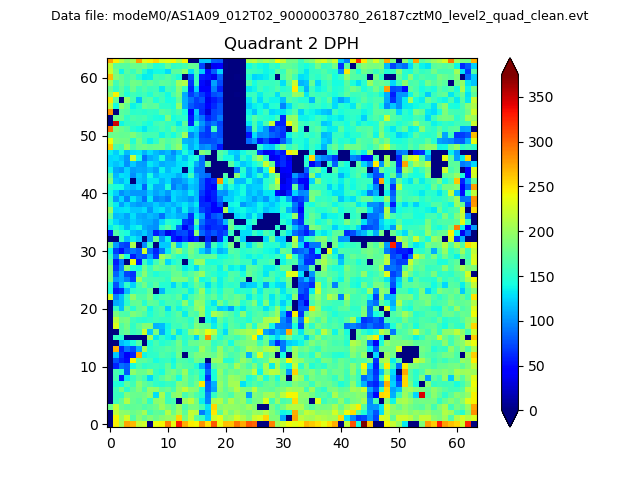
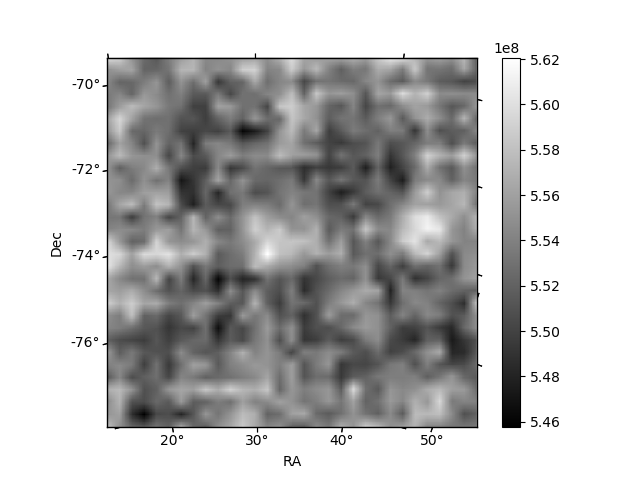
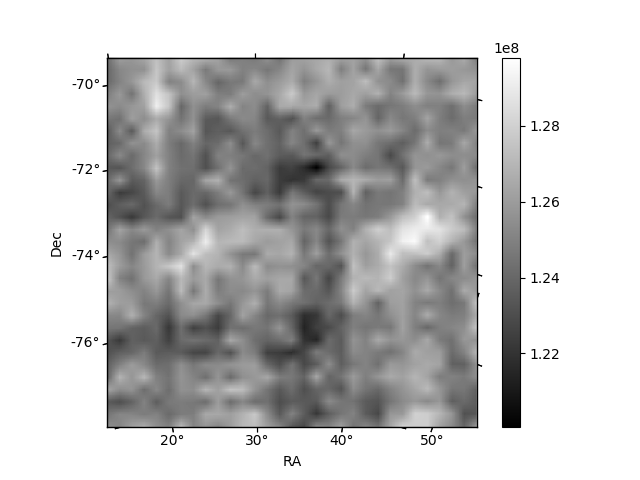
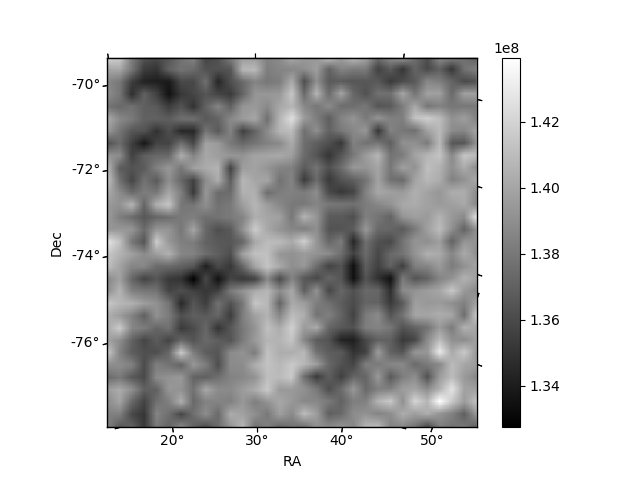
Histogram calculated using DETX and DETY for each event in the final _common_clean file
| Quadrant A | 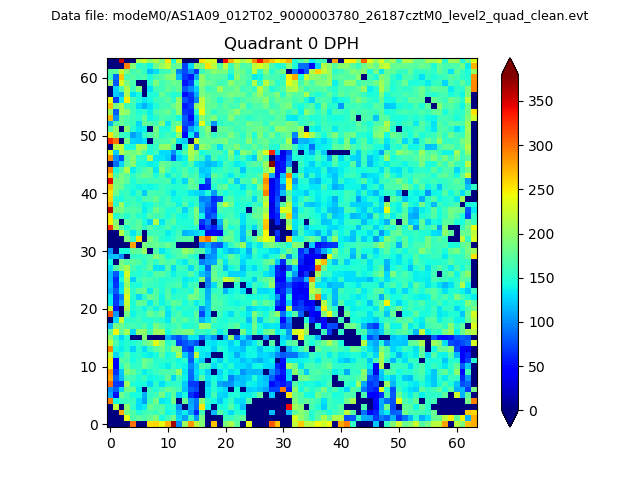 |
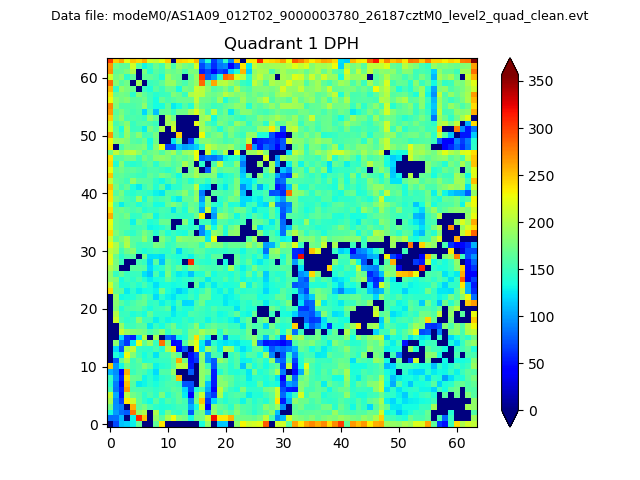 |
Quadrant B |
|---|---|---|---|
| Quadrant D | 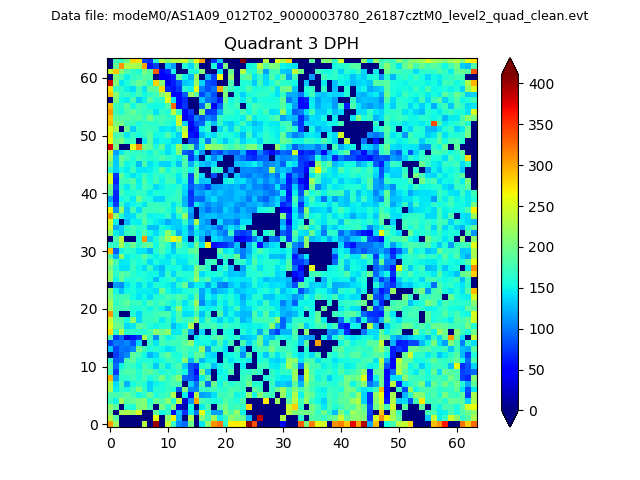 |
 |
Quadrant C |
| Plot type | Count rate plots | Images |
|---|---|---|
| Comparison with Poisson distribution Blue bars denote a histogram of data divided into 1 sec bins. Red curve is a Poisson curve with rate = median count rate of data. |
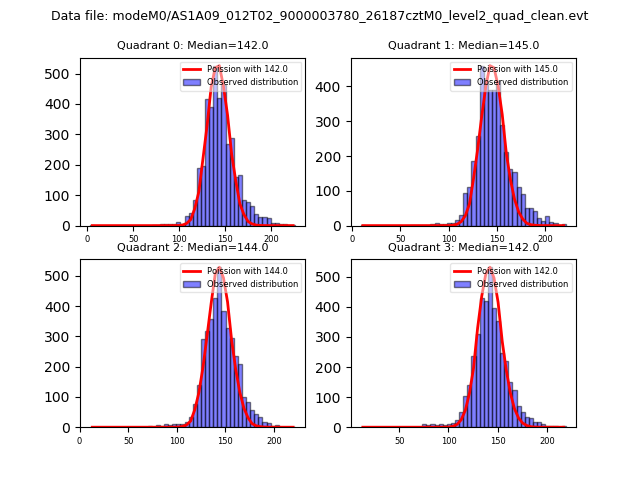 |
 |
| Quadrant-wise count rates Data is divided into 100 sec bins |
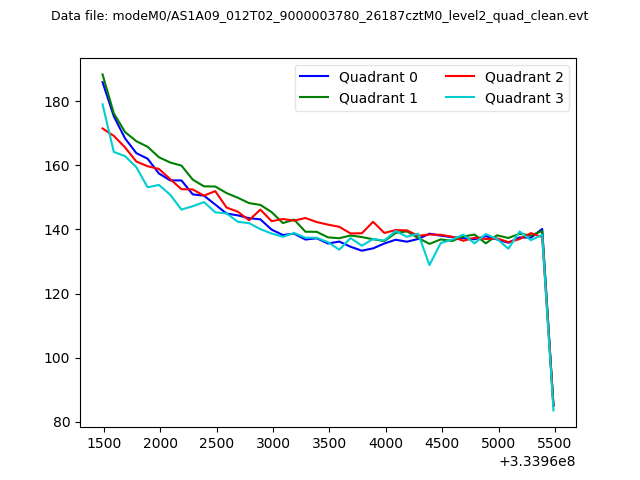 |
|
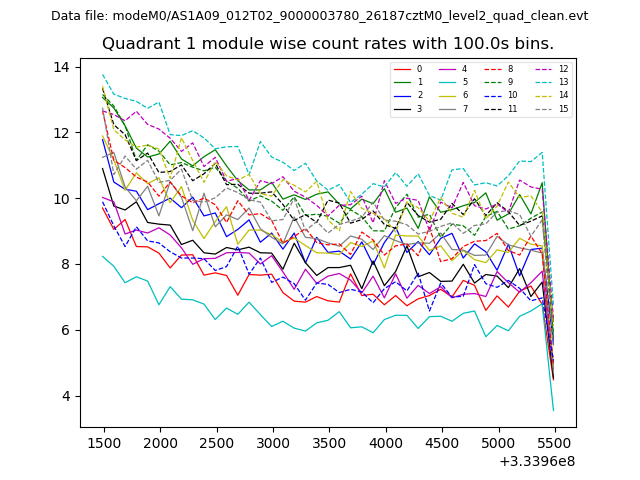
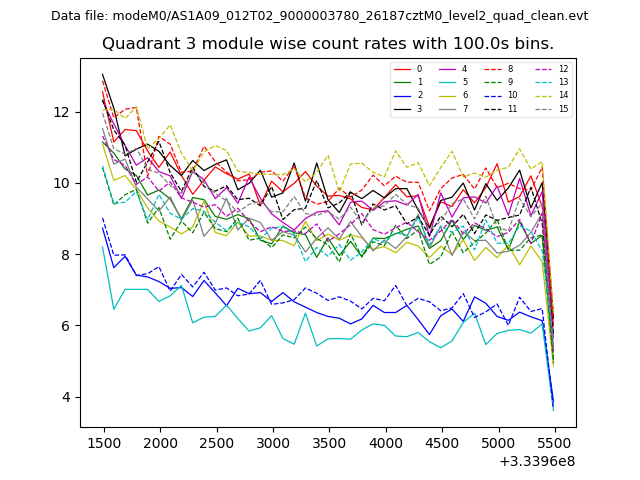
| Module-wise count rates for Quadrant A Data is divided into 100 sec bins |
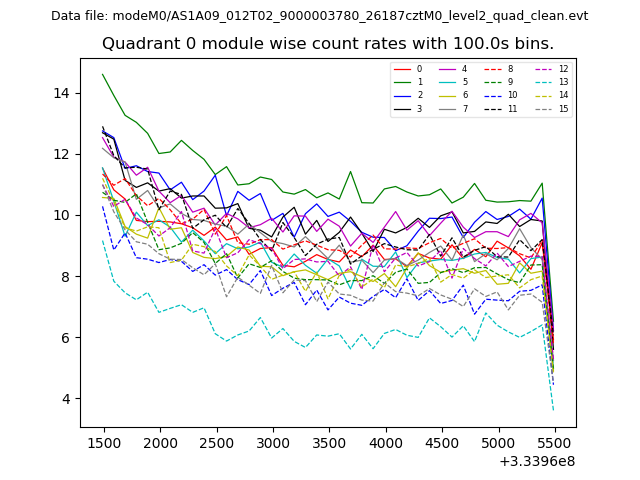 |
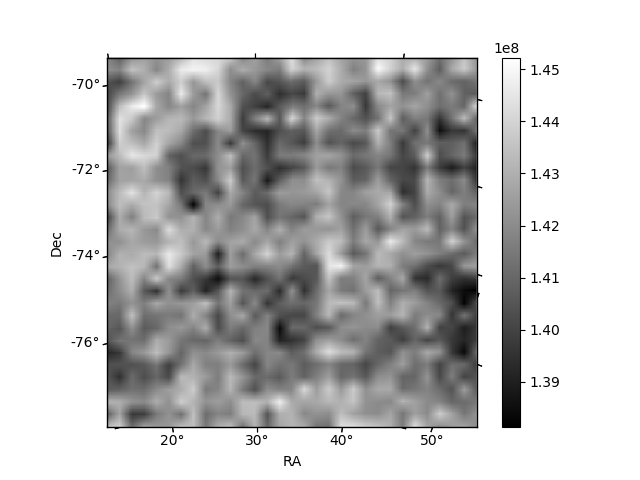 |
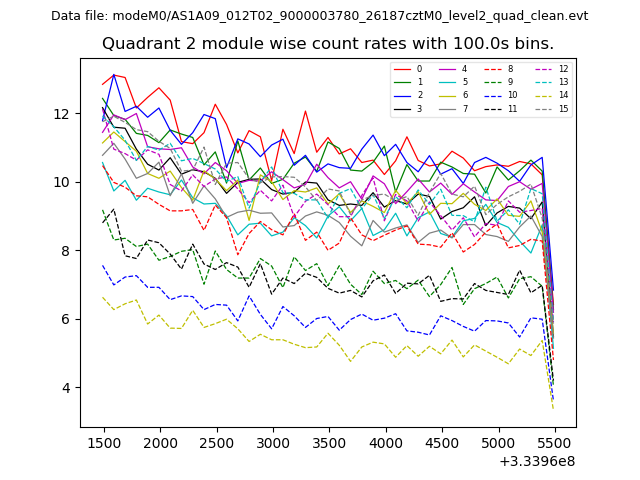
| Module-wise count rates for Quadrant B Data is divided into 100 sec bins |
 |
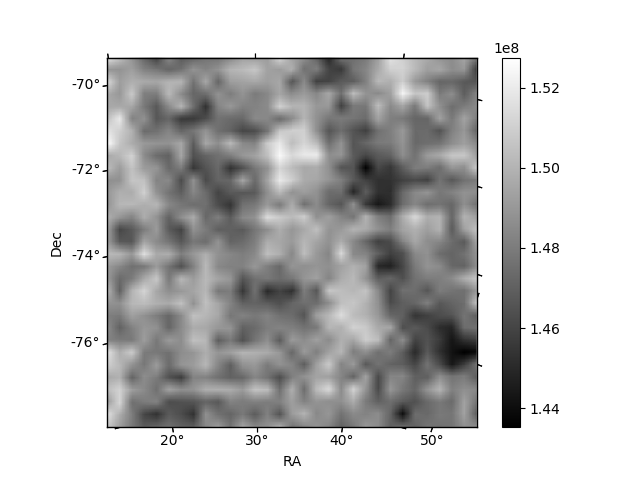 |
| Module-wise count rates for Quadrant C Data is divided into 100 sec bins |
 |
 |
| Module-wise count rates for Quadrant D Data is divided into 100 sec bins |
 |
 |
| Parameter | Plot |
|---|---|
| CZT HV Monitor | 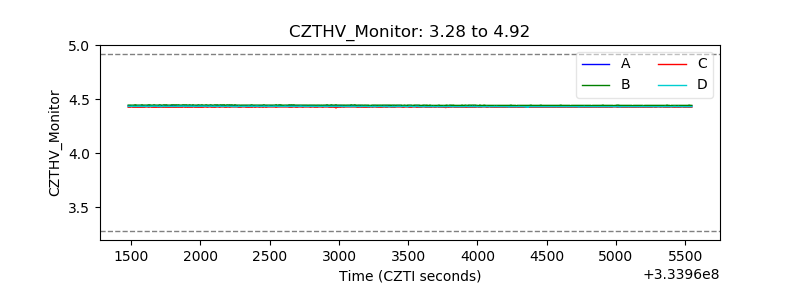 |
| D_VDD | 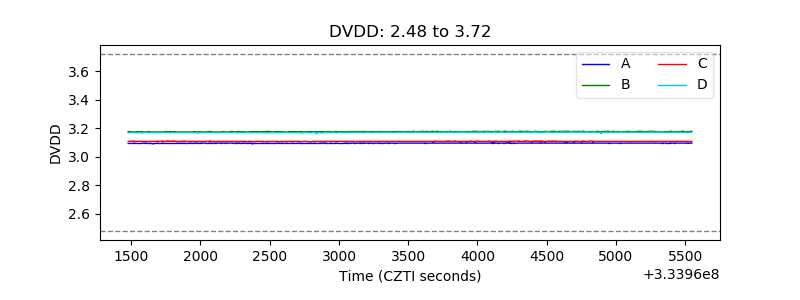 |
| Temperature 1 | 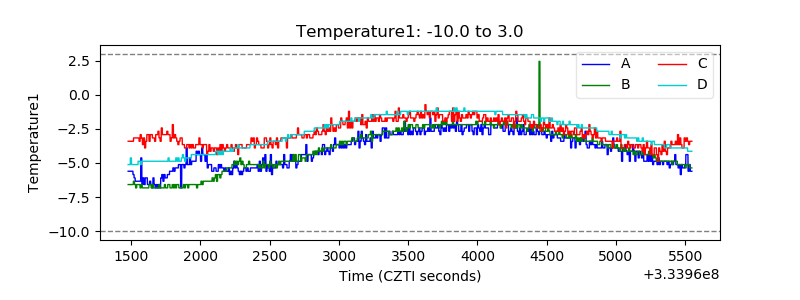 |
| Veto HV Monitor |  |
| Veto LLD |  |
| Alpha Counter | 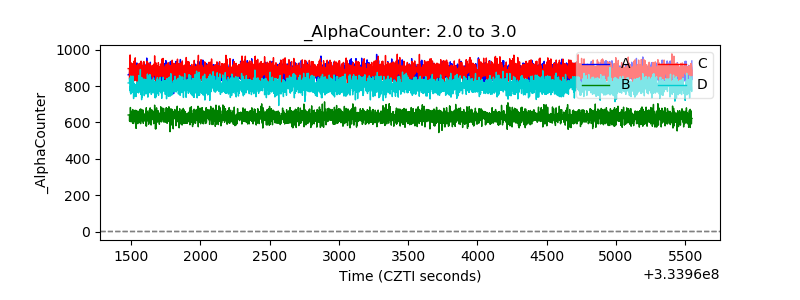 |
| _CPM_Rate | 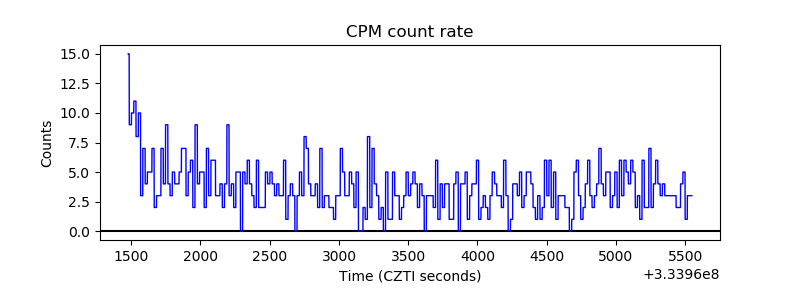 |
| CZT Counter | 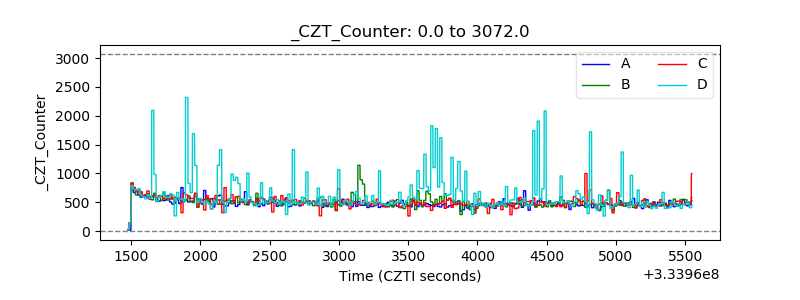 |
| +2.5 Volts monitor |  |
| +5 Volts monitor |  |
| _ROLL_ROT | 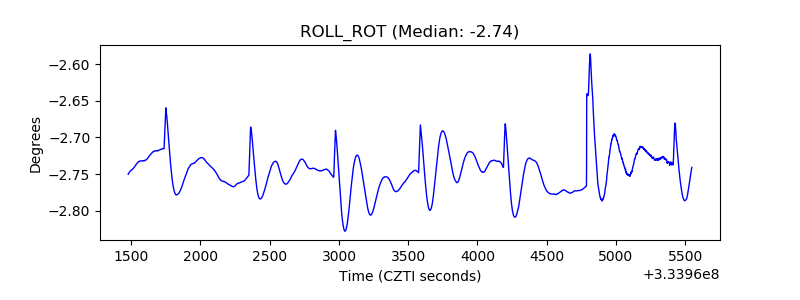 |
| _Roll_DEC | 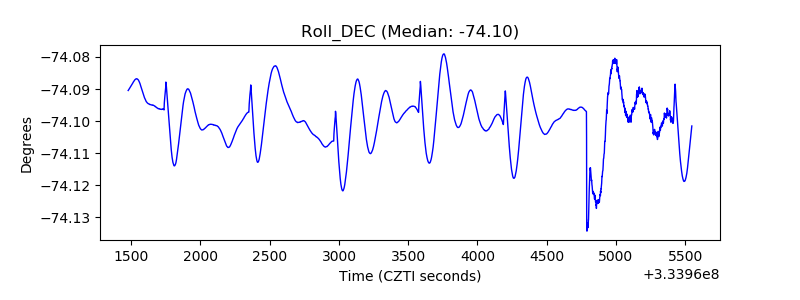 |
| _Roll_RA | 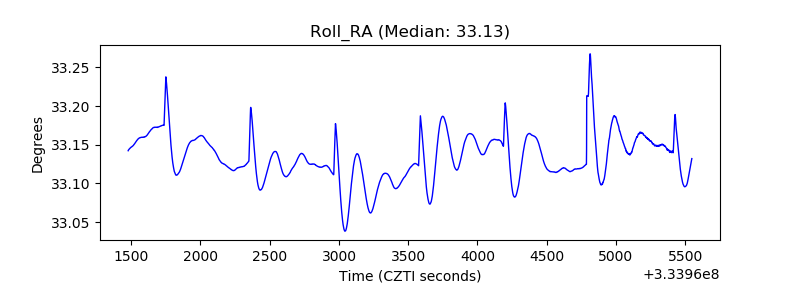 |
| Veto Counter | 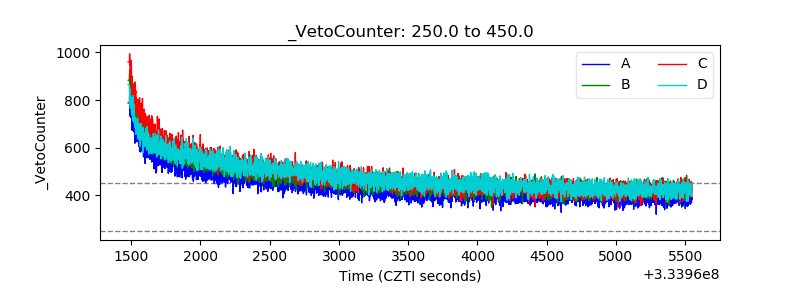 |