| Param | Original file | Final file |
|---|---|---|
| Filename | modeM0/AS1A09_012T03_9000003782cztM0_level2.fits | modeM0/AS1A09_012T03_9000003782cztM0_level2_quad_clean.evt |
| Size (bytes) | 98,133,120 | 127,984,320 |
| Size | 93.6 MB | 122.1 MB |
| Events in quadrant A | 599,572 | 815,905 |
| Events in quadrant B | 577,318 | 821,575 |
| Events in quadrant C | 591,254 | 811,798 |
| Events in quadrant D | 516,454 | 739,192 |
| Mode M9 | |||
|---|---|---|---|
| Quadrant | BADHDUFLAG | Total packets | Discarded packets |
| A | 0 | 18 | 0 |
| B | 0 | 18 | 0 |
| C | 0 | 18 | 0 |
| D | 0 | 18 | 0 |
| Mode SS | |||
|---|---|---|---|
| Quadrant | BADHDUFLAG | Total packets | Discarded packets |
| A | 0 | 200 | 0 |
| B | 0 | 200 | 0 |
| C | 0 | 200 | 0 |
| D | 0 | 200 | 0 |
| Mode M0 | |||
|---|---|---|---|
| Quadrant | BADHDUFLAG | Total packets | Discarded packets |
| A | 0 | 20308 | 0 |
| B | 0 | 20534 | 0 |
| C | 0 | 20689 | 0 |
| D | 0 | 23524 | 0 |
| Quadrant | Total seconds | Saturated seconds | Saturation percentage |
|---|---|---|---|
| A | 9928 | 155 | 1.561241% |
| B | 9928 | 154 | 1.551168% |
| C | 9928 | 230 | 2.316680% |
| D | 9928 | 260 | 2.618856% |
Noise dominated data is calculated using 1-second bins in cleaned event files. If a bin has >2000 counts, and if more than 50% of those come from <1% of pixels, then it is considered to be noise-dominated and hence unusable.
| Quadrant | # 1 sec bins | Bins with >0 counts | Bins with >2000 counts | High rate bins dominated by noise | Noise dominated (total time) | Noise dominated (detector-on time) | Marked lightcurve |
|---|---|---|---|---|---|---|---|
| A | 11673 | 9928 | 0 | 0 | 0.00% | 0.00% |  |
| B | 11672 | 9926 | 0 | 0 | 0.00% | 0.00% |  |
| C | 11673 | 9928 | 0 | 0 | 0.00% | 0.00% |  |
| D | 11673 | 9925 | 0 | 0 | 0.00% | 0.00% |  |
Top three noisy pixels from each quadrant. If the there are fewer than three noisy pixels in the level2.evt file, extra rows are filled as -1
| Pixel properties | Quadrant properties | ||||||
|---|---|---|---|---|---|---|---|
| Quadrant | DetID | PixID | Counts | Sigma | Mean | Median | Sigma |
| A | 0 | 29 | 482 | 8.39 | 156 | 147 | 39.9 |
| A | 9 | 19 | 479 | 8.32 | 156 | 147 | 39.9 |
| A | 7 | 110 | 451 | 7.62 | 156 | 147 | 39.9 |
| B | 2 | 9 | 479 | 10.66 | 152 | 145 | 31.3 |
| B | 5 | 128 | 414 | 8.58 | 152 | 145 | 31.3 |
| B | 14 | 254 | 412 | 8.52 | 152 | 145 | 31.3 |
| C | 1 | 81 | 468 | 7.82 | 155 | 147 | 41.0 |
| C | 1 | 80 | 458 | 7.58 | 155 | 147 | 41.0 |
| C | 3 | 202 | 435 | 7.02 | 155 | 147 | 41.0 |
| D | 6 | 231 | 374 | 5.87 | 147 | 135 | 40.7 |
| D | 7 | 3 | 371 | 5.8 | 147 | 135 | 40.7 |
| D | 15 | 46 | 370 | 5.77 | 147 | 135 | 40.7 |
Histogram calculated using DETX and DETY for each event in the final _common_clean file
| Quadrant A |  |
 |
Quadrant B |
|---|---|---|---|
| Quadrant D | 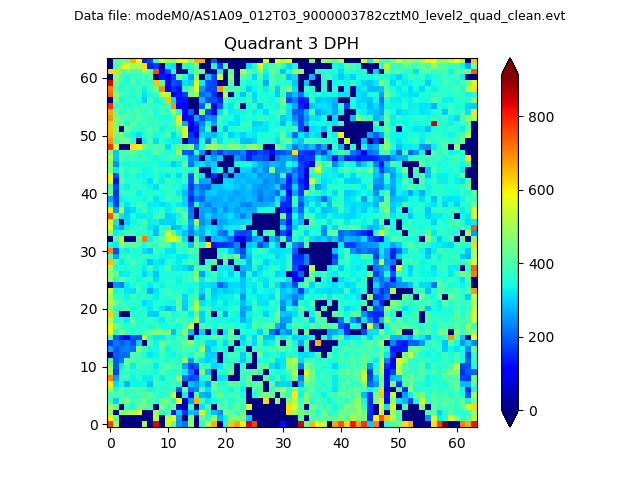 |
 |
Quadrant C |
| Plot type | Count rate plots | Images |
|---|---|---|
| Comparison with Poisson distribution Blue bars denote a histogram of data divided into 1 sec bins. Red curve is a Poisson curve with rate = median count rate of data. |
 |
 |
| Quadrant-wise count rates Data is divided into 100 sec bins |
 |
|
| Module-wise count rates for Quadrant A Data is divided into 100 sec bins |
 |
 |
| Module-wise count rates for Quadrant B Data is divided into 100 sec bins |
 |
 |
| Module-wise count rates for Quadrant C Data is divided into 100 sec bins |
 |
 |
| Module-wise count rates for Quadrant D Data is divided into 100 sec bins |
 |
 |
| Parameter | Plot |
|---|---|
| CZT HV Monitor |  |
| D_VDD |  |
| Temperature 1 |  |
| Veto HV Monitor |  |
| Veto LLD |  |
| Alpha Counter |  |
| _CPM_Rate |  |
| CZT Counter |  |
| +2.5 Volts monitor |  |
| +5 Volts monitor |  |
| _ROLL_ROT |  |
| _Roll_DEC |  |
| _Roll_RA |  |
| Veto Counter |  |