| Param | Original file | Final file |
|---|---|---|
| Filename | modeM0/AS1A09_012T03_9000003782_26187cztM0_level2.evt | modeM0/AS1A09_012T03_9000003782_26187cztM0_level2_quad_clean.evt |
| Size (bytes) | 161,182,080 | 46,071,360 |
| Size | 153.7 MB | 43.9 MB |
| Events in quadrant A | 1,108,745 | 309,962 |
| Events in quadrant B | 1,123,647 | 319,653 |
| Events in quadrant C | 1,176,890 | 306,792 |
| Events in quadrant D | 1,322,241 | 301,582 |
| Mode M9 | |||
|---|---|---|---|
| Quadrant | BADHDUFLAG | Total packets | Discarded packets |
| A | 0 | 11 | 0 |
| B | 0 | 11 | 0 |
| C | 0 | 11 | 0 |
| D | 0 | 11 | 0 |
| Mode M0 | |||
|---|---|---|---|
| Quadrant | BADHDUFLAG | Total packets | Discarded packets |
| A | 0 | 4579 | 0 |
| B | 0 | 4593 | 0 |
| C | 0 | 4756 | 0 |
| D | 0 | 5252 | 0 |
| Quadrant | Total seconds | Saturated seconds | Saturation percentage |
|---|---|---|---|
| A | 2175 | 60 | 2.758621% |
| B | 2174 | 45 | 2.069917% |
| C | 2174 | 82 | 3.771849% |
| D | 2174 | 98 | 4.507820% |
Noise dominated data is calculated using 1-second bins in cleaned event files. If a bin has >2000 counts, and if more than 50% of those come from <1% of pixels, then it is considered to be noise-dominated and hence unusable.
| Quadrant | # 1 sec bins | Bins with >0 counts | Bins with >2000 counts | High rate bins dominated by noise | Noise dominated (total time) | Noise dominated (detector-on time) | Marked lightcurve |
|---|---|---|---|---|---|---|---|
| A | 3235 | 2176 | 0 | 0 | 0.00% | 0.00% | 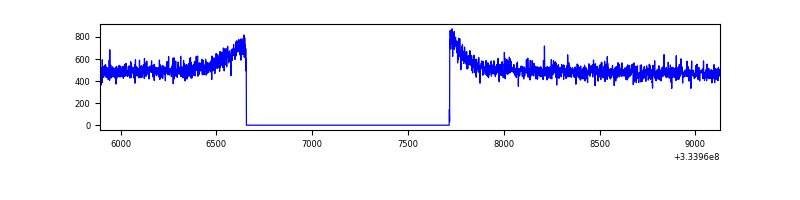 |
| B | 3234 | 2175 | 0 | 0 | 0.00% | 0.00% | 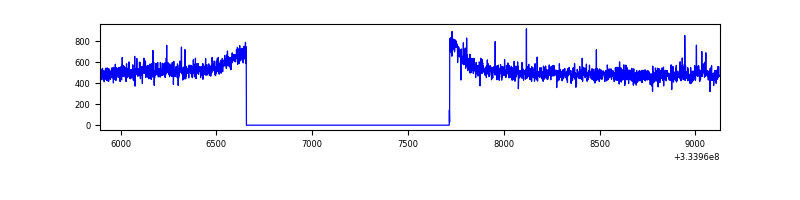 |
| C | 3234 | 2175 | 0 | 0 | 0.00% | 0.00% | 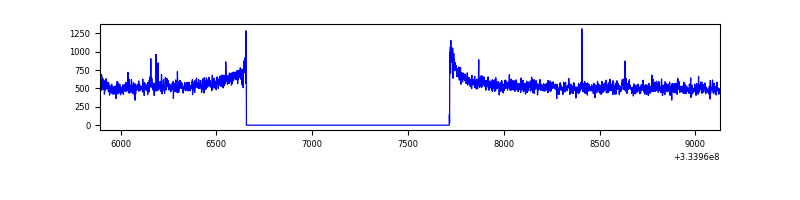 |
| D | 3234 | 2175 | 16 | 16 | 0.49% | 0.74% | 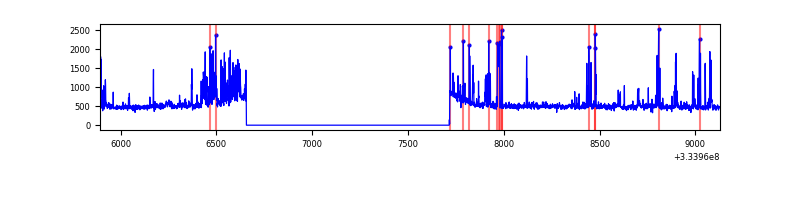 |
Top three noisy pixels from each quadrant. If the there are fewer than three noisy pixels in the level2.evt file, extra rows are filled as -1
| Pixel properties | Quadrant properties | ||||||
|---|---|---|---|---|---|---|---|
| Quadrant | DetID | PixID | Counts | Sigma | Mean | Median | Sigma |
| A | 13 | 254 | 3268 | 50.15 | 287 | 279 | 59.6 |
| A | 3 | 137 | 2578 | 38.57 | 287 | 279 | 59.6 |
| A | 0 | 226 | 2428 | 36.05 | 287 | 279 | 59.6 |
| B | 0 | 230 | 7214 | 125.86 | 284 | 276 | 55.1 |
| B | 12 | 111 | 6507 | 113.03 | 284 | 276 | 55.1 |
| B | 11 | 111 | 6062 | 104.96 | 284 | 276 | 55.1 |
| C | 14 | 238 | 45017 | 667.61 | 282 | 282 | 67.0 |
| C | 2 | 16 | 21052 | 309.96 | 282 | 282 | 67.0 |
| C | 3 | 233 | 10349 | 150.24 | 282 | 282 | 67.0 |
| D | 1 | 52 | 242919 | 3570.16 | 284 | 276 | 68.0 |
| D | 2 | 234 | 8001 | 113.66 | 284 | 276 | 68.0 |
| D | 3 | 238 | 3029 | 40.51 | 284 | 276 | 68.0 |
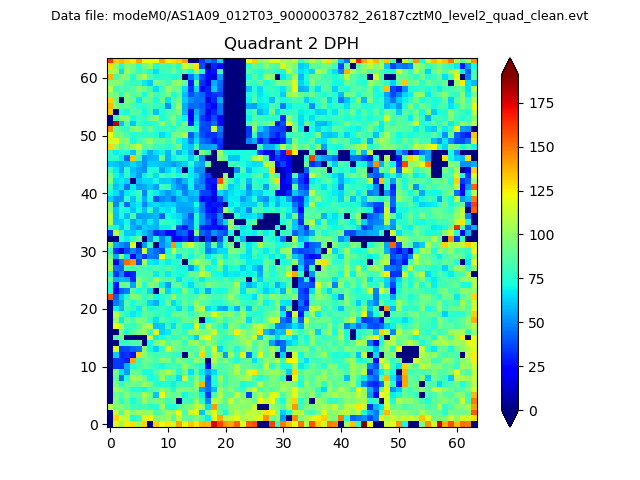
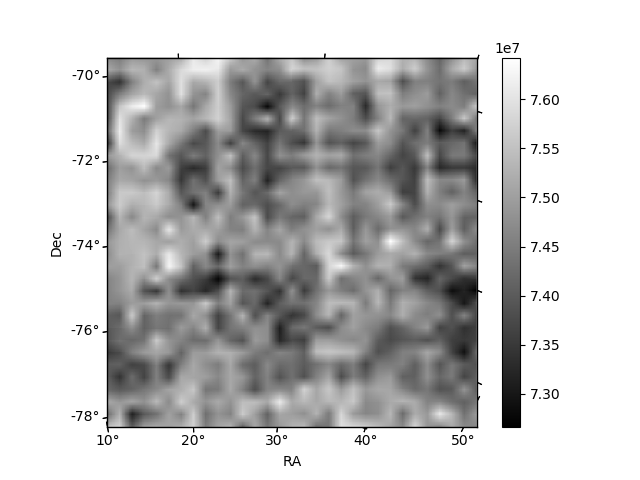
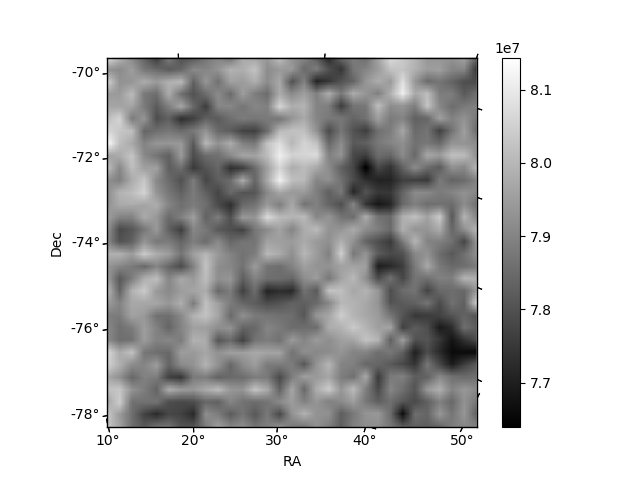
Histogram calculated using DETX and DETY for each event in the final _common_clean file
| Quadrant A | 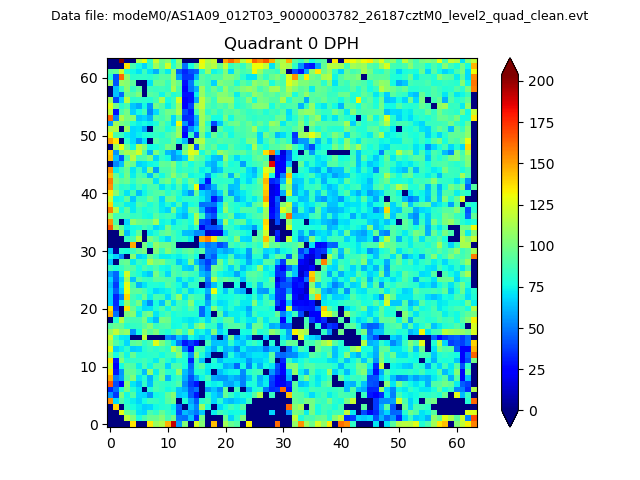 |
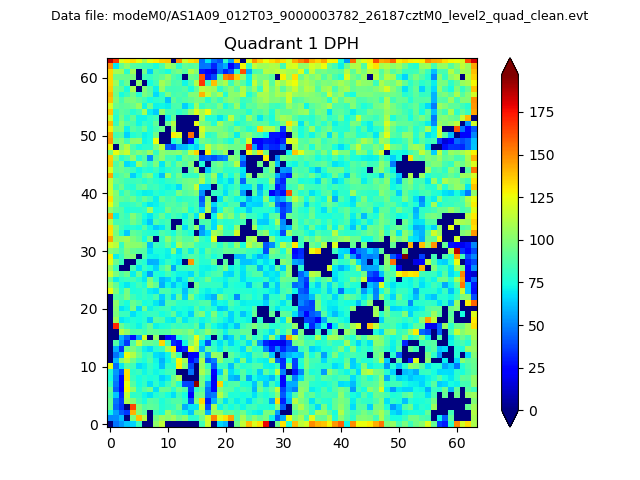 |
Quadrant B |
|---|---|---|---|
| Quadrant D | 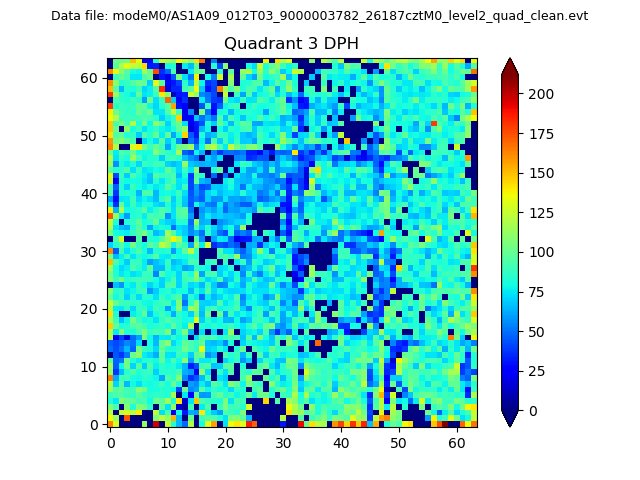 |
 |
Quadrant C |
| Plot type | Count rate plots | Images |
|---|---|---|
| Comparison with Poisson distribution Blue bars denote a histogram of data divided into 1 sec bins. Red curve is a Poisson curve with rate = median count rate of data. |
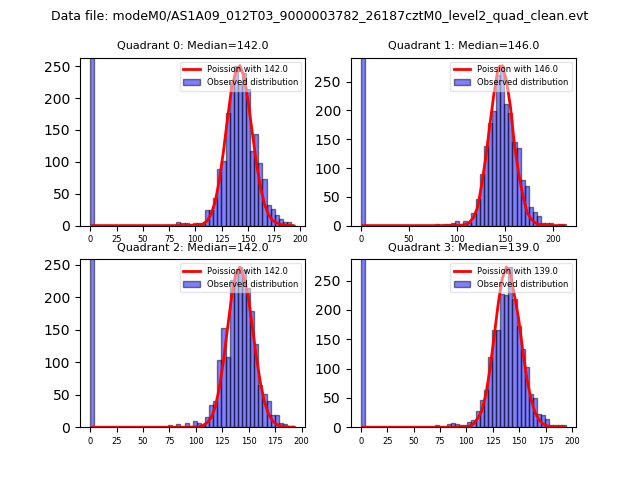 |
 |
| Quadrant-wise count rates Data is divided into 100 sec bins |
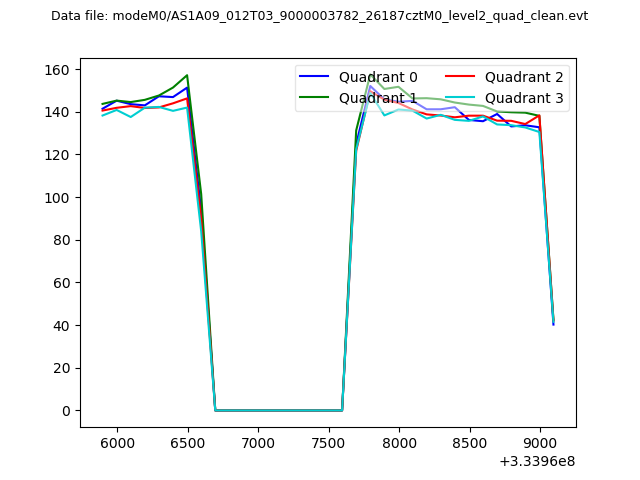 |
|
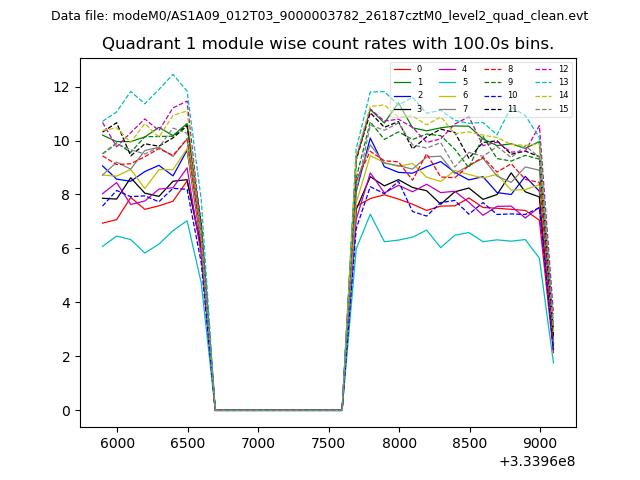
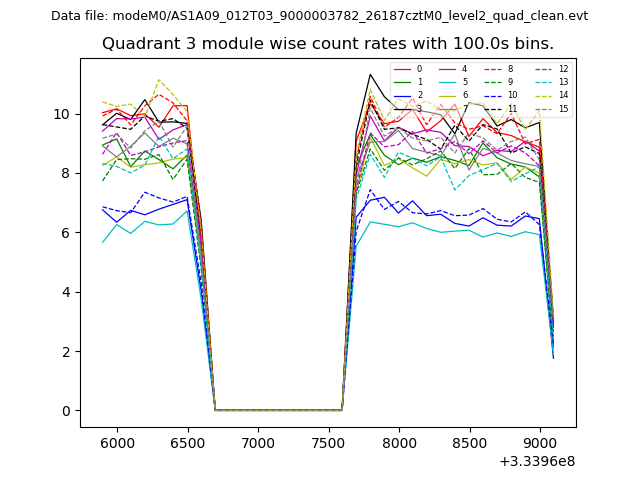
| Module-wise count rates for Quadrant A Data is divided into 100 sec bins |
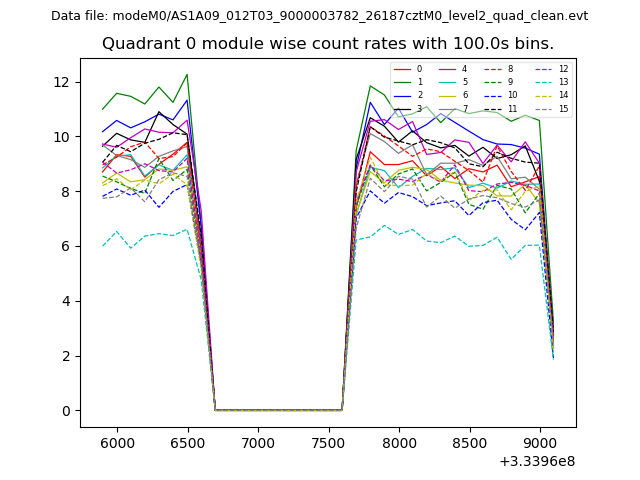 |
 |
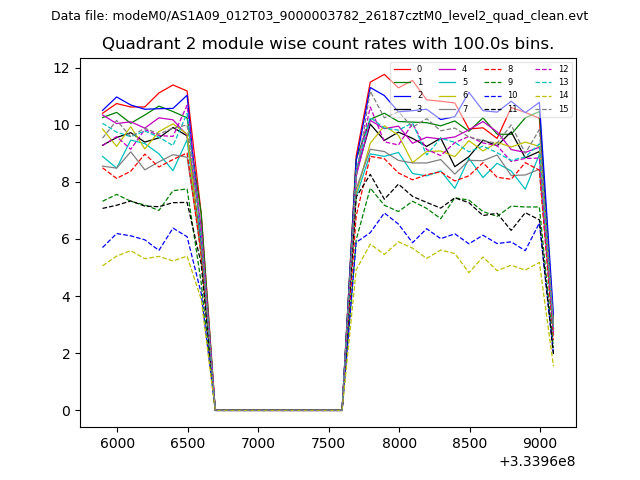
| Module-wise count rates for Quadrant B Data is divided into 100 sec bins |
 |
 |
| Module-wise count rates for Quadrant C Data is divided into 100 sec bins |
 |
 |
| Module-wise count rates for Quadrant D Data is divided into 100 sec bins |
 |
 |
| Parameter | Plot |
|---|---|
| CZT HV Monitor | 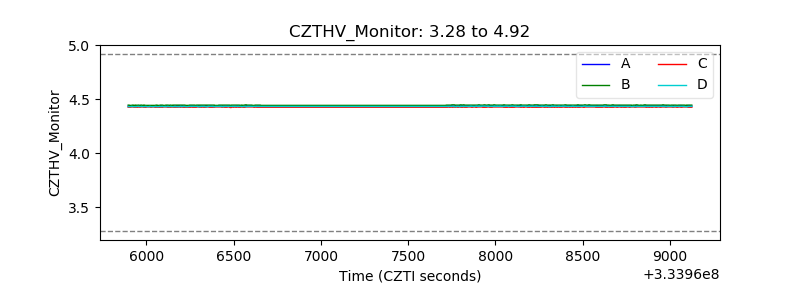 |
| D_VDD | 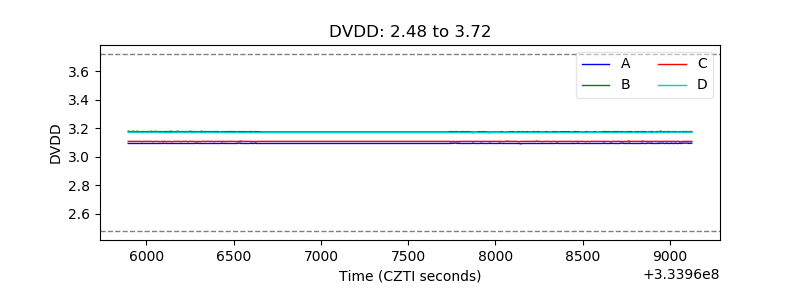 |
| Temperature 1 | 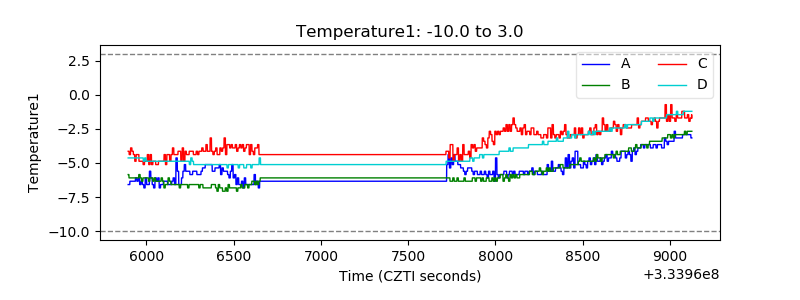 |
| Veto HV Monitor | 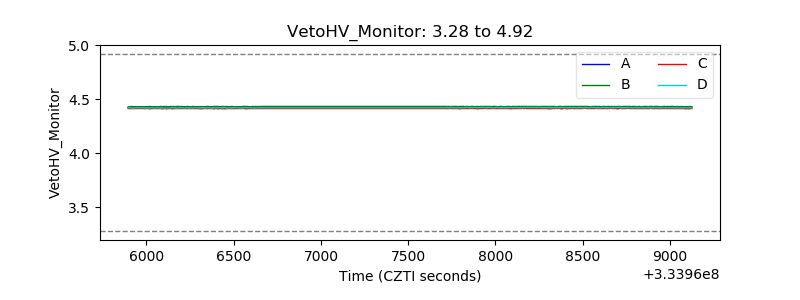 |
| Veto LLD | 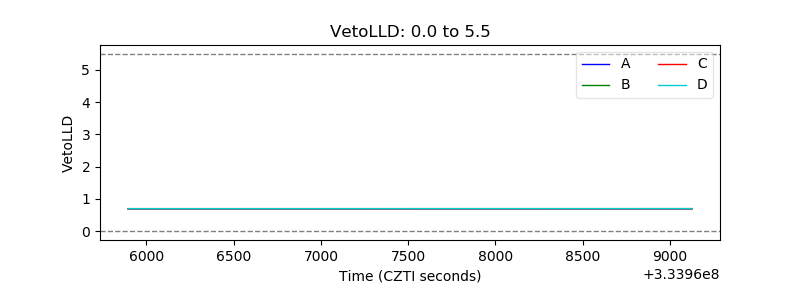 |
| Alpha Counter | 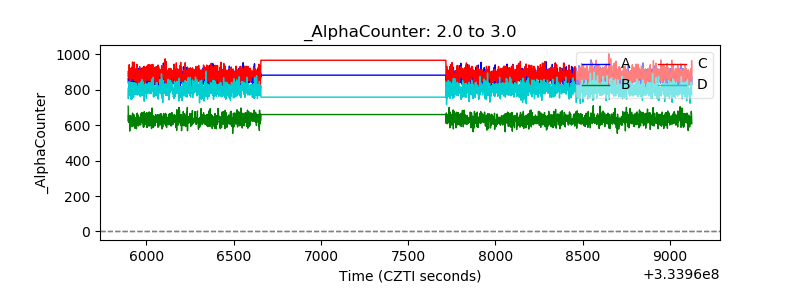 |
| _CPM_Rate | 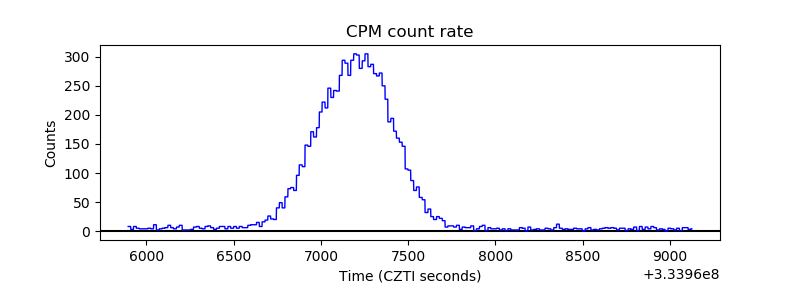 |
| CZT Counter | 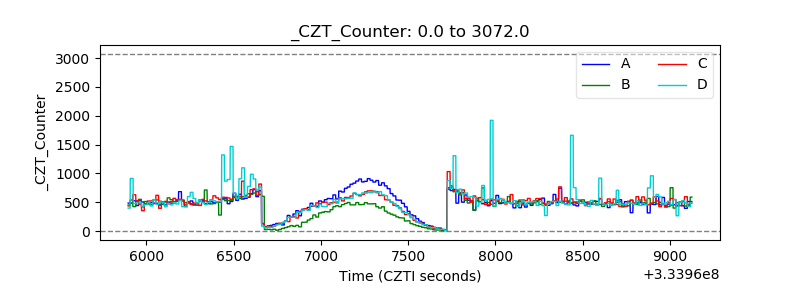 |
| +2.5 Volts monitor |  |
| +5 Volts monitor | 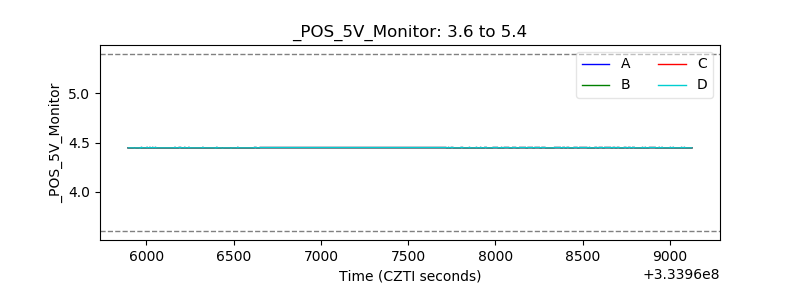 |
| _ROLL_ROT | 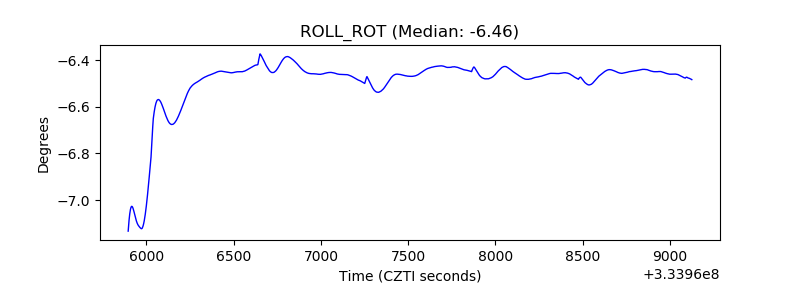 |
| _Roll_DEC | 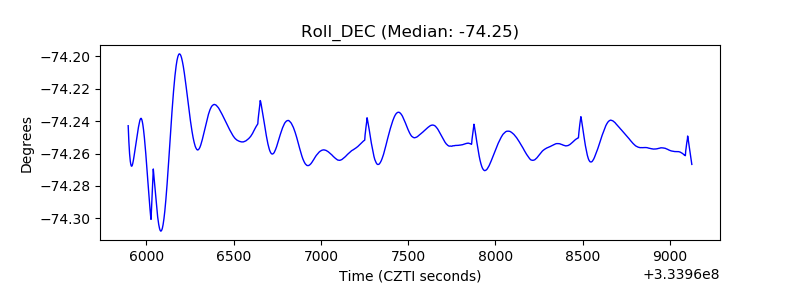 |
| _Roll_RA | 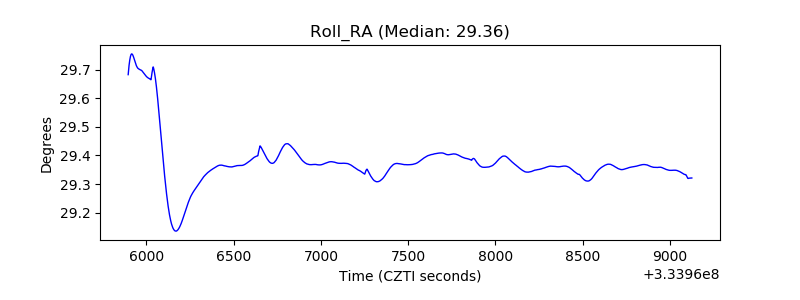 |
| Veto Counter | 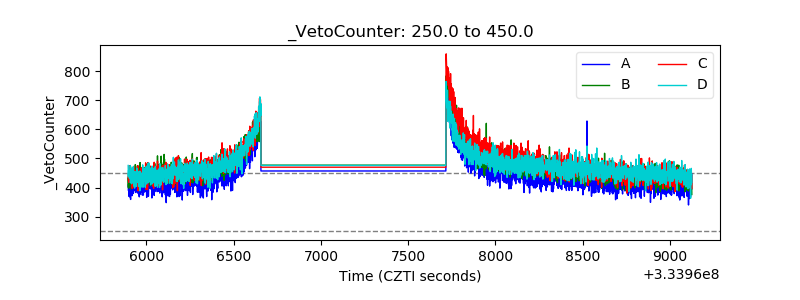 |