| Param | Original file | Final file |
|---|---|---|
| Filename | modeM0/AS1A09_012T03_9000003782_26188cztM0_level2.evt | modeM0/AS1A09_012T03_9000003782_26188cztM0_level2_quad_clean.evt |
| Size (bytes) | 476,688,960 | 137,773,440 |
| Size | 454.6 MB | 131.4 MB |
| Events in quadrant A | 3,239,330 | 919,382 |
| Events in quadrant B | 3,353,378 | 938,257 |
| Events in quadrant C | 3,401,543 | 924,247 |
| Events in quadrant D | 3,970,227 | 907,278 |
| Mode M9 | |||
|---|---|---|---|
| Quadrant | BADHDUFLAG | Total packets | Discarded packets |
| A | 0 | 7 | 0 |
| B | 0 | 7 | 0 |
| C | 0 | 7 | 0 |
| D | 0 | 7 | 0 |
| Mode M0 | |||
|---|---|---|---|
| Quadrant | BADHDUFLAG | Total packets | Discarded packets |
| A | 0 | 14124 | 0 |
| B | 0 | 14280 | 0 |
| C | 0 | 14353 | 0 |
| D | 0 | 16288 | 0 |
| Quadrant | Total seconds | Saturated seconds | Saturation percentage |
|---|---|---|---|
| A | 6948 | 91 | 1.309729% |
| B | 6949 | 110 | 1.582962% |
| C | 6949 | 156 | 2.244927% |
| D | 6949 | 146 | 2.101022% |
Noise dominated data is calculated using 1-second bins in cleaned event files. If a bin has >2000 counts, and if more than 50% of those come from <1% of pixels, then it is considered to be noise-dominated and hence unusable.
| Quadrant | # 1 sec bins | Bins with >0 counts | Bins with >2000 counts | High rate bins dominated by noise | Noise dominated (total time) | Noise dominated (detector-on time) | Marked lightcurve |
|---|---|---|---|---|---|---|---|
| A | 7633 | 6949 | 0 | 0 | 0.00% | 0.00% | 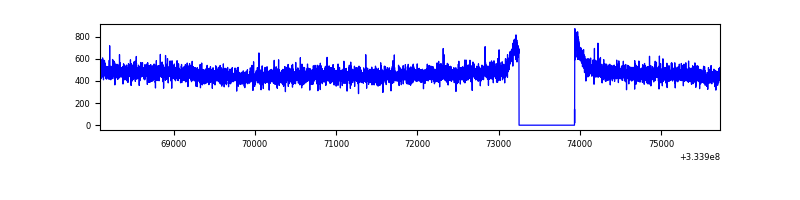 |
| B | 7634 | 6950 | 0 | 0 | 0.00% | 0.00% | 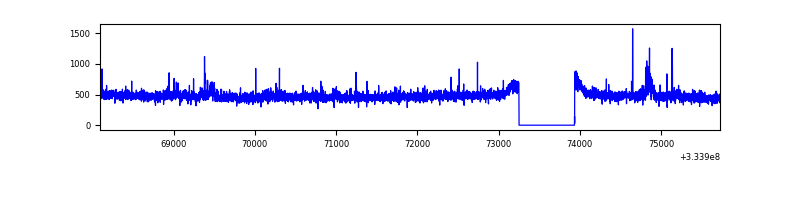 |
| C | 7634 | 6950 | 2 | 2 | 0.03% | 0.03% | 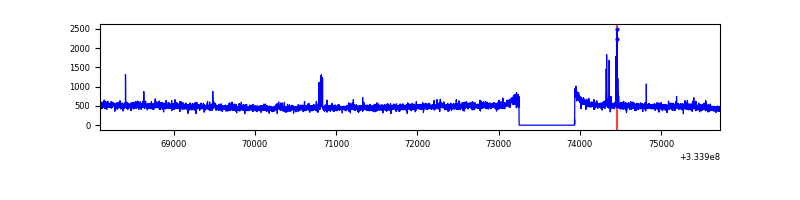 |
| D | 7634 | 6950 | 80 | 80 | 1.05% | 1.15% | 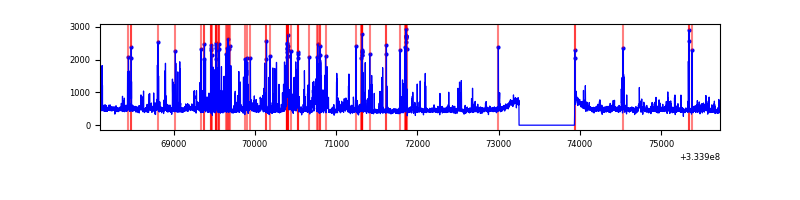 |
Top three noisy pixels from each quadrant. If the there are fewer than three noisy pixels in the level2.evt file, extra rows are filled as -1
| Pixel properties | Quadrant properties | ||||||
|---|---|---|---|---|---|---|---|
| Quadrant | DetID | PixID | Counts | Sigma | Mean | Median | Sigma |
| A | 13 | 254 | 10584 | 58.6 | 838 | 821 | 166.6 |
| A | 3 | 137 | 7655 | 41.02 | 838 | 821 | 166.6 |
| A | 0 | 226 | 7111 | 37.75 | 838 | 821 | 166.6 |
| B | 0 | 230 | 39447 | 247.7 | 832 | 813 | 156.0 |
| B | 0 | 190 | 29236 | 182.23 | 832 | 813 | 156.0 |
| B | 0 | 245 | 23784 | 147.28 | 832 | 813 | 156.0 |
| C | 14 | 238 | 133757 | 706.77 | 817 | 820 | 188.1 |
| C | 2 | 16 | 64556 | 338.86 | 817 | 820 | 188.1 |
| C | 3 | 233 | 20926 | 106.9 | 817 | 820 | 188.1 |
| D | 1 | 52 | 672939 | 3437.23 | 827 | 808 | 195.5 |
| D | 12 | 233 | 110647 | 561.71 | 827 | 808 | 195.5 |
| D | 2 | 120 | 36118 | 180.57 | 827 | 808 | 195.5 |
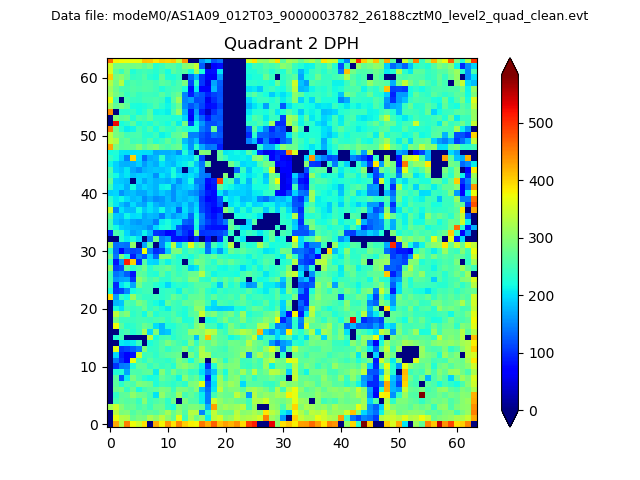
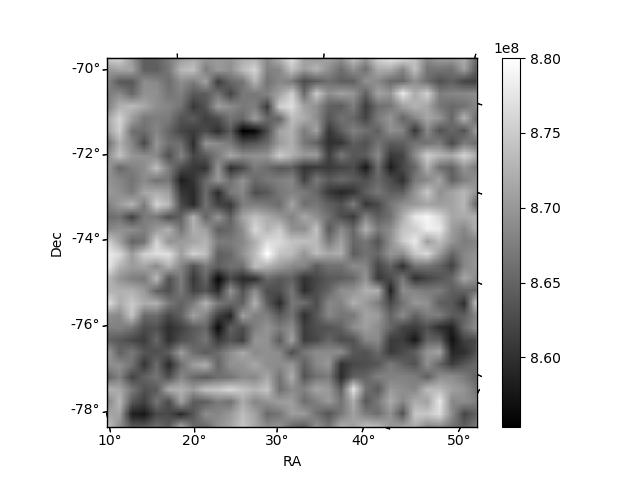
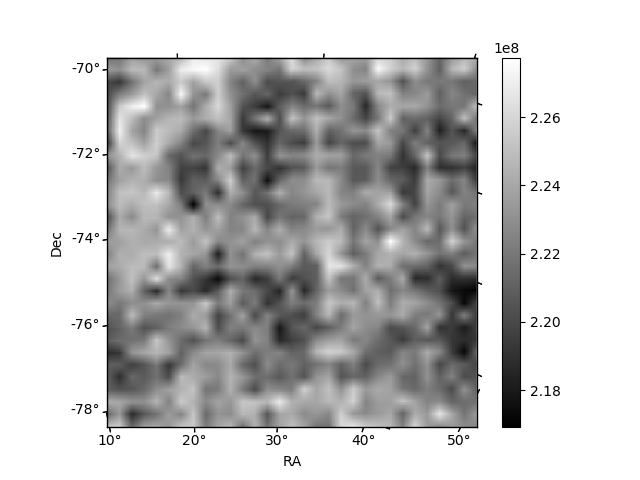
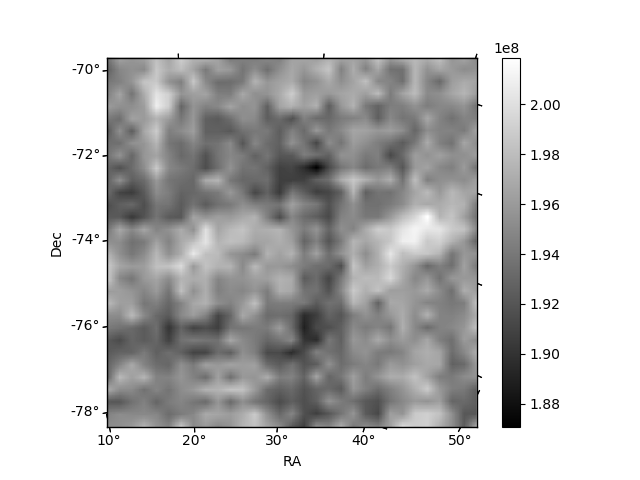
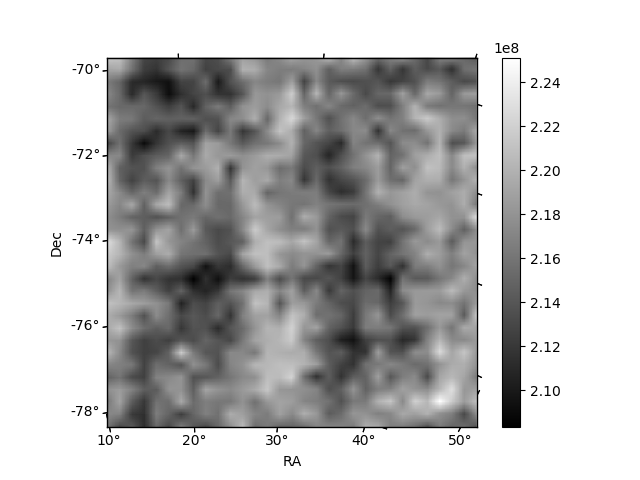
Histogram calculated using DETX and DETY for each event in the final _common_clean file
| Quadrant A | 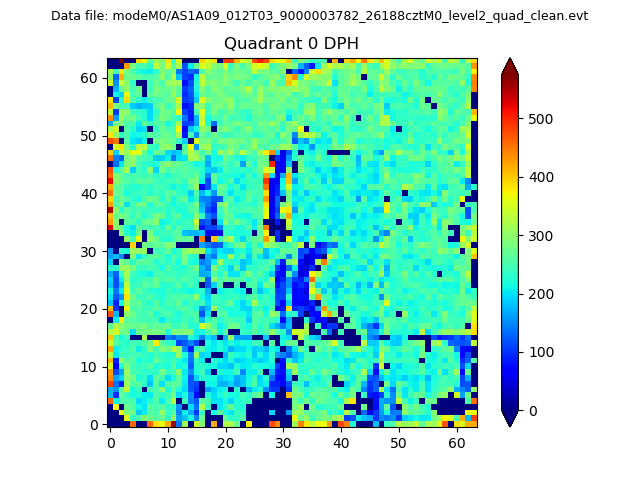 |
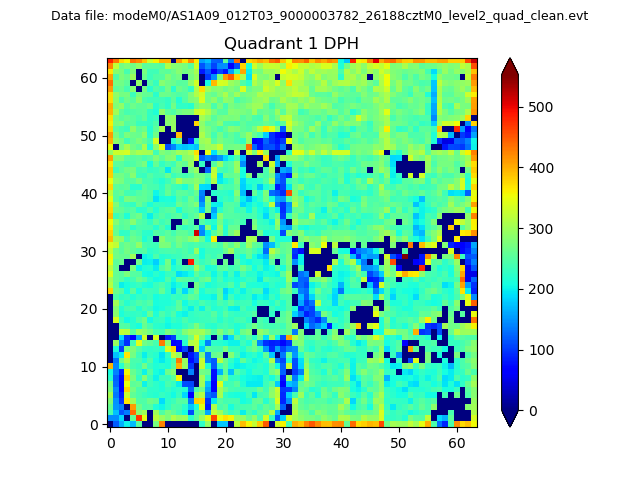 |
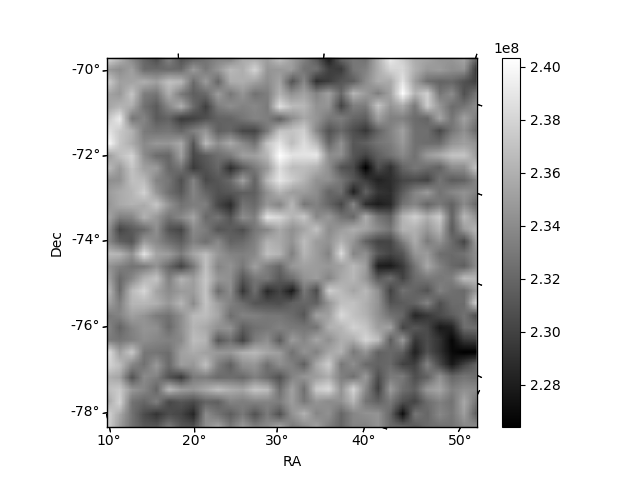
Quadrant B |
|---|---|---|---|
| Quadrant D | 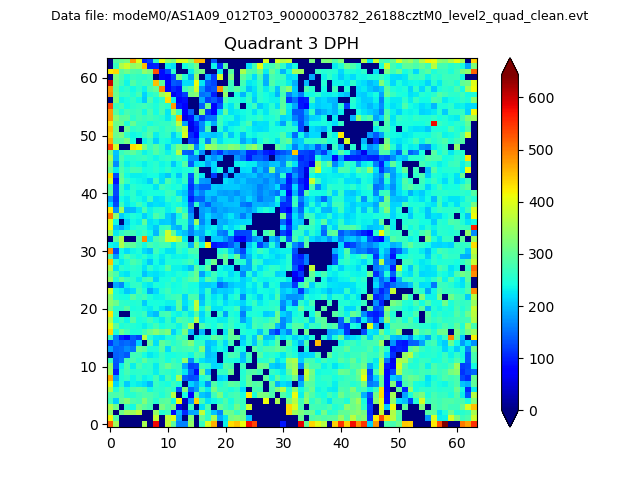 |
 |
Quadrant C |
| Plot type | Count rate plots | Images |
|---|---|---|
| Comparison with Poisson distribution Blue bars denote a histogram of data divided into 1 sec bins. Red curve is a Poisson curve with rate = median count rate of data. |
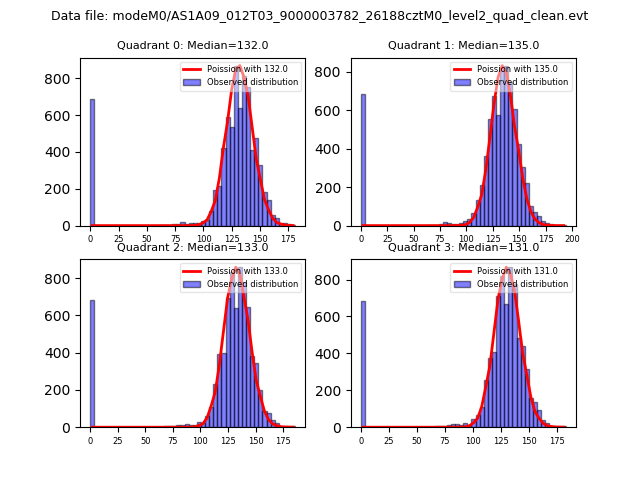 |
 |
| Quadrant-wise count rates Data is divided into 100 sec bins |
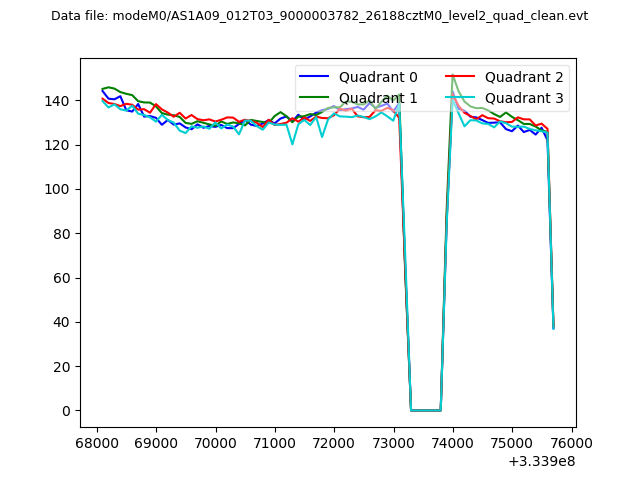 |
|
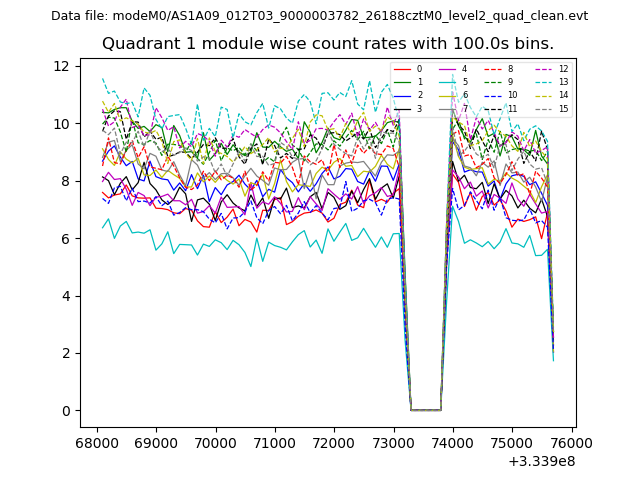
| Module-wise count rates for Quadrant A Data is divided into 100 sec bins |
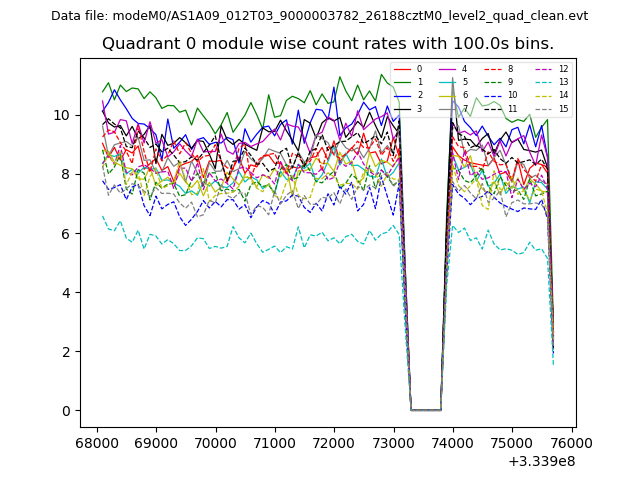 |
 |
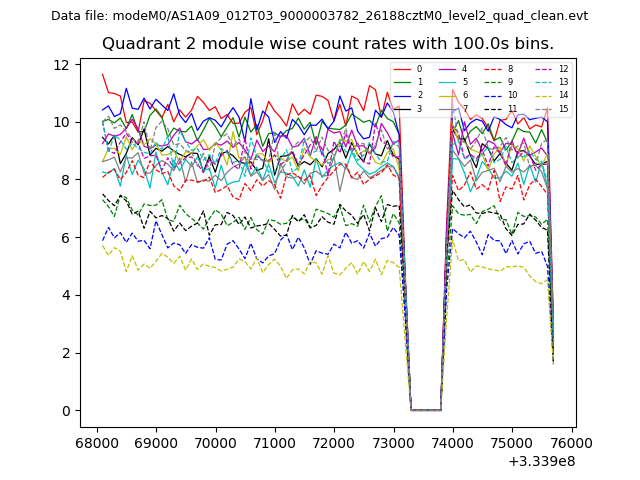
| Module-wise count rates for Quadrant B Data is divided into 100 sec bins |
 |
 |
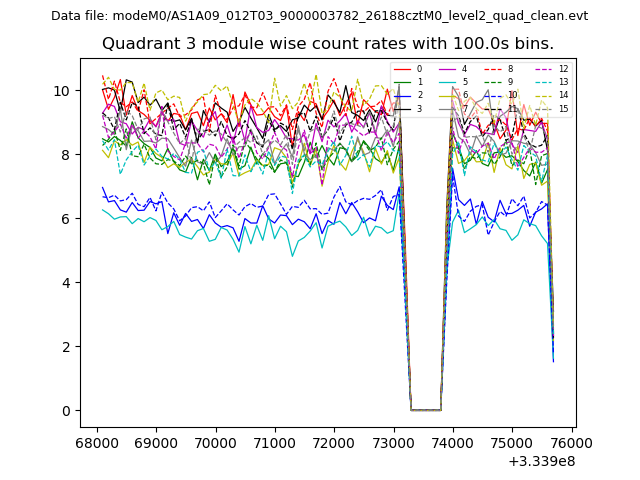
| Module-wise count rates for Quadrant C Data is divided into 100 sec bins |
 |
 |
| Module-wise count rates for Quadrant D Data is divided into 100 sec bins |
 |
 |
| Parameter | Plot |
|---|---|
| CZT HV Monitor | 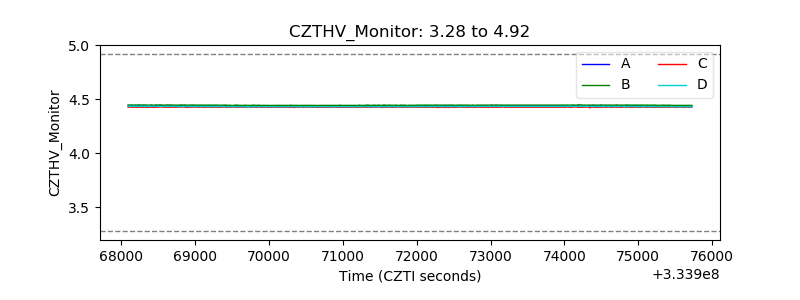 |
| D_VDD | 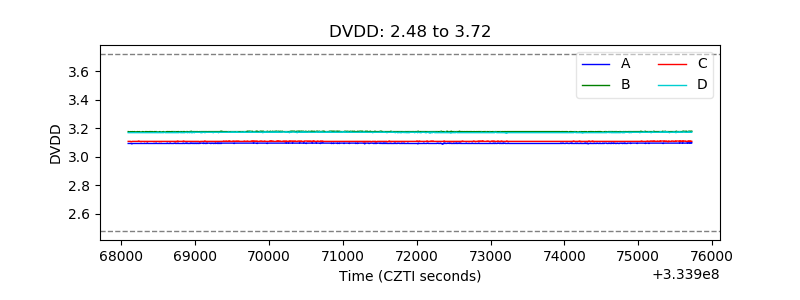 |
| Temperature 1 |  |
| Veto HV Monitor | 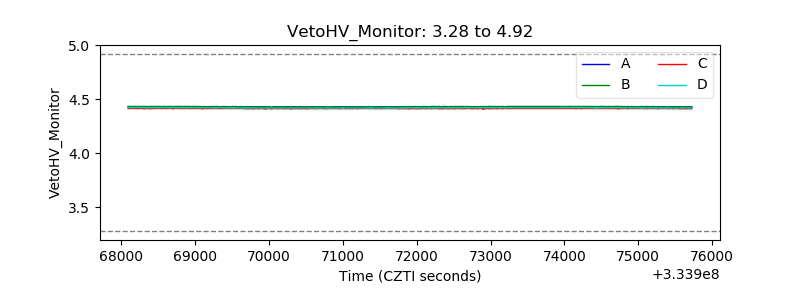 |
| Veto LLD | 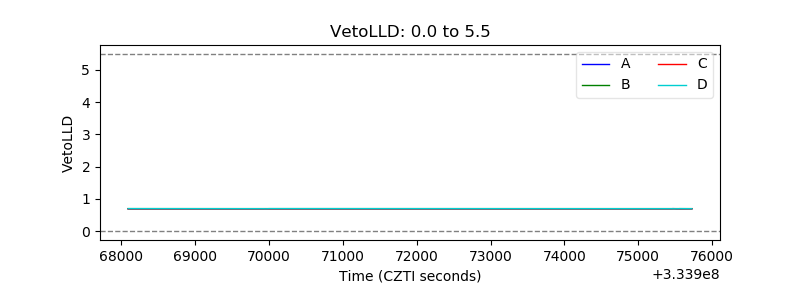 |
| Alpha Counter |  |
| _CPM_Rate | 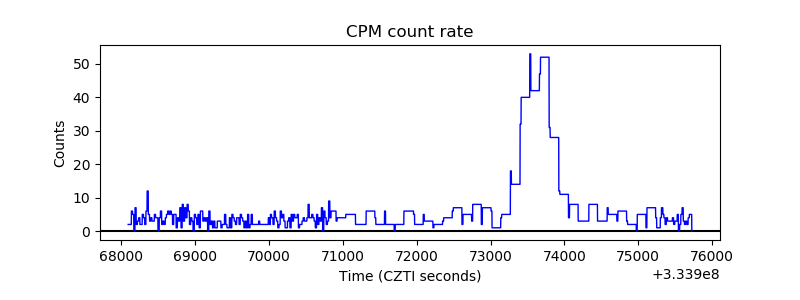 |
| CZT Counter | 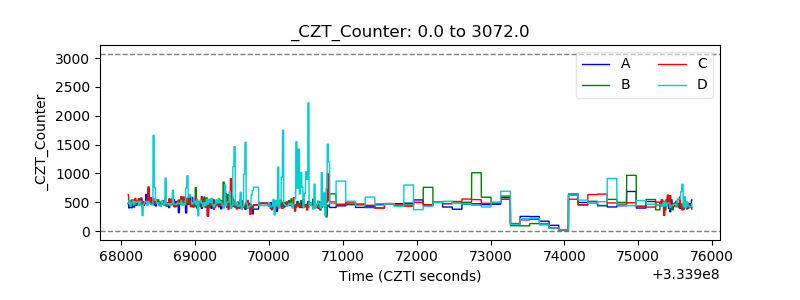 |
| +2.5 Volts monitor |  |
| +5 Volts monitor |  |
| _ROLL_ROT | 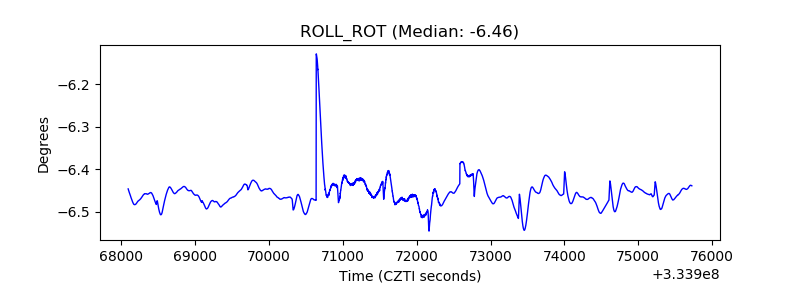 |
| _Roll_DEC | 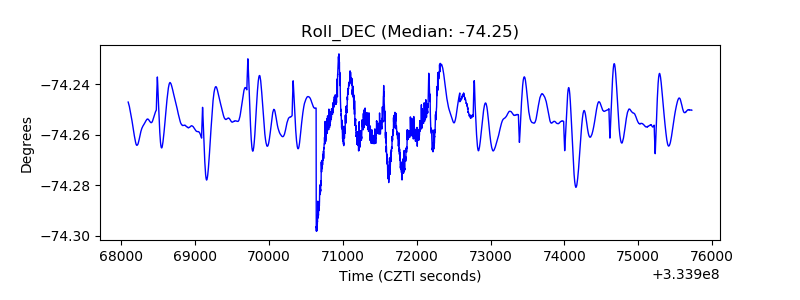 |
| _Roll_RA | 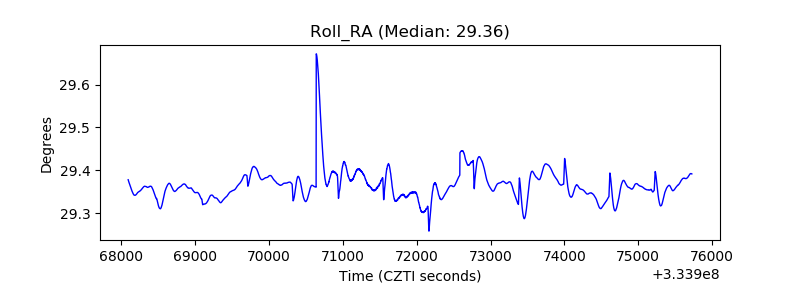 |
| Veto Counter | 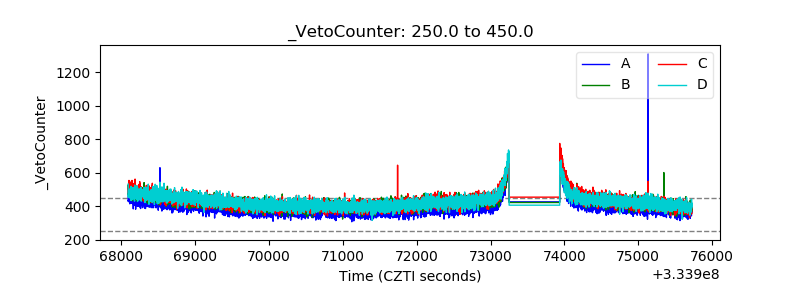 |